. 2016 Jul 21;1(11):e88544.
doi: 10.1172/jci.insight.88544.

A small-molecule inhibitor of SHIP1 reverses age- and diet-associated obesity and metabolic syndrome

Affiliations

A small-molecule inhibitor of SHIP1 reverses age- and diet-associated obesity and metabolic syndrome

Neetu Srivastava et al. JCI Insight. .

Abstract

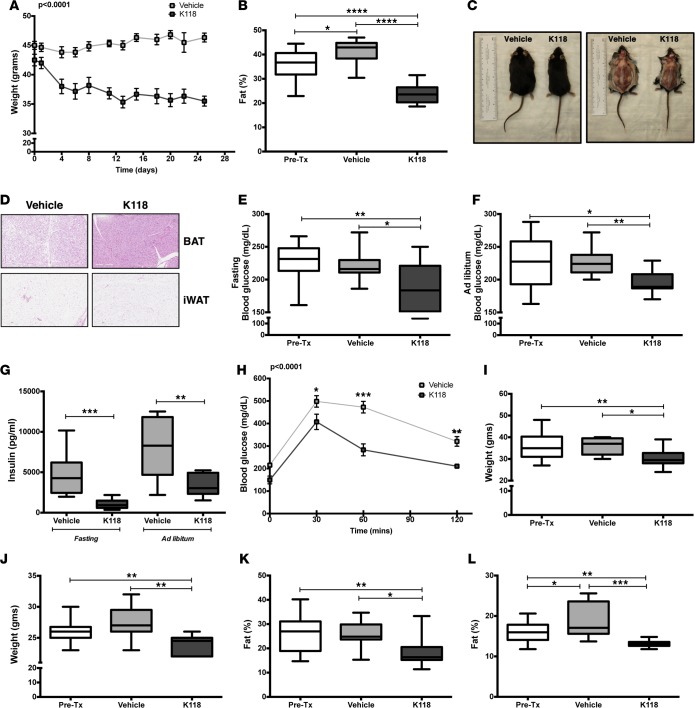
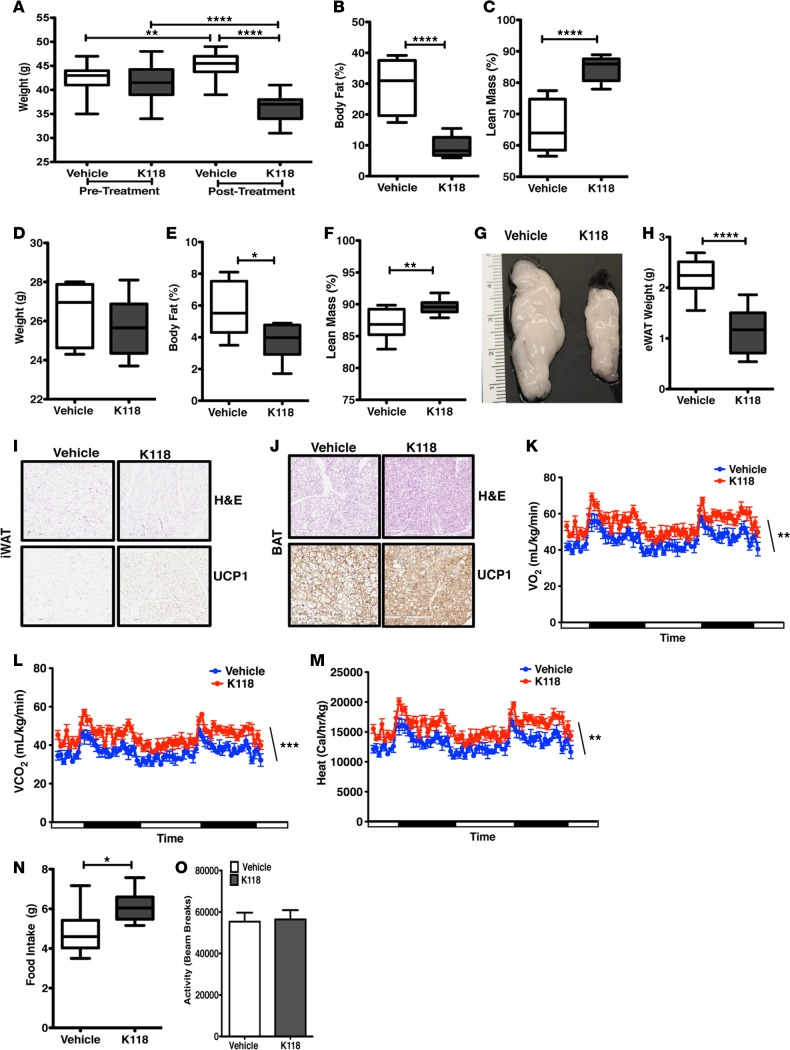
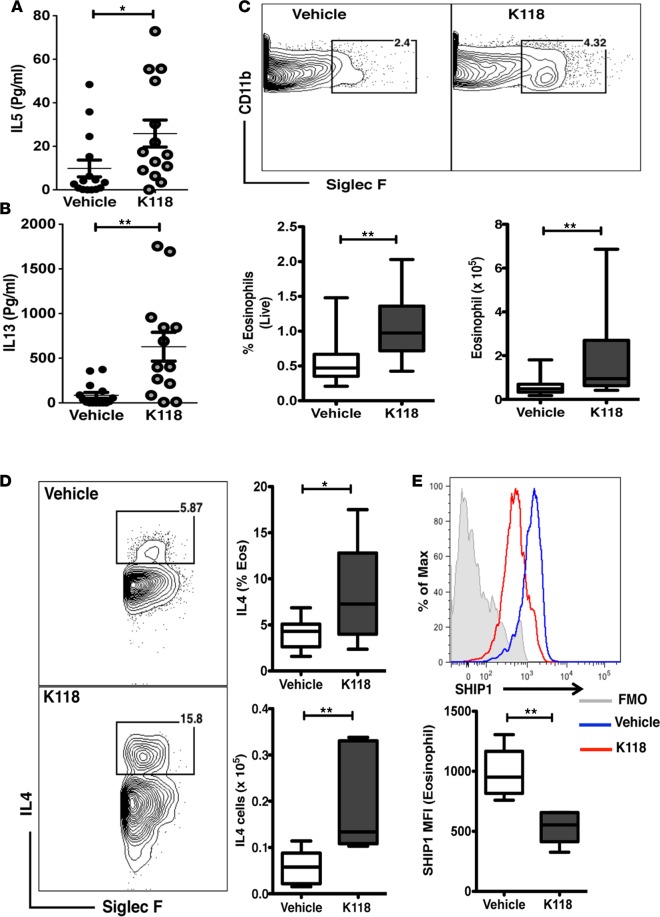
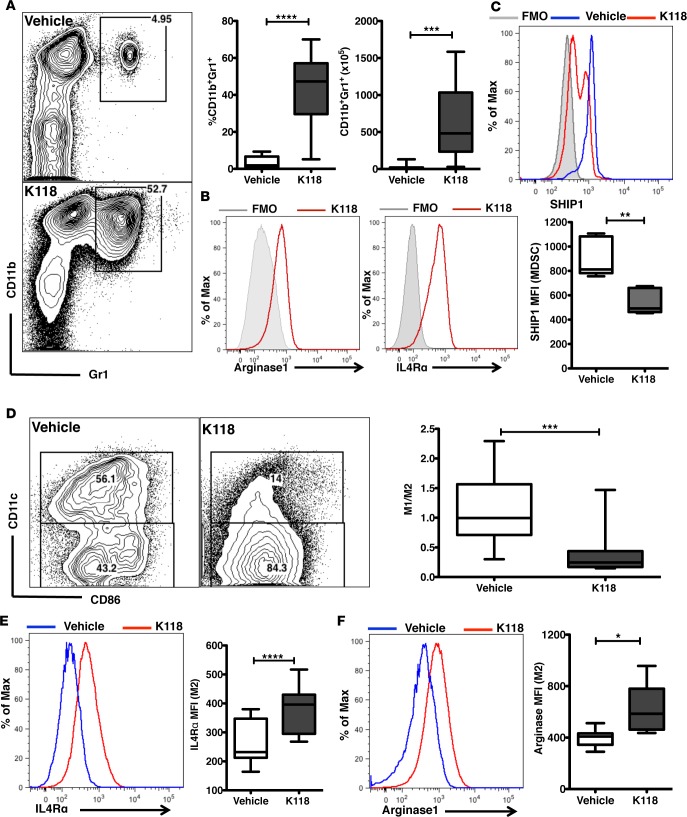
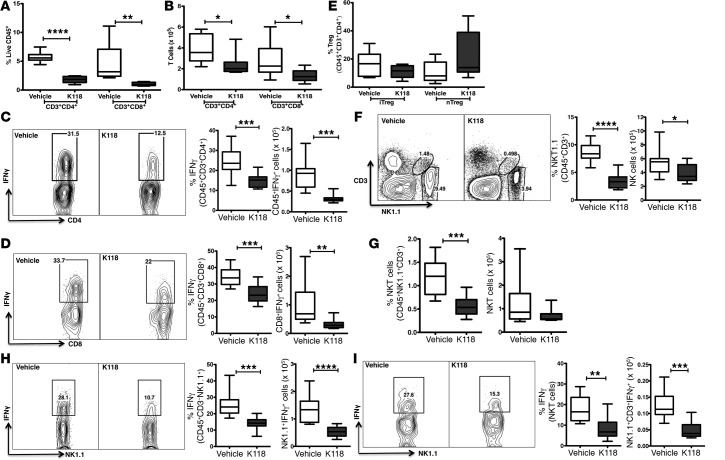
Low-grade chronic inflammation is a key etiological phenomenon responsible for the initiation and perpetuation of obesity and diabetes. Novel therapeutic approaches that can specifically target inflammatory pathways are needed to avert this looming epidemic of metabolic disorders. Genetic and chemical inhibition of SH2-containing inositol 5' phosphatase 1 (SHIP1) has been associated with systemic expansion of immunoregulatory cells that promote a lean-body state; however, SHIP1 function in immunometabolism has never been assessed. This led us to investigate the role of SHIP1 in metabolic disorders during excess caloric intake in mice. Using a small-molecule inhibitor of SHIP1 (SHIPi), here we show that SHIPi treatment in mice significantly reduces body weight and fat content, improves control of blood glucose and insulin sensitivity, and increases energy expenditure, despite continued consumption of a high-fat diet. Additionally, SHIPi reduces age-associated fat in mice. We found that SHIPi treatment reverses diet-associated obesity by attenuating inflammation in the visceral adipose tissue (VAT). SHIPi treatment increases IL-4-producing eosinophils in VAT and consequently increases both alternatively activated macrophages and myeloid-derived suppressor cells. In addition, SHIPi decreases the number of IFN-γ-producing T cells and NK cells in VAT. Thus, SHIPi represents an approach that permits control of obesity and diet-induced metabolic syndrome without apparent toxicity.


Figures

Figure 1
Figure 1. K118 treatment prevents obesity and improves glucose homeostasis.
Phenotypic and metabolic parameters were assessed in 14- to 16-week-old DIO mice treated with K118 (10 mg/kg body weight) or vehicle for 4 weeks (twice per week). (A) Growth curves were plotted to show the changes in body weight of vehicle- and K118-treated mice (n = 6). Two-way ANOVA tests for repeated measurement were performed; P < 0.0001. (B) Percentage of body fat was measured in vehicle- and K118-treated mice before (Pre-Tx) and after treatment (n = 10). (C) Representative gross appearance and comparison of fat depots of DIO mice after either vehicle or K118 treatment. (D) Representative H&E-stained sections of BAT (scale bar: 300 μm) and WAT (scale bar: 500 μm). (E) Fasting and (F) ad libitum blood glucose levels (mg/dl) in pretreated mice and vehicle- and K118-treated DIO C57BL/6 mice (n = 10). (G) Fasting and ad libitum serum insulin levels (pg/ml) measured in vehicle- and K118-treated DIO mice (n = 10). (H) i.p. glucose tolerance test on vehicle- and K118-treated DIO mice (n = 6). Two-way ANOVA tests for repeated measurement were performed followed by post-hoc Bonferroni test. (I and J) Body weight and percentage of fat were measured in aged C57BL/6 mice treated with K118 (10 mg/kg body weight) or vehicle for 4 weeks (twice per week). Changes in body weight of (I) male and (J) female 8- to 12-month-old vehicle- and K118-treated C57BL/6 mice before and after treatment (n = 10). (K and L) Percentage of body fat was measured in vehicle- and K118-treated (K) male and (L) female aged C57BL/6 mice before and after treatment (n = 10). All results are expressed as mean ± SEM. Student’s unpaired, 2-tailed t test, *P < 0.05, **P < 0.01, ***P < 0.001, ****P < 0.0001. WAT, white adipose tissue; BAT, brown adipose tissue; DIO, diet-induced obese. Box-and-whisker plots are defined as follows: the bounds of the boxes indicate SD; the lines within the boxes indicate means, and the whiskers represent minimum and maximum values.
Figure 2
Figure 2. K118 limits adiposity and increase energy expenditure in DIO mice.
(A) Metabolic parameters were assessed in diet-induced obese (DIO) mice treated with K118 (10 mg/kg body weight) or vehicle for 2 weeks (twice per week). Body weight measurements before treatment and after K118 or vehicle treatment of DIO mice (n = 26). (B and C) Body composition measurement showing (B) percentage of body fat and (C) percentage of lean mass after 2 weeks of K118 treatment (n = 7–8). (DF) Body composition analysis of chow-fed lean young mice treated with K118 or vehicle for 2 weeks (n = 8). (G) Representative image and (H) weight of epidydimal white adipose tissue (eWAT) of K118- and vehicle-treated DIO mice (n = 13–15). Student’s t test. Data are represented as mean ± SEM. (I) Representative H&E-stained sections of iWAT of vehicle- and K118-administered mice (top) and UCP1 (bottom) (original magnification, ×200). (J) Representative H&E-stained sections (scale bar: 300 μm) and UCP1-stained sections (scale bar: 200 μm) of brown adipose tissue (BAT) of vehicle- and K118-administered mice. (KM) CLAMS analysis using individually housed groups of K118- and vehicle-administered mice after 2 weeks of treatment. Plots represent variations in (K) oxygen consumption, (L) CO2 release, and (M) energy expenditure over time in vehicle- vs. K118-treated mice (n = 7–8) as indicated. Statistical analysis was performed using 2-way repeated-measures ANOVA for energy expenditure experiments. Error bars represent the mean ± SEM. White and black rectangular lines on the X-axis represent light and dark cycles respectively. (N) Cumulative food intake and (O) total physical activity in K118- and vehicle-treated DIO mice (n = 7–8). Student’s t test, *P < 0.05, **P < 0.01, ***P < 0.001, ****P < 0.0001. Data are represented as mean ± SEM. Sample sizes are biological replicates. Experiments in BF and KO were performed independently by the Mouse Metabolic Phenotyping Center at the University of Cincinnati. CLAMS, Comprehensive Laboratory Animals Monitoring System. Box-and-whisker plots are defined as follows: the bounds of the boxes indicate SD; the lines within the boxes indicate means, and the whiskers represent minimum and maximum values.
Figure 3
Figure 3. K118 treatment increases eosinophils in the visceral adipose tissue of DIO mice.
(A and B) 14- to 16-week-old diet-induced obese (DIO) mice treated with K118 (10 mg/kg body weight) or water (vehicle) for 2 weeks (twice per week), followed by determination of IL-5 and IL-13 cytokines serum levels (pg/ml) by ELISA (n = 13–15). (C) Flow cytometry plots showing gating for eosinophils and frequency (total viable epidydimal white adipose tissue [eWAT]) and number of eosinophils in the eWAT of K118- and vehicle-treated mice (n = 15). (D) Flow cytometry plots showing analysis IL-4–expressing SiglecF+ eosinophils, their frequencies (percentage of eosinophils), and numbers in the eWAT (n = 10). (E) Expression of SHIP1 in the eosinophils of eWAT of DIO mice (n = 5) treated for 2 weeks with K118 (red) or vehicle (blue). Student’s t test,*P < 0.05,**P < 0.01. Data are represented as mean ± SEM. Sample sizes are biological replicates. Box-and-whisker plots are defined as follows: the bounds of the boxes indicate SD; the lines within the boxes indicate means, and the whiskers represent minimum and maximum values.
Figure 4
Figure 4. K118 treatment expands myeloid suppressor cells and promotes M2 polarization of visceral adipose tissue macrophages.
(A) Flow cytometry plots showing CD11b+Gr1+ cells (MDSC) in vehicle- and K118-treated mice, with box-and-whisker plots indicating their frequencies and numbers (n = 14–15). (B) Histogram showing expression of Arginase1 and IL4Rα (red) compared to fluorescence minus one (FMO, gray) control stain on CD11b+Gr1+ cells of K118-treated eWAT. (C) Expression of SHIP1 in the CD11b+Gr1+ cells of eWAT of DIO mice treated for 2 weeks with K118 (red) or vehicle (blue); FMO control is shown in gray (n = 5). (D) Flow cytometry plot showing M1 and M2 macrophages after first gating for live CD11b+F4/80+ cells (n = 14–15). (E) Expression of IL4Rα (n = 14–15) and (F) Arginase1 (n = 10) in M2 macrophages of K118-treated (red) and vehicle-treated (blue) eWAT. Student’s t test,*P < 0.05, **P < 0.001, ***P < 0.001, ****P<0.0001. Data are represented as mean ± SEM. Sample sizes are biological replicates. eWAT, epidydimal white adipose tissue. Box-and-whisker plots are defined as follows: the bounds of the boxes indicate SD; the lines within the boxes indicate means, and the whiskers represent minimum and maximum values.
Figure 5
Figure 5. K118 treatment abrogates formation of inflammatory T and NK cells in the WAT of HFD mice.
(A and B) DIO mice were treated with K118 or water (vehicle) for 2 weeks, and the eWAT was analyzed for the indicated immune cell populations. (A) Frequency and (B) number of CD3+CD4+ and CD3+CD8+ T cells in eWAT (n = 9–11). Plots were pregated on live CD45+ cells. (C and D) Representative flow cytometry plots showing IFN-γ–expressing CD4 and CD8 T cells after in vitro stimulation of stromal vascular fraction (SVF) cells with PMA and ionomycin for 4 hours, with box-and-whisker plots indicating frequencies of CD4 and CD8 IFN-γ–producing T cells pregated on live CD45+CD3+CD4+ and CD4+CD3+CD8+ cells, respectively, and their numbers in the eWAT (n = 10–11). (E) Percentage of CD25FoxP3+ cells (iTreg) and CD25+FoxP3+ cells (nTreg) pregated on live CD45+CD3+CD4+ cells (n = 8–10). (F and G) Flow plots showing live CD45+CD3NK1.1+ cells (NK cells) and CD45+CD3+NK1.1+ NKT cells, with box-and-whisker plots indicating frequencies and numbers of (F) NK cells and (G) NKT cells (n = 9–11). (H and I) Flow cytometry of IFN-γ–expressing (H) NK cells and (I) NKT cells in the eWAT of K118- and vehicle-treated HFD mice after in vitro stimulation with PMA and ionomycin for 4 hours. Cells were pregated on live CD45+CD3NK1.1+ cells (n = 10–11). Student’s t test, *P < 0.05, **P < 0.01, ***P < 0.001, ****P < 0.0001. Data are represented as mean ± SEM. Sample sizes are biological replicates. Box-and-whisker plots are defined as follows: the bounds of the boxes indicate SD; the lines within the boxes indicate means, and the whiskers represent minimum and maximum values.

Similar articles

Cited by

References

    1. Mathis D. Immunological goings-on in visceral adipose tissue. Cell Metab. 2013;17(6):851–859. doi: 10.1016/j.cmet.2013.05.008. - DOI - PMC - PubMed
    1. Chawla A, Nguyen KD, Goh YP. Macrophage-mediated inflammation in metabolic disease. Nat Rev Immunol. 2011;11(11):738–749. doi: 10.1038/nri3071. - DOI - PMC - PubMed
    1. Feuerer M, et al. Lean, but not obese, fat is enriched for a unique population of regulatory T cells that affect metabolic parameters. Nat Med. 2009;15(8):930–939. doi: 10.1038/nm.2002. - DOI - PMC - PubMed
    1. Weisberg SP, McCann D, Desai M, Rosenbaum M, Leibel RL, Ferrante AW. Obesity is associated with macrophage accumulation in adipose tissue. J Clin Invest. 2003;112(12):1796–1808. doi: 10.1172/JCI19246. - DOI - PMC - PubMed
    1. Lumeng CN, Bodzin JL, Saltiel AR. Obesity induces a phenotypic switch in adipose tissue macrophage polarization. J Clin Invest. 2007;117(1):175–184. doi: 10.1172/JCI29881. - DOI - PMC - PubMed