

Antiretroviral Treatment Scale-Up and Tuberculosis Mortality in High TB/HIV Burden Countries: An Econometric Analysis
- PMID: 27536864
- PMCID: PMC4990253
- DOI: 10.1371/journal.pone.0160481
Antiretroviral Treatment Scale-Up and Tuberculosis Mortality in High TB/HIV Burden Countries: An Econometric Analysis
Abstract
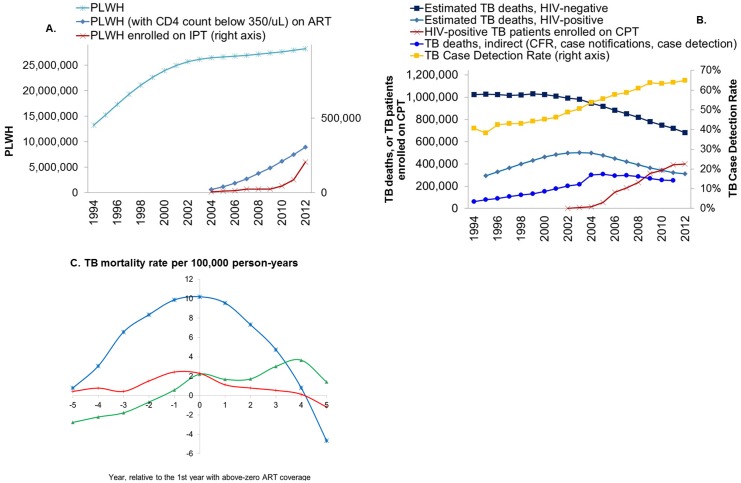
Introduction: Antiretroviral therapy (ART) reduces mortality in patients with active tuberculosis (TB), but the population-level relationship between ART coverage and TB mortality is untested. We estimated the reduction in population-level TB mortality that can be attributed to increasing ART coverage across 41 high HIV-TB burden countries.
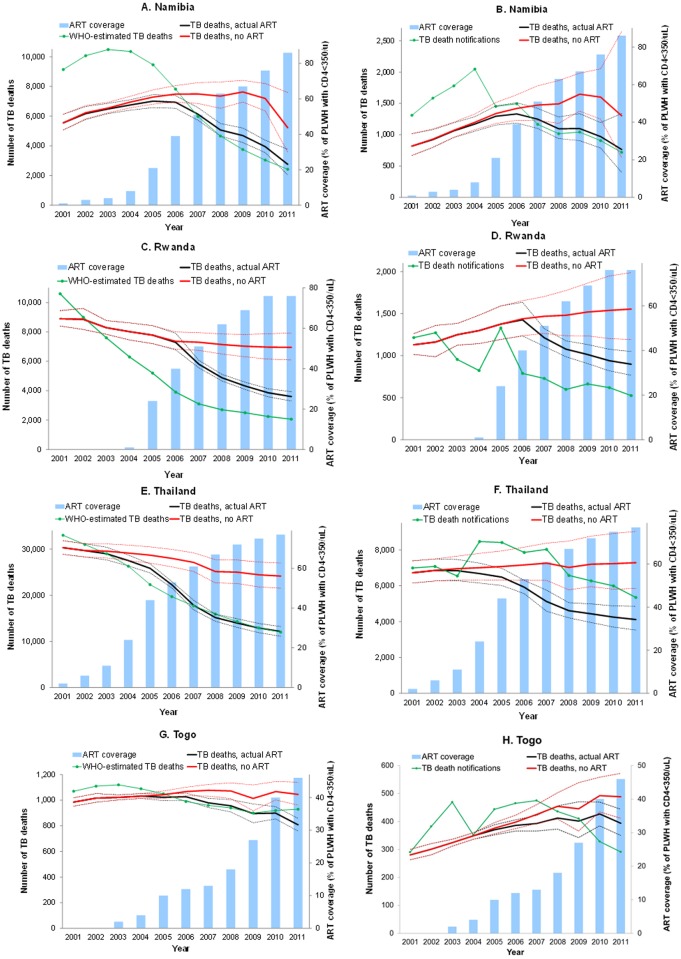
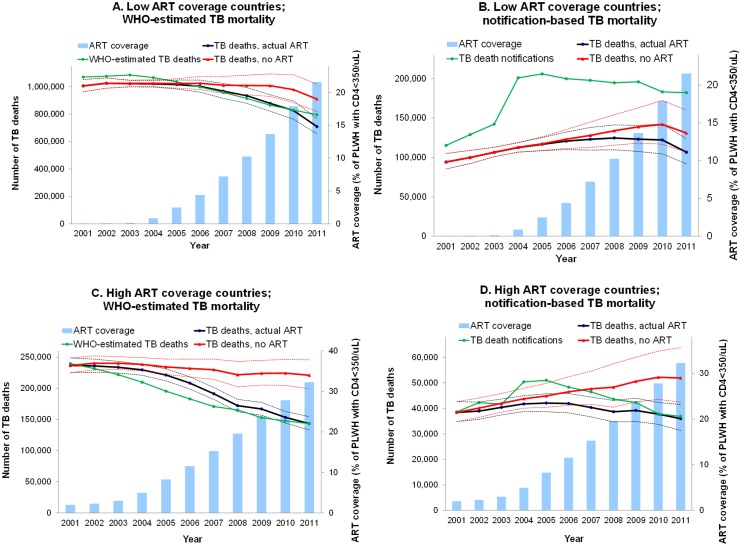
Methods: We compiled TB mortality trends between 1996 and 2011 from two sources: (1) national program-reported TB death notifications, adjusted for annual TB case detection rates, and (2) WHO TB mortality estimates. National coverage with ART, as proportion of HIV-infected people in need, was obtained from UNAIDS. We applied panel linear regressions controlling for HIV prevalence (5-year lagged), coverage of TB interventions (estimated by WHO and UNAIDS), gross domestic product per capita, health spending from domestic sources, urbanization, and country fixed effects.
Results: Models suggest that that increasing ART coverage was followed by reduced TB mortality, across multiple specifications. For death notifications at 2 to 5 years following a given ART scale-up, a 1% increase in ART coverage predicted 0.95% faster mortality rate decline (p = 0.002); resulting in 27% fewer TB deaths in 2011 alone than would have occurred without ART. Based on WHO death estimates, a 1% increase in ART predicted a 1.0% reduced TB death rate (p<0.001), and 31% fewer deaths in 2011. TB mortality was higher at higher HIV prevalence (p<0.001), but not related to coverage of isoniazid preventive therapy, cotrimoxazole preventive therapy, or other covariates.
Conclusion: This econometric analysis supports a substantial impact of ART on population-level TB mortality realized already within the first decade of ART scale-up, that is apparent despite variable-quality mortality data.
Conflict of interest statement
Figures
Similar articles
-
Antiretroviral therapy and TB notification rates in a high HIV prevalence South African community.J Acquir Immune Defic Syndr. 2011 Mar 1;56(3):263-9. doi: 10.1097/QAI.0b013e31820413b3. J Acquir Immune Defic Syndr. 2011. PMID: 21317585 Free PMC article.
-
The impact of HIV, an antiretroviral programme and tuberculosis on mortality in South African platinum miners, 1992-2010.PLoS One. 2012;7(6):e38598. doi: 10.1371/journal.pone.0038598. Epub 2012 Jun 22. PLoS One. 2012. PMID: 22761688 Free PMC article.
-
The scale-up of antiretroviral therapy coverage was strongly associated with the declining tuberculosis morbidity in Africa during 2000-2018.Public Health. 2021 Feb;191:48-54. doi: 10.1016/j.puhe.2020.04.021. Epub 2021 Jan 25. Public Health. 2021. PMID: 33508661
-
Review of policy and status of implementation of collaborative HIV-TB activities in 23 high-burden countries.Int J Tuberc Lung Dis. 2014 Oct;18(10):1149-58. doi: 10.5588/ijtld.13.0889. Int J Tuberc Lung Dis. 2014. PMID: 25216827 Review.
-
Can we get more HIV-positive tuberculosis patients on antiretroviral treatment in a rural district of Malawi?Int J Tuberc Lung Dis. 2005 Mar;9(3):238-47. Int J Tuberc Lung Dis. 2005. PMID: 15786885 Review.
Cited by
-
Economic and modeling evidence for tuberculosis preventive therapy among people living with HIV: A systematic review and meta-analysis.PLoS Med. 2021 Sep 14;18(9):e1003712. doi: 10.1371/journal.pmed.1003712. eCollection 2021 Sep. PLoS Med. 2021. PMID: 34520463 Free PMC article.
-
Spatio-temporal trends in anaemia among pregnant women, adolescents and preschool children in sub-Saharan Africa.Public Health Nutr. 2021 Aug;24(12):3648-3661. doi: 10.1017/S1368980020004620. Epub 2020 Nov 16. Public Health Nutr. 2021. PMID: 33190664 Free PMC article.
-
Mortality Among People With HIV Treated for Tuberculosis Based on Positive, Negative, or No Bacteriologic Test Results for Tuberculosis: The IeDEA Consortium.Open Forum Infect Dis. 2020 Jan 10;7(1):ofaa006. doi: 10.1093/ofid/ofaa006. eCollection 2020 Jan. Open Forum Infect Dis. 2020. PMID: 32010735 Free PMC article.
-
Pharmacokinetic study of two different rifabutin doses co-administered with lopinavir/ritonavir in African HIV and tuberculosis co-infected adult patients.BMC Infect Dis. 2020 Jun 26;20(1):449. doi: 10.1186/s12879-020-05169-2. BMC Infect Dis. 2020. PMID: 32590942 Free PMC article.
-
Reduction of HIV-associated excess mortality by antiretroviral treatment among tuberculosis patients in Kenya.PLoS One. 2017 Nov 16;12(11):e0188235. doi: 10.1371/journal.pone.0188235. eCollection 2017. PLoS One. 2017. PMID: 29145454 Free PMC article.
References
-
- Lozano R, Naghavi M, Foreman K, Lim S, Shibuya K, Aboyans V, et al. Global and regional mortality from 235 causes of death for 20 age groups in 1990 and 2010: a systematic analysis for the Global Burden of Disease Study 2010. Lancet. 2012;380(9859):2095–128. Epub 2012/12/19. 10.1016/S0140-6736(12)61728-0 . - DOI - PMC - PubMed
-
- Floyd S, Marston M, Baisley K, Wringe A, Herbst K, Chihana M, et al. The effect of antiretroviral therapy provision on all-cause, AIDS and non-AIDS mortality at the population level—a comparative analysis of data from four settings in Southern and East Africa. Trop Med Int Health. 2012;17(8):e84–93. Epub 2012/09/05. 10.1111/j.1365-3156.2012.03032.x - DOI - PMC - PubMed
-
- Floyd S, Molesworth A, Dube A, Banda E, Jahn A, Mwafulirwa C, et al. Population-level reduction in adult mortality after extension of free anti-retroviral therapy provision into rural areas in northern Malawi. PLOS One. 2010;5(10):e13499 Epub 2010/10/27. 10.1371/journal.pone.0013499 - DOI - PMC - PubMed
MeSH terms
Grants and funding
LinkOut - more resources
Full Text Sources
Other Literature Sources
Medical
