. 2016 Aug 18;12(8):e1006130.
doi: 10.1371/journal.pgen.1006130. eCollection 2016 Aug.

A Genomic Map of the Effects of Linked Selection in Drosophila

Affiliations

A Genomic Map of the Effects of Linked Selection in Drosophila

Eyal Elyashiv et al. PLoS Genet. .

Abstract

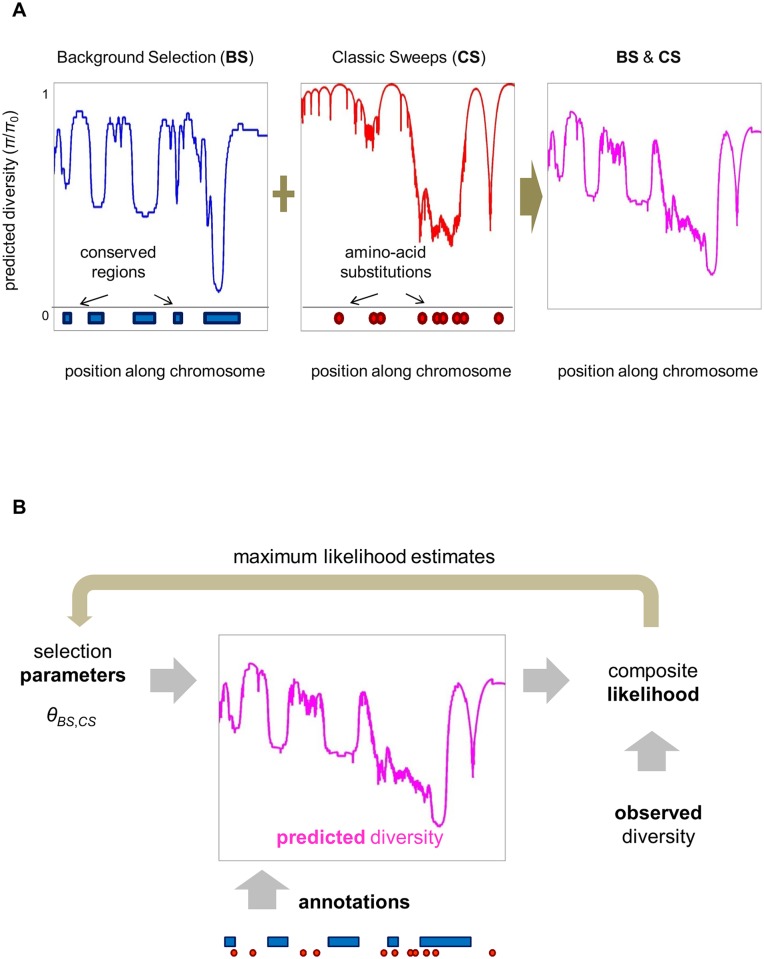
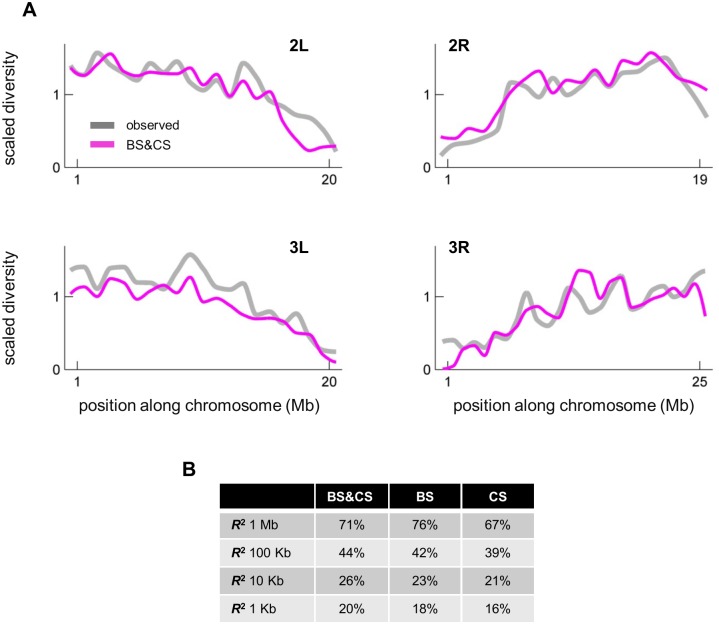
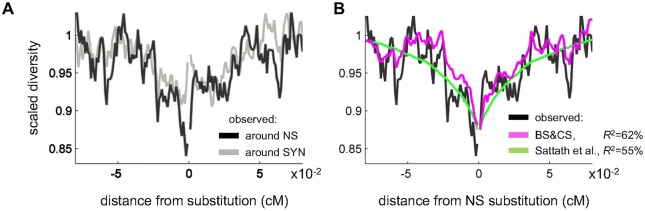
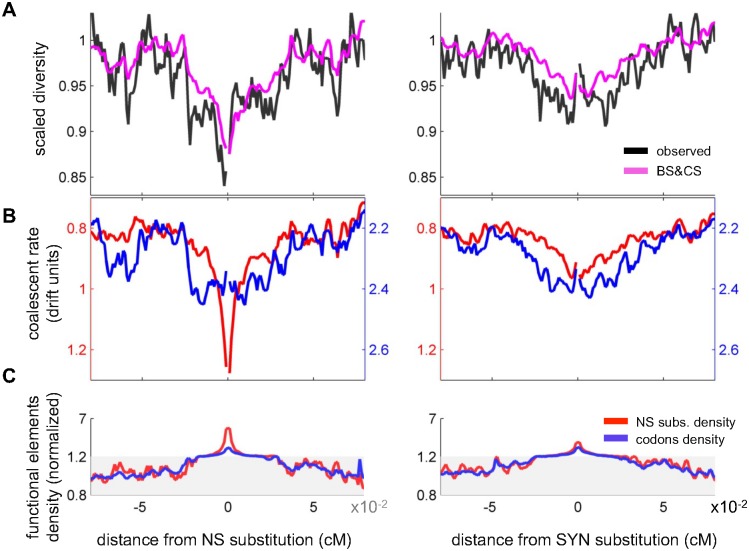
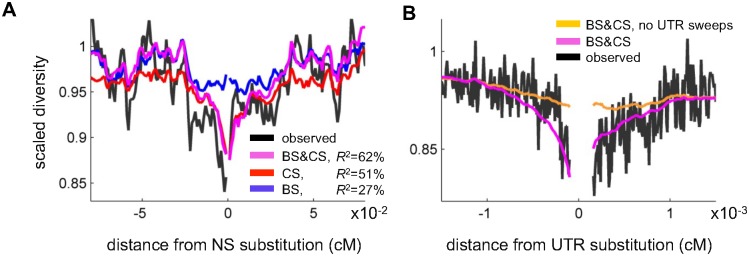
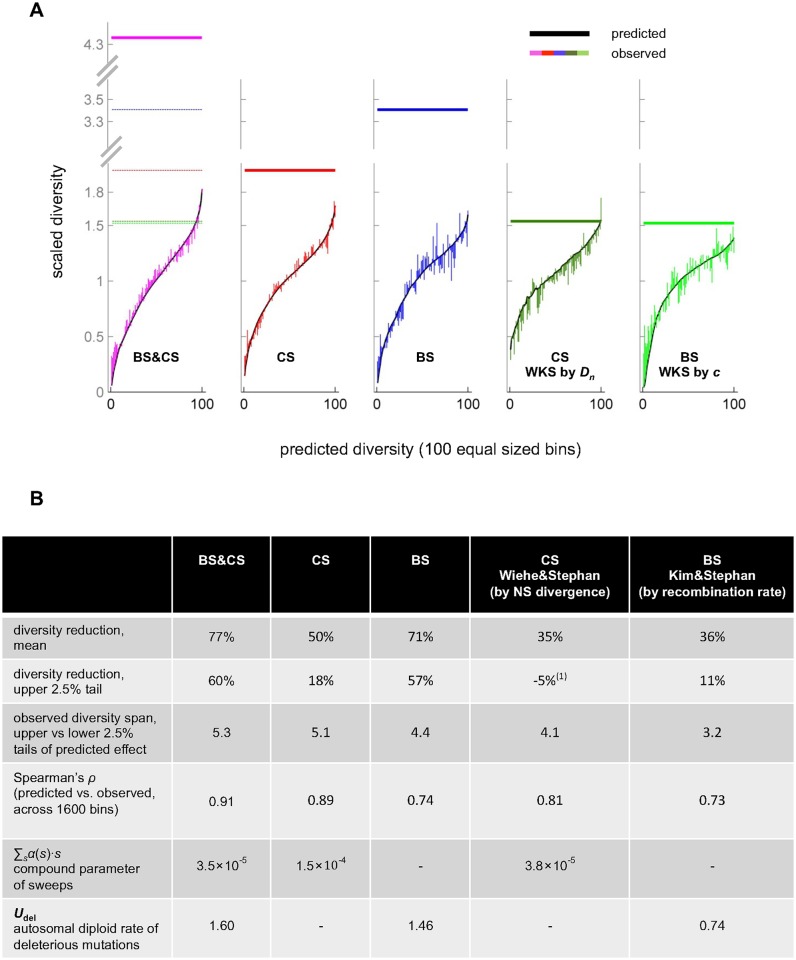
Natural selection at one site shapes patterns of genetic variation at linked sites. Quantifying the effects of "linked selection" on levels of genetic diversity is key to making reliable inference about demography, building a null model in scans for targets of adaptation, and learning about the dynamics of natural selection. Here, we introduce the first method that jointly infers parameters of distinct modes of linked selection, notably background selection and selective sweeps, from genome-wide diversity data, functional annotations and genetic maps. The central idea is to calculate the probability that a neutral site is polymorphic given local annotations, substitution patterns, and recombination rates. Information is then combined across sites and samples using composite likelihood in order to estimate genome-wide parameters of distinct modes of selection. In addition to parameter estimation, this approach yields a map of the expected neutral diversity levels along the genome. To illustrate the utility of our approach, we apply it to genome-wide resequencing data from 125 lines in Drosophila melanogaster and reliably predict diversity levels at the 1Mb scale. Our results corroborate estimates of a high fraction of beneficial substitutions in proteins and untranslated regions (UTR). They allow us to distinguish between the contribution of sweeps and other modes of selection around amino acid substitutions and to uncover evidence for pervasive sweeps in untranslated regions (UTRs). Our inference further suggests a substantial effect of other modes of linked selection and of adaptation in particular. More generally, we demonstrate that linked selection has had a larger effect in reducing diversity levels and increasing their variance in D. melanogaster than previously appreciated.


Conflict of interest statement

The authors have declared that no competing interests exist.

Figures

Fig 1
Fig 1. Constructing a map of the effects of linked selection and inferring the underlying selection parameters.
(A) The expected neutral heterozygosity is estimated for each position in the genome, given the positions and selection parameters of different annotations. (B) To estimate selection parameters, their composite likelihood is maximized given the set of annotations and neutral polymorphism data throughout the genome.
Fig 2
Fig 2. A comparison of observed and predicted scaled diversity levels along the major autosomes of Drosophila melangaster.
Throughout, we refer to “scaled diversity” as synonymous heterozygosity divided by synonymous divergence, to control for variation in the mutation rate (as detailed in S1C Text); scaled diversity is shown relative to the genome average. (A) Observed and predicted scaled diversity over non-overlapping 1 Mb windows across chromosomal arms. (B) Summaries of the goodness of fit for models including background selection (BS), classic sweeps (CS) and both (BS & CS). R2 is calculated for autosomes using non-overlapping windows of different sizes. Selection parameters are inferred using synonymous sites with recombination rate >0.75cM/Mb, while the predictions and corresponding summaries are calculated for sites with recombination rate >0.1cM/Mb.
Fig 3
Fig 3. Observed and predicted scaled diversity levels around amino acid substitutions.
(A) Comparison of scaled diversity levels around non-synonymous (NS) and synonymous (SYN) substitutions. (B) Comparison of predicted, scaled diversity levels based on our method and that of Sattath et al. (2011) [48].
Fig 4
Fig 4. The contribution of background selection and classic sweeps to scaled diversity levels around non-synonymous and synonymous substitutions.
(A) Observed and predicted scaled diversity levels around non-synonymous (left) and synonymous (right) substitutions. The predictions are based on the joint model for background selection and classic sweeps. (B) The contribution of background selection (blue) and classic sweeps (red) measured in terms of the coalescent rates that they induce. The rates are measured in units of 1/2Ne, where Ne is our estimate of the effective population size in the absence of linked selection. To make these graphs comparable to the scaled diversity levels in (A), with lower rates corresponding to higher scaled diversity levels, the direction of the y-axis is reversed. (C) The density of exonic sites (blue) and non-synonymous substitutions (red) as a function of distance from non-synonymous and synonymous substitutions. Densities are normalized by the average densities at distance >0.06cM; the shaded areas correspond to the use of a different linear scale.
Fig 5
Fig 5. Comparing alternative models around substitutions in proteins and UTRs.
(A) Comparison of predicted scaled diversity levels around non-synonymous substitutions based on models including background selection (BS), classic sweeps (CS) and both (BS & CS). (B) Comparison of predicted scaled diversity levels around substitutions in UTRs based on models with and without sweeps in UTRs.
Fig 6
Fig 6. The impact of linked selection on scaled diversity levels.
(A) Observed scaled diversity levels stratified by model predictions. Shown here are the results based on our method with both background selection and classic sweeps (pink), background selection alone (blue) and classic sweeps alone (red), as well as for the Wiehe and Stephan (1993) [6] method for classic sweeps based on the density of non-synonymous substitutions (dark green) and the Kim and Stephan (2000) [10] method for background selection based on recombination rates (light green). The stratification is described in the text. Predicted levels are shown in black, the observed deviations from the predictions are shown as vertical lines, with the colors corresponding to different models, and the estimated scaled diversity levels in the absence of linked selection are shown as horizontal bars. (B) Summaries of the mean reduction and heterogeneity in scaled diversity levels based on the different methods and models. Also shown are estimates of compound selection parameters and the Spearman correlation between predicted and observed levels. (1) The negative value reflects the fact that the observed scaled diversity level is higher than the level predicted in the absence of linked selection.

Comment in

  • On the Trail of Linked Selection.
    Josephs EB, Wright SI. Josephs EB, et al. PLoS Genet. 2016 Aug 18;12(8):e1006240. doi: 10.1371/journal.pgen.1006240. eCollection 2016 Aug. PLoS Genet. 2016. PMID: 27537331 Free PMC article. No abstract available.

References

    1. Hill WG, Robertson A (1966) The effect of linkage on limits to artificial selection. Genet Res 8: 269–294. - PubMed
    1. Maynard Smith JM, Haigh J (1974) The hitch-hiking effect of a favourable gene. Genet Res 23: 23–35. - PubMed
    1. Kaplan NL, Hudson RR, Langley CH (1989) The "hitchhiking effect" revisited. Genetics 123: 887–899. - PMC - PubMed
    1. Begun DJ, Aquadro CF (1992) Levels of naturally occurring DNA polymorphism correlate with recombination rates in D. melanogaster. Nature 356: 519–520. - PubMed
    1. Charlesworth B, Morgan MT, Charlesworth D (1993) The effect of deleterious mutations on neutral molecular variation. Genetics 134: 1289–1303. - PMC - PubMed

Publication types

Substances