

Ventricular Fibrillation Waveform Changes during Controlled Coronary Perfusion Using Extracorporeal Circulation in a Swine Model
- PMID: 27536996
- PMCID: PMC4990236
- DOI: 10.1371/journal.pone.0161166
Ventricular Fibrillation Waveform Changes during Controlled Coronary Perfusion Using Extracorporeal Circulation in a Swine Model
Abstract
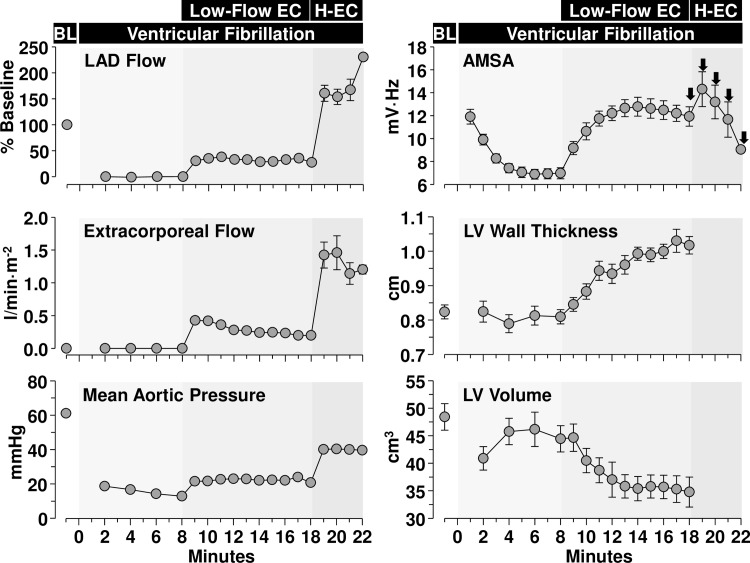
Background: Several characteristics of the ventricular fibrillation (VF) waveform have been found predictive of successful defibrillation and hypothesized to reflect the myocardial energy state. In an open-chest swine model of VF, we modeled "average CPR" using extracorporeal circulation (ECC) and assessed the time course of coronary blood flow, myocardial metabolism, and myocardial structure in relation to the amplitude spectral area (AMSA) of the VF waveform without artifacts related to chest compression.
Methods: VF was induced and left untreated for 8 minutes in 16 swine. ECC was then started adjusting its flow to maintain a coronary perfusion pressure of 10 mmHg for 10 minutes. AMSA was calculated in the frequency domain and analyzed continuously with a 2.1 s timeframe and a Tukey window that moved ahead every 0.5 s.
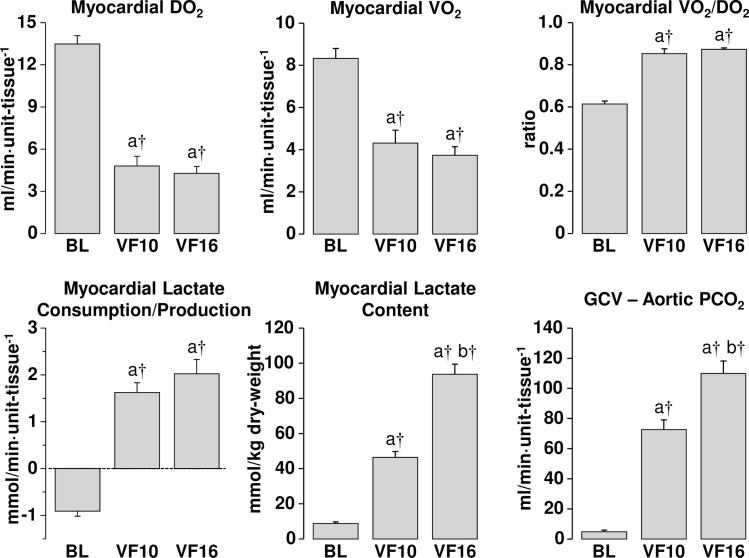
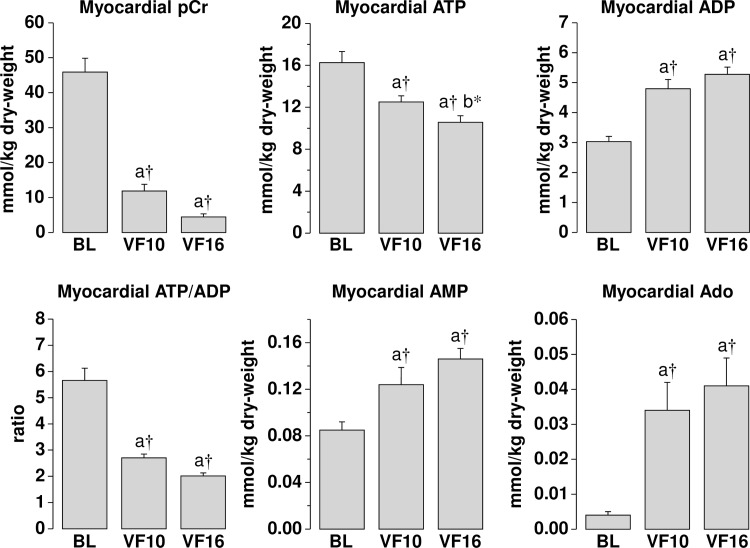
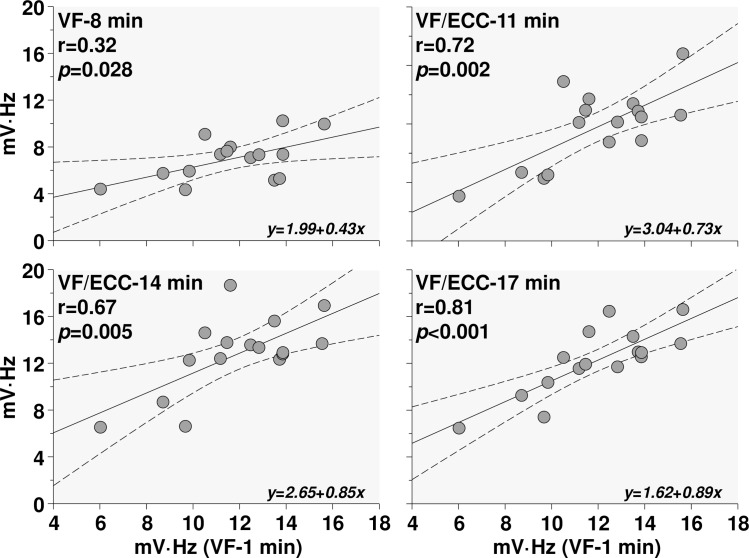
Results: AMSA progressively declined during untreated VF. With ECC, AMSA increased from 7.0 ± 1.9 mV·Hz (at minute 8) to 12.8 ± 3.3 mV·Hz (at minute 14) (p < 0.05) without subsequent increase and showing a modest correlation with coronary blood flow of borderline statistical significance (r = 0.489, p = 0.0547). Myocardial energy measurements showed marked reduction in phosphocreatine and moderate reduction in ATP with increases in ADP, AMP, and adenosine along with myocardial lactate, all indicative of ischemia. Yet, ischemia did not resolve during ECC despite a coronary blood flow of ~ 30% of baseline.
Conclusion: AMSA increased upon return of coronary blood flow during ECC. However, the maximal level was reached after ~ 6 minutes without further change. The significance of the findings for determining the optimal timing for delivering an electrical shock during resuscitation from VF remains to be further explored.
Conflict of interest statement
Figures
Similar articles
-
Real-Time Ventricular Fibrillation Amplitude-Spectral Area Analysis to Guide Timing of Shock Delivery Improves Defibrillation Efficacy During Cardiopulmonary Resuscitation in Swine.J Am Heart Assoc. 2017 Nov 4;6(11):e006749. doi: 10.1161/JAHA.117.006749. J Am Heart Assoc. 2017. PMID: 29102980 Free PMC article.
-
Utility of the ventricular fibrillation waveform to predict a return of spontaneous circulation and distinguish acute from post myocardial infarction or normal Swine in ventricular fibrillation cardiac arrest.Circ Arrhythm Electrophysiol. 2011 Jun;4(3):337-43. doi: 10.1161/CIRCEP.110.960419. Epub 2011 Apr 14. Circ Arrhythm Electrophysiol. 2011. PMID: 21493961
-
High-dose erythropoietin during cardiac resuscitation lessens postresuscitation myocardial stunning in swine.Transl Res. 2013 Aug;162(2):110-21. doi: 10.1016/j.trsl.2013.06.002. Epub 2013 Jun 24. Transl Res. 2013. PMID: 23806450
-
The ventricular fibrillation waveform approach to direct postshock chest compressions in a swine model of VF arrest.J Emerg Med. 2015 Mar;48(3):373-81. doi: 10.1016/j.jemermed.2014.09.057. Epub 2014 Dec 6. J Emerg Med. 2015. PMID: 25488413
-
Correlation of end tidal carbon dioxide, amplitude spectrum area, and coronary perfusion pressure in a porcine model of cardiac arrest.Physiol Rep. 2017 Sep;5(17):e13401. doi: 10.14814/phy2.13401. Physiol Rep. 2017. PMID: 28899911 Free PMC article.
Cited by
-
Prediction of Return of Spontaneous Circulation in a Pediatric Swine Model of Cardiac Arrest Using Low-Resolution Multimodal Physiological Waveforms.IEEE J Biomed Health Inform. 2023 Oct;27(10):4719-4727. doi: 10.1109/JBHI.2023.3297927. Epub 2023 Oct 5. IEEE J Biomed Health Inform. 2023. PMID: 37478027 Free PMC article.
-
Computerized Analysis of the Ventricular Fibrillation Waveform Allows Identification of Myocardial Infarction: A Proof-of-Concept Study for Smart Defibrillator Applications in Cardiac Arrest.J Am Heart Assoc. 2020 Oct 20;9(19):e016727. doi: 10.1161/JAHA.120.016727. Epub 2020 Oct 2. J Am Heart Assoc. 2020. PMID: 33003984 Free PMC article.
-
Electrocardiographic recording direction impacts ventricular fibrillation waveform measurements: A potential pitfall for VF-waveform guided defibrillation protocols.Resusc Plus. 2021 Apr 2;6:100114. doi: 10.1016/j.resplu.2021.100114. eCollection 2021 Jun. Resusc Plus. 2021. PMID: 34223374 Free PMC article.
-
Real-Time Ventricular Fibrillation Amplitude-Spectral Area Analysis to Guide Timing of Shock Delivery Improves Defibrillation Efficacy During Cardiopulmonary Resuscitation in Swine.J Am Heart Assoc. 2017 Nov 4;6(11):e006749. doi: 10.1161/JAHA.117.006749. J Am Heart Assoc. 2017. PMID: 29102980 Free PMC article.
-
Initial Blood pH, Lactate and Base Deficit Add No Value to Peri-Arrest Factors in Prognostication of Neurological Outcome After Out-of-Hospital Cardiac Arrest.Front Med (Lausanne). 2021 Sep 16;8:697906. doi: 10.3389/fmed.2021.697906. eCollection 2021. Front Med (Lausanne). 2021. PMID: 34604252 Free PMC article.
References
-
- Niemann JT, Cairns CB, Sharma J, Lewis RJ (1992) Treatment of prolonged ventricular fibrillation. Immediate countershock versus high-dose epinephrine and CPR preceding countershock. Circulation 85: 281–287. - PubMed
-
- Cobb LA, Fahrenbruch CE, Walsh TR, Copass MK, Olsufka M, Breskin M, et al. (1999) Influence of cardiopulmonary resuscitation prior to defibrillation in patients with out-of-hospital ventricular fibrillation. JAMA 281: 1182–1188. - PubMed
-
- Kolarova J, Ayoub IM, Yi Z, Gazmuri RJ (2003) Optimal timing for electrical defibrillation after prolonged untreated ventricular fibrillation. Crit Care Med 31: 2022–2028. - PubMed
-
- Marn-Pernat A, Weil MH, Tang W, Pernat A, Bisera J (2001) Optimizing timing of ventricular defibrillation. Crit Care Med 29: 2360–2365. - PubMed
MeSH terms
Grants and funding
LinkOut - more resources
Full Text Sources
Other Literature Sources
