

Transcriptional Regulation of Aerobic Metabolism in Pichia pastoris Fermentation
- PMID: 27537181
- PMCID: PMC4990298
- DOI: 10.1371/journal.pone.0161502
Transcriptional Regulation of Aerobic Metabolism in Pichia pastoris Fermentation
Abstract
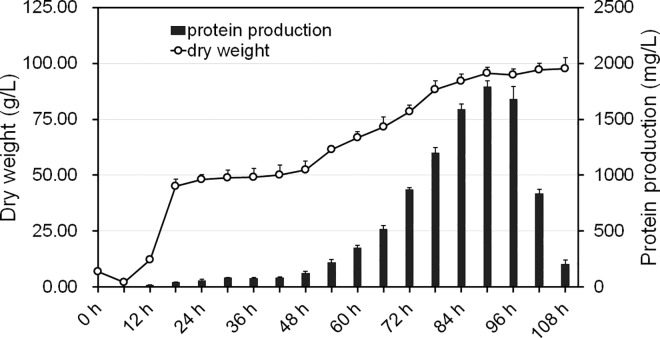
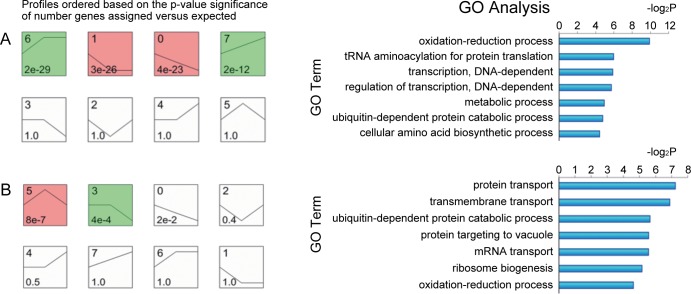
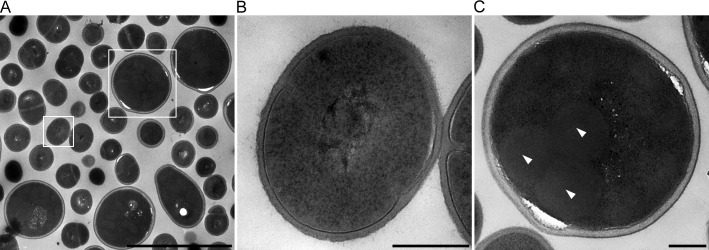
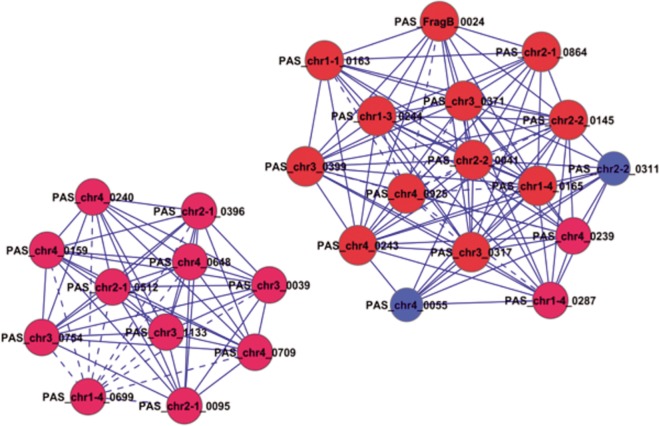
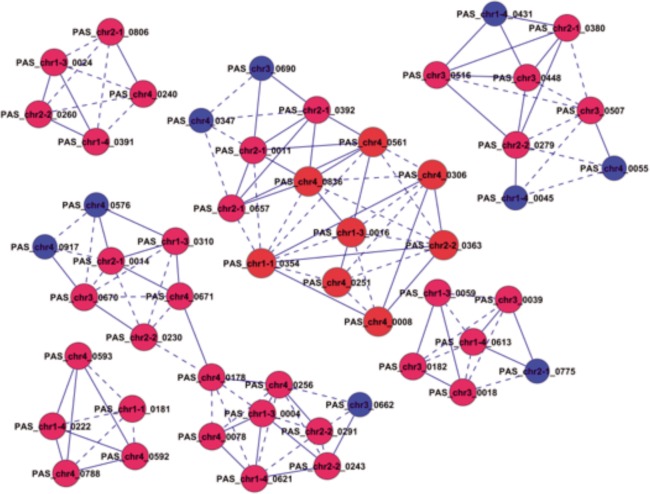
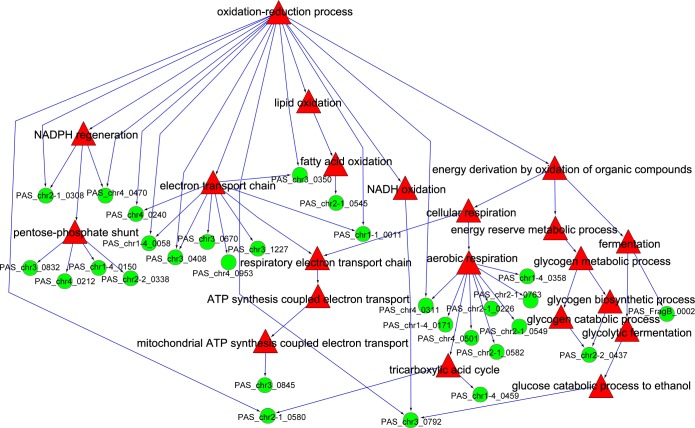
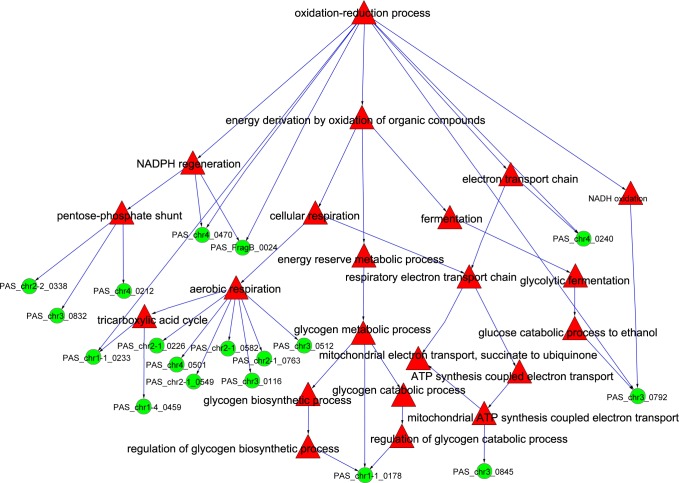
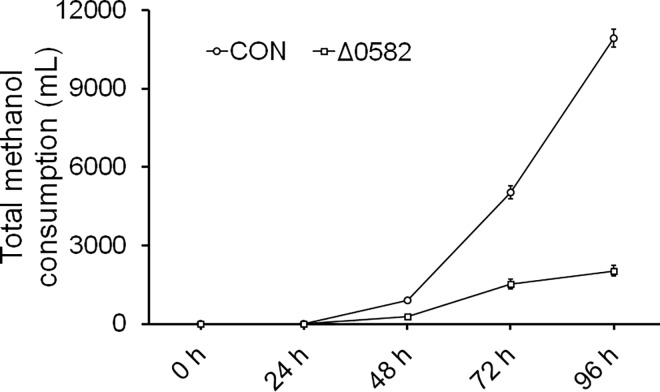
In this study, we investigated the classical fermentation process in Pichia pastoris based on transcriptomics. We utilized methanol in pichia yeast cell as the focus of our study, based on two key steps: limiting carbon source replacement (from glycerol to methonal) and fermentative production of exogenous proteins. In the former, the core differential genes in co-expression net point to initiation of aerobic metabolism and generation of peroxisome. The transmission electron microscope (TEM) results showed that yeast gradually adapted methanol induction to increased cell volume, and decreased density, via large number of peroxisomes. In the fermentative production of exogenous proteins, the Gene Ontology (GO) mapping results show that PAS_chr2-1_0582 played a vital role in regulating aerobic metabolic drift. In order to confirm the above results, we disrupted PAS_chr2-1_0582 by homologous recombination. Alcohol consumption was equivalent to one fifth of the normal control, and fewer peroxisomes were observed in Δ0582 strain following methanol induction. In this study we determined the important core genes and GO terms regulating aerobic metabolic drift in Pichia, as well as developing new perspectives for the continued development within this field.
Conflict of interest statement
Figures
Similar articles
-
Regulation of alcohol oxidase 1 (AOX1) promoter and peroxisome biogenesis in different fermentation processes in Pichia pastoris.J Biotechnol. 2013 Jul 20;166(4):174-81. doi: 10.1016/j.jbiotec.2013.05.009. Epub 2013 Jun 2. J Biotechnol. 2013. PMID: 23735484
-
Novel homologous lactate transporter improves L-lactic acid production from glycerol in recombinant strains of Pichia pastoris.Microb Cell Fact. 2016 Sep 15;15(1):158. doi: 10.1186/s12934-016-0557-9. Microb Cell Fact. 2016. PMID: 27634467 Free PMC article.
-
Transcriptome analysis of Δmig1Δmig2 mutant reveals their roles in methanol catabolism, peroxisome biogenesis and autophagy in methylotrophic yeast Pichia pastoris.Genes Genomics. 2018 Apr;40(4):399-412. doi: 10.1007/s13258-017-0641-5. Epub 2017 Dec 14. Genes Genomics. 2018. PMID: 29892842
-
Adaptation of Hansenula polymorpha to methanol: a transcriptome analysis.BMC Genomics. 2010 Jan 4;11:1. doi: 10.1186/1471-2164-11-1. BMC Genomics. 2010. PMID: 20044946 Free PMC article.
-
The significance of peroxisomes in methanol metabolism in methylotrophic yeast.Biochim Biophys Acta. 2006 Dec;1763(12):1453-62. doi: 10.1016/j.bbamcr.2006.07.016. Epub 2006 Sep 1. Biochim Biophys Acta. 2006. PMID: 17023065 Review.
Cited by
-
Biomarkers allow detection of nutrient limitations and respective supplementation for elimination in Pichia pastoris fed-batch cultures.Microb Cell Fact. 2017 Jul 11;16(1):117. doi: 10.1186/s12934-017-0730-9. Microb Cell Fact. 2017. PMID: 28693509 Free PMC article.
-
Developing a metabolic model-based fed-batch feeding strategy for Pichia pastoris fermentation through fine-tuning of the methanol utilization pathway.Microb Biotechnol. 2023 Jun;16(6):1344-1359. doi: 10.1111/1751-7915.14264. Epub 2023 Apr 24. Microb Biotechnol. 2023. PMID: 37093126 Free PMC article.
References
-
- Carbone A, Madden R. Insights on the evolution of metabolic networks of unicellular translationally biased organisms from transcriptomic data and sequence analysis. J Mol Evol. 2005;61: 456–469. - PubMed
MeSH terms
Substances
LinkOut - more resources
Full Text Sources
Other Literature Sources
