. 2016 Aug 18;12(8):e1006147.
doi: 10.1371/journal.pgen.1006147. eCollection 2016 Aug.

Control of Anther Cell Differentiation by the Small Protein Ligand TPD1 and Its Receptor EMS1 in Arabidopsis

Affiliations

Control of Anther Cell Differentiation by the Small Protein Ligand TPD1 and Its Receptor EMS1 in Arabidopsis

Jian Huang et al. PLoS Genet. .

Abstract

A fundamental feature of sexual reproduction in plants and animals is the specification of reproductive cells that conduct meiosis to form gametes, and the associated somatic cells that provide nutrition and developmental cues to ensure successful gamete production. The anther, which is the male reproductive organ in seed plants, produces reproductive microsporocytes (pollen mother cells) and surrounding somatic cells. The microsporocytes yield pollen via meiosis, and the somatic cells, particularly the tapetum, are required for the normal development of pollen. It is not known how the reproductive cells affect the differentiation of these somatic cells, and vice versa. Here, we use molecular genetics, cell biological, and biochemical approaches to demonstrate that TPD1 (TAPETUM DETERMINANT1) is a small secreted cysteine-rich protein ligand that interacts with the LRR (Leucine-Rich Repeat) domain of the EMS1 (EXCESS MICROSPOROCYTES1) receptor kinase at two sites. Analyses of the expressions and localizations of TPD1 and EMS1, ectopic expression of TPD1, experimental missorting of TPD1, and ablation of microsporocytes yielded results suggesting that the precursors of microsporocyte/microsporocyte-derived TPD1 and pre-tapetal-cell-localized EMS1 initially promote the periclinal division of secondary parietal cells and then determine one of the two daughter cells as a functional tapetal cell. Our results also indicate that tapetal cells suppress microsporocyte proliferation. Collectively, our findings show that tapetal cell differentiation requires reproductive-cell-secreted TPD1, illuminating a novel mechanism whereby signals from reproductive cells determine somatic cell fate in plant sexual reproduction.


Conflict of interest statement

The authors have declared that no competing interests exist.

Figures
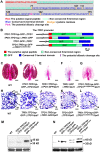
Fig 1
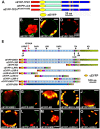
Fig 1. TPD1 is processed into a 13-kD small protein in planta.
(A) The TPD1 protein sequence. Red color: the putative signal peptide, Cyan: the non-conserved N-terminal region, Blue: the conserved C-terminal domain, Orange: cysteine residues (numbers indicate their positions), Pink “KR”: the potential dibasic cleavage site, and Underlined: the sequence of identified mature TPD1. (B) To examine the processing of TPD1, constructs encoding GFP-TPD1 fusion proteins were generated and introduced into the tpd1 mutant. Schematic diagrams showing the constructs used for the complementation experiments. The 2.7-kb TPD1 promoter was used in all constructs. Red bar: the putative signal peptide (Sp) of TPD1, Green bar: GFP, Cyan bar: the non-conserved N-terminal region, Blue bar: the conserved C-terminal domain, ΔTPD1: TPD1 without the putative signal peptide, and Pink line: K135GR135G mutations. All constructs were transformed into tpd1 heterozygous plants. PCR genotyping was carried out to determine the tpd1 mutant background of T2 transgenic plants. Transgenic plants showing siliques comparable in size to those of wild-type plants were counted as complemented plants. (C-G) Alexander pollen staining of mature anthers reveals viable pollen grains in wild-type (C) and TPD1:TPD1sp-GFP-ΔTPD1/tpd1 (D) plants, whereas no pollen is observed in TPD1:TPD1sp-ΔTPD -GFP/tpd1 (E), TPD1:GFP-ΔTPD1/tpd1 (F), and TPD1:TPD1sp-GFP-ΔTPD1 K135G R136G/tpd1 (G) anthers. Scale bars, 50 μm. (H-L) Semi-thin sections of stage-6 anthers show normal tapetal cells and microsporocytes in wild-type (H) and TPD1:TPD1sp-GFP-ΔTPD1/tpd1 (I) plants, whereas a complete lack of tapetal cells and the presence of excess microsporocytes are seen in TPD1:TPD1sp-ΔTPD -GFP/tpd1 (J), TPD1:GFP-ΔTPD1/tpd1 (K), and TPD1:TPD1sp-GFP-ΔTPD1 K135G R136G/tpd1 (L) anthers. E, epidermis; En, endothecium; M, microsporocyte; ML, middle layer; and T, tapetal cell. Scale bars, 10 μm. (M and N) Western blot analysis of the processing of GFP-fused TPD1 proteins. (M) No band was seen for wild-type (WT) or TPD1:TPD1sp-ΔTPD -GFP/tpd1 plants, whereas TPD1:TPD1sp-GFP-ΔTPD1/tpd1 plants exhibited a 41-kD band. By subtracting 28 kD for GFP, we calculate that the mature TPD1 protein is about 13 kD in size. (N) Wild-type (WT) plants showed no band; TPD1:TPD1sp-GFP-ΔTPD1/tpd1 plants exhibited a 41-kD band; TPD1:GFP-ΔTPD1/tpd1 plants exhibited a non-cleaved 45-kD band; and TPD1:TPD1sp-GFP-ΔTPD1K135G R136G/tpd1 plants exhibited a non-cleaved 48-kD band. Arrowheads indicate the 41-kD bands. Bottom: Coomassie blue staining of RuBisCO.
Fig 2
Fig 2. Genetic identification of the mature TPD1 protein and importance of cysteine residues.
Red bar: the TPD1 putative signal peptide, Cyan bar: the non-conserved N-terminal region, and Blue bar: the conserved C-terminal domain, with cysteine positions shown as vertical orange lines. The 2.7-kb TPD1 promoter was used in all constructs, which were introduced into the tpd1 mutant. The complementation rate (%) indicates the percentage of complemented plants among all examined plants. Plants with normal siliques were counted as complemented plants. (A) Schematic diagrams showing the full-length TPD1 and a series of truncations from the N- and C-terminal ends of the conserved C-terminal domain. Numbers indicate amino acid positions. (B) Complementation rates (%) of the TPD1 truncations. Compared with the full-length TPD1, ΔC1 and ΔC2 rescued the tpd1 phenotype, but ΔC3, ΔN1 and ΔN2 did not (n = numbers of examined plants). (C) Schematic diagrams showing TPD1 constructs with mutated cysteine residues. Red vertical lines indicate substitutions of cysteines to serines. (D) Complementation rates (%) of site-mutated versions of TPD1 (mutations on cysteine residues: C77S, C107S, C111S, C120S, C142S, and C175S; n = numbers of examined plants). C77S, C107S, and C111S failed to complement the tpd1 phenotype; C120S exhibited a small complementation effect; and C142S and C175S complemented the tpd1 phenotype. (E) Western blotting was used to confirm the expressions of the truncated ΔN1 and ΔC3 proteins. Wild-type (WT) plants exhibited no band; TPD1:TPD1sp-GFP-ΔN1/tpd1 plants exhibited a 38-kD band; TPD1:TPD1sp-GFP-ΔTPD1/tpd1 plants exhibited a 41-kD band; and TPD1:TPD1sp-GFP-ΔC3/tpd1 plants exhibited a 39-kD band. Bottom: Coomassie blue staining of RuBisCO.
Fig 3
Fig 3. The mature TPD1 interacts with the EMS1 LRR domain at two sites.
Bimolecular Fluorescence Complementation (BiFC) experiments were performed using Arabidopsis mesophyll protoplasts to test the interaction between the mature TPD1 and EMS1 and determine the TPD1-interacting site(s) in EMS1. 35S:EYFP was used as a control to monitor the transfection efficiency. At least three independent experiments were performed for each assay. (A) Schematic diagrams showing the truncated and mutated versions of TPD1. Red bar: the putative signal peptide of TPD1, Cyan bar: the non-conserved N-terminal region, Blue bar: the conserved C-terminal domain, with cysteine positions shown as vertical orange lines, Yellow oval: nEYFP (N-terminal EYFP) inserted right after the signal peptide of TPD1, and Pink line in the nEYFP- TPD1K135G R136G construct: K135GR136G mutations. Size bar indicates TPD1 alone, and does not include nEYFP. (B-D) Confocal images showing that cEYFP-LRR (the full-length EMS1 LRR domain) interacts with nEYFP-TPD1 (B) and nEYFP-ΔC2 (C), but not nEYFP- TPD1K135G R136G (D). Scale bars, 10 μm. (E-O) Identification of TPD1-binding domains in EMS1. (E) Schematic diagrams showing the primary structures of EMS1 and the truncated/mutated versions used for the BiFC assays. SP: signal peptide, LRRNT: leucine-rich repeat containing N-terminus, LRR: leucine-rich repeat, GAP: non-leucine-rich repeat gap region between the two LRRs, OJM: outer juxtamembrane domain, IJM: inner juxtamembrane domain, TM: transmembrane domain, KD: kinase domain, Red bar in the cEYFP-EMS1K104N construct: K104N mutation. All EMS1 constructs contained SP, OJM, TM, and IJM. Orange oval represents the C-terminal EYFP (cEYFP). Size bar indicates EMS1 alone, and does not include cEYFP. (F-O) Confocal images showing that the mature TPD1 (nEYFP-ΔC2) interacts with cEYFP-EMS1 [the full-length EMS1, (F)], cEYFP-LRR [the full-length EMS1 LRR domain, (G)], cEYFP-ΔLRR-I (J), cEYFP-ΔLRR-III (L), and cEYFP-ΔLRR-IV (N), but not with cEYFP-KD (H), cEYFP-BRI1 [(I), negative control], cEYFP-ΔLRR-II (K), cEYFP-EMS1K104N (M), or cEYFP-ΔLRR-V (O). Scale bars, 10 μm.
Fig 4
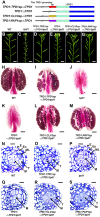
Fig 4. The putative signal peptide of TPD1 is required for its normal function.
To test if the putative signal peptide of TPD1 and the N-terminal signal peptide-directed secretion of TPD1 are required for its function in anther cell fate determination, vectors encoding TPD1s in which the putative signal peptide had been replaced with known secreted signal peptides were introduced into the tpd1 mutant and assessed for their ability to rescue the tpd1 phenotype. (A) Schematic diagrams showing the structures of the TPD1:TPD1sp-ΔTPD1, TPD1TPD1, TPD1:CLV3sp-ΔTPD1, and TPD1:PAP1sp-ΔTPD1 constructs. Red bar: the TPD1 putative signal peptide, Orange bar: the CLV3 signal peptide, Purple bar: the PAP1 signal peptide, Cyan bar: the non-conserved N-terminal region, Blue bar: the conserved C-terminal domain, and ΔTPD1: TPD1 without the putative signal peptide. The 2.7-kb TPD1 promoter was used for all constructs. (B-G) Compared with wild-type plants (B), primary inflorescences from 80% (96/120) of TPD1:TPD1sp-ΔTPD1/tpd1 (D), 72% (36/50) of TPD1:CLV3sp-ΔTPD1/tpd1 (F), and 70% (28/40) of TPD1:PAP1sp-ΔTPD1/tpd1 (G) plants showed normal siliques, whereas 100% (88/88) of TPD1TPD1/tpd1 plants (E) exhibited short siliques comparable to those of tpd1 plants (C). Scale bars, 5 mm. (H-M) Pollen viability tests performed using Alexander pollen staining show functional pollen grains (red-stained) in wild-type (H), TPD1:TPD1sp-ΔTPD1/tpd1 (I), TPD1:CLV3sp-ΔTPD1/tpd1 (L), and TPD1:PAP1sp-ΔTPD1/tpd1 (M) anthers, but not in tpd1 (J) or TPD1TPD1/tpd1 (K) anthers. Scale bars, 50 μm. (N-S) Semi-thin sections of stage-5 anthers showing normal anther cell differentiation in wild-type (N), TPD1:TPD1sp-ΔTPD1/tpd1 (O), TPD1:CLV3sp-ΔTPD1/tpd1 (R), and TPD1:PAP1sp-ΔTPD1/tpd1 (S) anthers, but not in TPD1:△TPD1/tpd1 (Q) or tpd1 (P) anthers, which lacked tapetal cells and exhibited excess microsporocytes. E, epidermis; En, endothecium; ML, middle layer; T, tapetal cell; and M, microsporocyte. Scale bars, 10 μm.
Fig 5
Fig 5. TPD1 is a secreted protein whose localization at the plasma membrane depends on EMS1.
35S:TPD1sp-GFP-ΔTPD1 and 35S:TPD1sp-GFP-ΔTPD1 35S:EMS1 transgenic plants were used to analyze the localization and secretion of TPD1 in root cells. (A-C) Confocal images of 35S:TPD1sp-GFP-ΔTPD1 root cells showing TPD1 proteins [arrows, (A)], FM4-64-stained trafficking vesicles [arrows, (B)], and GFP signals overlapping with trafficking vesicles [arrows, (C)]. (D, E) Confocal images of 35S:TPD1sp-GFP-ΔTPD1 root cells treated without (D) or with (E) BFA, which blocks the formation of Golgi-derived vesicles. Arrows in (E) indicate aggregated TPD proteins. (F-H) Confocal images of 35S:TPD1sp-GFP-ΔTPD1 35S:EMS1 root cells showing TPD1sp-GFP-ΔTPD1 proteins at the plasma membrane (F: GFP alone, G: FM4-64-stained, and H: merged). Scale bars, 10 μm.
Fig 6
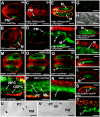
Fig 6. Localization of TPD1 and EMS1 in anthers.
(A-T) Confocal images showing merges of red chlorophyll autofluorescence and green GFP signals, with the exceptions of (G) and (H). (A, B) In TPD1:mGFP5er stage-4 (A) and stage-5 (B) anthers, the TPD1 promoter was active only in precursors of microsporocytes and microsporocytes, respectively. (C, D) In the TPD1:TPD1sp-GFP-ΔTPD1/tpd1 stage-4 anther, TPD1 proteins were detected in precursors of microsporocytes (D, high magnification of C). (E, F) In the TPD1:TPD1sp-GFP-ΔTPD1/tpd1 stage-5 anther, TPD proteins were mainly localized in microsporocytes, but were also detected at the surface of tapetal cells (F, high magnification of E). (G, H) TPD1 proteins were localized in vesicle-like compartments of microsporocytes isolated from TPD1:TPD1sp-GFP-ΔTPD1/tpd1 stage-5 anthers (H, confocal image merged with DIC-viewed microsporocytes). (I, J) In the TPD1:TPD1sp-GFP-ΔTPD1/ems1 stage-5 anther, the TPD1 localization domain was expanded and TPD1 proteins were evenly distributed in microsporocytes as these anthers lacked tapetal cells (J, high magnification of I). (K, L) In TPD1:GFP-ΔTPD1 (K) and TPD1:TPD1sp-GFP-ΔTPD1K135G R136G (L) stage-5 anthers, TPD1 proteins were restricted to microsporocytes, regardless of the presence of EMS1. (M, N) In the EMS1:mGFP5er stage-4 anther, the EMS1 promoter was active in outer secondary parietal cells (OSPC) and inner secondary parietal cells (ISPC) (N, high magnification of M). (O, P) In the early EMS1:mGFP5er stage-5 anther, the EMS1 promoter was active in the middle layer (ML) and precursors of tapetal cells (PT) (P, high magnification of O). (Q, R) In the EMS1:mGFP5er stage-5 anther, EMS1 promoter activity was only detected in tapetal cells (T) (R, high magnification of Q). (S, T) In the EMS1:EMS1-3xGFP/ems1 stage-5 anther, EMS1 proteins were only observed at surfaces of tapetal cells (T shows a higher magnification of S). (U, V) EM-immunolabeling results showing TPD1 (U) and EMS1 (V) proteins at the plasma membrane of precursors of tapetal cells from TPD1:TPD1sp-GFP-ΔTPD1/tpd1 and EMS1:EMS1-3xGFP/ems1 early stage-5 anthers, respectively. For each GFP fusion gene, at least 15 independent T2 plants were observed. Similar GFP signals were observed from >90% tested plants. The anther stage was determined by FM4-64 staining (See S5 Fig) after GFP images were acquired. ISPC, inner secondary parietal cell; M, microsporocyte; ML, middle layer; OSPC, outer secondary parietal cell; PM, precursor of microsporocyte; PT, precursor of tapetal cell; S, stage; and T, tapetal cell. (A-C, E, I, K, L, M, O, Q, S) Scale bars, 50 μm. (D, F, J, N, P, R, T) Scale bars, 20 μm. (G, H) Scale bars, 10 μm. (U, V) Scale bars, 0.2 μm.
Fig 7
Fig 7. The movement of TPD1 from epidermis to inner cell layers in ML1:TPD1sp-GFP-ΔTPD1 anthers.
(A, D, G) show the GFP signal; (B, E, H) show chlorophyll autofluorescence; and (C, F, J) show merged images. (A-C) ML1:mGFP5er stage-5 anther showing GFP signals only in the epidermis (arrow). (D-F) ML1:TPD1sp-GFP-ΔTPD1 stage-5 anther showing an expanded GFP signal domain (arrows) that suggests the TPD1 proteins have moved to subepidermal cells. (G-I) ML1:TPD1sp-GFP-ΔTPD1/ems1 stage-5 anther showing GFP signals only in the epidermis (arrow). Twenty ML1:mGFP5er, 15 ML1:TPD1sp-GFP-ΔTPD1, and 19 ML1:TPD1sp-GFP-ΔTPD1/ems1 T2 plants were analyzed. Similar GFP signals were observed in all examined plants of each group. Scale bars, 20 μm.
Fig 8
Fig 8. Ectopic expression of TPD1 in anther epidermis promotes periclinal anther wall cell division and tapetal cell differentiation.
(A-C) Anther lobes of wild-type plants at stages 5 (A), 7 (B), and 13 (C). (D-F) Anther lobes of tpd1 plants at stages 5 (D), 7 (E), and 13 (F). (G-I) Anther lobes of ML1:TPD1 plants at stages 5 (G), 7 (H), and 13 (I). (J-L) Anther lobes of ML1:TPD1/tpd1 plants at stages 5 (J), 7 (K), and 13 (L). Red dots indicate the somatic anther wall cell layers. Arrows in (A, B, G, H) indicate tapetal cells. (M-P) At stage 5, in situ hybridization shows expression of the tapetal cell marker gene, A9, in a single layer of tapetal cells of the wild-type anther (M, arrow), in two cell layers of the ML1:TPD1 anther (N, arrows), and in a few cells of the ML1:TPD1/tpd1 anther (P, arrow). No A9 expression was found in the tpd1 anther (O). Scale bars, 10 μm. (Q, R) QRT-PCR results showing expressions of the tapetal cell marker genes, A9, A6, and ATA7, in wild-type and ML1:TPD1 anthers (Q), and in tpd1 and ML1:TPD1/tpd1 anthers (R). Stars indicate a significant difference (P<0.01). (S) Numbers of microsporocytes per transverse section taken at the mid-point of the abaxial lobe in tpd1 (n = 20) and ML1:TPD1/tpd1 (n = 20) anthers at stage 5. Thirty ML1:TPD1 plants and 30 ML1:TPD1/tpd1 plants were subjected to semi-thin sectioning. Eighty percent (24/30) of ML1:TPD1 plants and 90% (27/30) of ML1:TPD1/tpd1 plants showed similar phenotypes in anther development.
Fig 9
Fig 9. Missorting of TDP1 demonstrates that microsporocyte-derived TPD1 mediates the acquisition of tapetal cell fate.
(A) Schematic diagrams showing the structures of the TPD1:TPD1, TPD1:TPD1-ctVSS, and TPD1:TPD1-ctVSS-GG constructs. Red bar: the TPD1 putative signal peptide, Cyan bar: the non-conserved N-terminal region, Blue bar: the conserved C-terminal domain, Orange bar, the C-terminal vacuole sorting signal (ctVSS), and “GG”: two glycines added to ctVSS. (B-D) Primary inflorescences showing normal fertilities (indicated by long siliques) were obtained from TPD1:TPD1/tpd1 (B) and TPD1:TPD1-ctVSS-GG/tpd1 (D) plants, whereas TPD1:TPD1-ctVSS/tpd1 plants were sterile (as indicated by short siliques) (C). Scale bars, 1 cm. (E) Complementation rates (%) of TPD1:TPD1/tpd1 (n = 40), TPD1:TPD1-ctVSS/tpd1 (n = 60), and TPD1:TPD1-ctVSS-GG/tpd1 (n = 56) plants. (F) A stage-5 anther lobe from a TPD1:TPD1/tpd1 plant showing normal anther cell differentiation. (G-I) Stage-5 anther lobes from TPD1:TPD1-ctVSS/tpd1 plants showing defective anther cell differentiation: a monolayer of vacuolated tapetal-like cells and degenerating microsporocytes (G), delaminated vacuolated tapetal-like cells and degenerating microsporocytes (H), and a lack of tapetal cells coupled with the presence of excess microsporocytes, which is similar to the tpd1 phenotype (I). Thirty sterile TPD1:TPD1-ctVSS/tpd1 plants were subjected to semi-thin sectioning. Among them, most (21/30) exhibited the anther phenotype shown in (G), five exhibited that shown in (H), and four exhibited that shown in (I). E, epidermis; En, endothecium; M, microsporocyte; ML, middle layer; T, tapetal cell; and TL, tapetal-like cells. Scale bars, 10 μm.
Fig 10
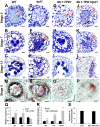
Fig 10. Genetic ablation of microsporocytes shows the interdependence of tapetal cell and microsporocyte differentiation.
(A) A wild-type anther lobe at stage 5 showing four layers of anther wall cells (indicated by red dots, the same hereinafter) and microsporocytes. (B-E) SDS:SDS-BANASE anther lobes at stage 5, which we divided into three classes. Class I: four somatic cell layers, including one organized single-cell layer that surrounds the microsporocytes and is made of cells that are morphologically similar to tapetal cells (B). Class II: four somatic cell layers, including a monolayer of vacuolated tapetal-like cells (C) and three somatic cell layers that contains delaminated vacuolated tapetal-like cells (D). Degenerating microsporocytes are observed in Class-II anthers. Class III: three somatic cell layers and excess microsporocytes (E). Among 60 T1 plants analyzed by semi-thin section, 16.7% (10/60) were Class I, 70.0% (42/60) were Class II, and 13.3% (8/60) were Class III. (F-J) In situ hybridization results showing that the expression of the tapetal cell marker gene, A9 at stage 5 was strong in the tapetum of the wild-type anther (F), but was progressively decreased in tapetal-like cells from Class-I (G) and Class-II (H, I) SDS:SDS-BANASE anthers. No A9 expression was detected in the Class-III SDS:SDS-BANASE anther (J). (K-O) In situ hybridization results showing the expression of the microsporocyte marker gene, SDS, in anthers. In wild-type anthers, SDS expression was weak at stage 4 in precursors of microsporocytes (K), but strong at stage 5 in microsporocytes (L). SDS was weakly expressed in the microsporocytes of SDS:SDS-BANASE anthers (M-O). The SDS expression domain was relatively expanded in SDS:SDS-BANASE Class-II and -III anthers (N, O). E, epidermis; En, endothecium; M, microsporocyte; ML, middle layer; PM, precursor of microsporocyte; T, tapetal cell; and TL, tapetal-like cell. Scale bars, 10 μm. (P, Q) We used qRT-PCR to examine expression levels of A9 and BARNASE in anthers from three representative transgenic plants of each class. From Class I to Class III anthers, the expression of A9 progressively decreased (P), while that of BARNASE increased (Q).
Fig 11
Fig 11. Working model of TPD1-EMS1 signaling in anther development.
(A) Early anther development in wild-type, tpd1, and ems1 plants. In wild-type stage-4 anthers, EMS1 is expressed in outer and inner secondary parietal cells (OSPC and ISPC), whereas TPD1 is synthesized in precursors of microsporocytes (PM). The binding of secreted TPD1 to EMS1 at the plasma membrane of ISPC promotes the periclinal division of these cells, generating the middle layer (ML) and precursors of tapetal cells (PT). Early in stage 5, PT perceive sufficient TPD1, which sustains TPD1-EMS1 signaling and leads to the differentiation of functional tapetal cells (T) late in stage 5. Differentiated T in turn suppress the proliferation of microsporocytes (M). In the tpd1 or ems1 mutant, TPD1-EMS1 signaling is blocked. The failure of ISPC division leads to an absence of T, which results in the formation of excess M. (B) Early anther development in ML1:TPD1 and ML1:TPD1/tpd1 plants. TPD1 is highly expressed in epidermis (E) and moves to regions beneath OSPC and ISPC. Activated TPD-EMS1 signaling promotes the periclinal division of OSPC and ISPC. In ML1:TPD1 anthers (wild-type background), OSPC generate two layers of endothecium (En). ISPC and their daughter cells receive sufficient TPD1-EMS1 signaling, which leads to the formation of extra T/tapetal-like cells (TL). In ML1:TPD1/tpd1 anthers (tpd1 background), no TPD1 is synthesized in PM. Low-level TPD1-EMS1 signaling can promote OSPC and ISPC division, but only the few PT that receive sufficient TPD1-EMS1 signaling differentiate into TL. Without T, extra anther wall cell layers present but fail to suppress M proliferation in ML1:TPD1/tpd1 anthers. (C) Early anther development in TPD1:TPD1-ctVSS/tpd1 and SDS:SDS-BARNASE plants. In most TPD1:TPD1-ctVSS/tpd1 anthers, there is either sufficient TPD1 to promote ISPC division but PT cannot differentiate into functional T, or there is insufficient TPD1 to promote ISPC division, resulting in a complete lack of T and the presence of excess M. In most SDS:SDS-BARNASE anthers, arrest of M differentiation occurs late and ISPC still divide to form ML and PT, but the differentiation of functional T is not completed due to the lack of TPD1. In a few SDS:SDS-BARNASE anthers, in contrast, M differentiation is arrested early, ISPC division fails, and excess M are produced. Question marks indicate instances where the cell fate is not clear.

Similar articles

Cited by

References

    1. Goldberg RB, Beals TP, Sanders PM (1993) Anther development: basic principles and practical applications. Plant Cell 5: 1217–1229. - PMC - PubMed
    1. Scott RJ, Spielman M, Dickinson HG (2004) Stamen structure and function. Plant Cell 16 Suppl: S46–60. - PMC - PubMed
    1. Walbot V, Evans MM (2003) Unique features of the plant life cycle and their consequences. Nat Rev Genet 4: 369–379. - PubMed
    1. Zhao D (2009) Control of anther cell differentiation: a teamwork of receptor-like kinases. Sex Plant Reprod 22: 221–228. 10.1007/s00497-009-0106-3 - DOI - PubMed
    1. Feng X, Zilberman D, Dickinson H (2013) A conversation across generations: soma-germ cell crosstalk in plants. Dev Cell 24: 215–225. 10.1016/j.devcel.2013.01.014 - DOI - PubMed

Publication types