. 2016 Aug 17;91(4):878-892.
doi: 10.1016/j.neuron.2016.07.034.

Experience-Dependent Plasticity Drives Individual Differences in Pheromone-Sensing Neurons

Affiliations

Experience-Dependent Plasticity Drives Individual Differences in Pheromone-Sensing Neurons

Pei Sabrina Xu et al. Neuron. .

Abstract

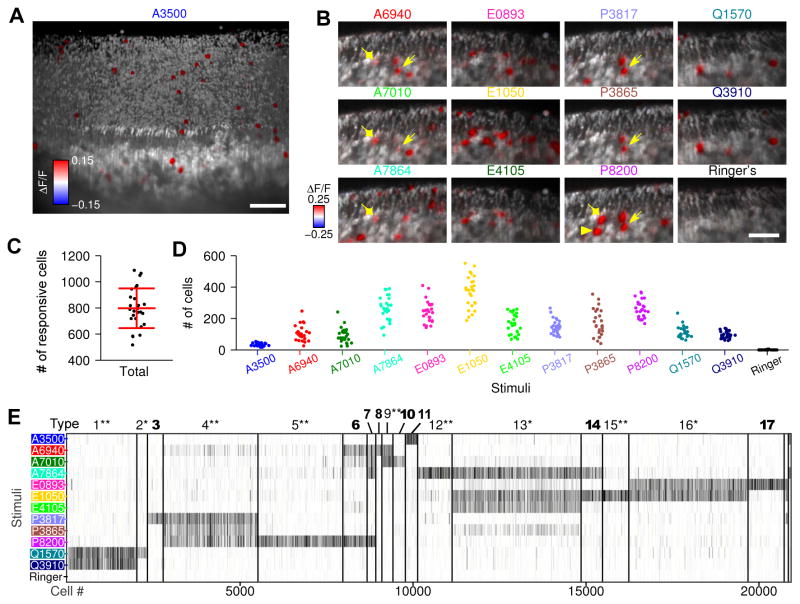
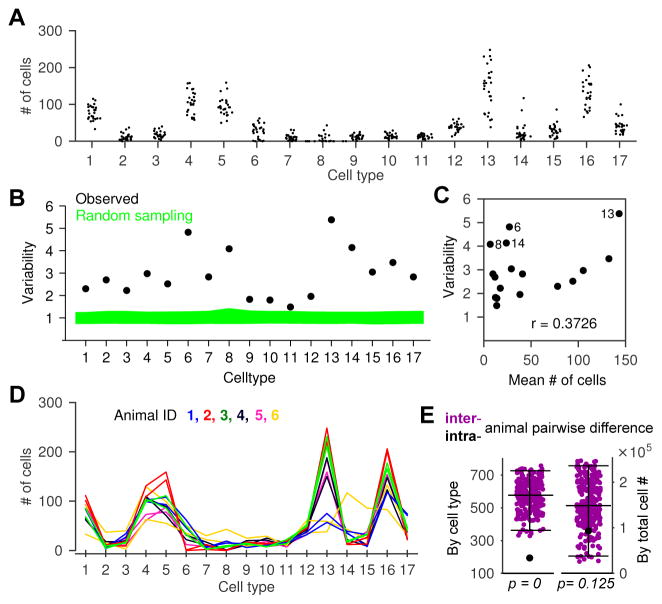
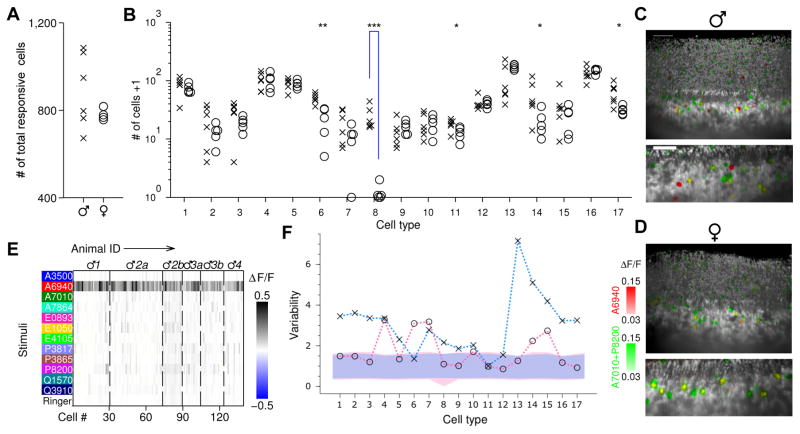
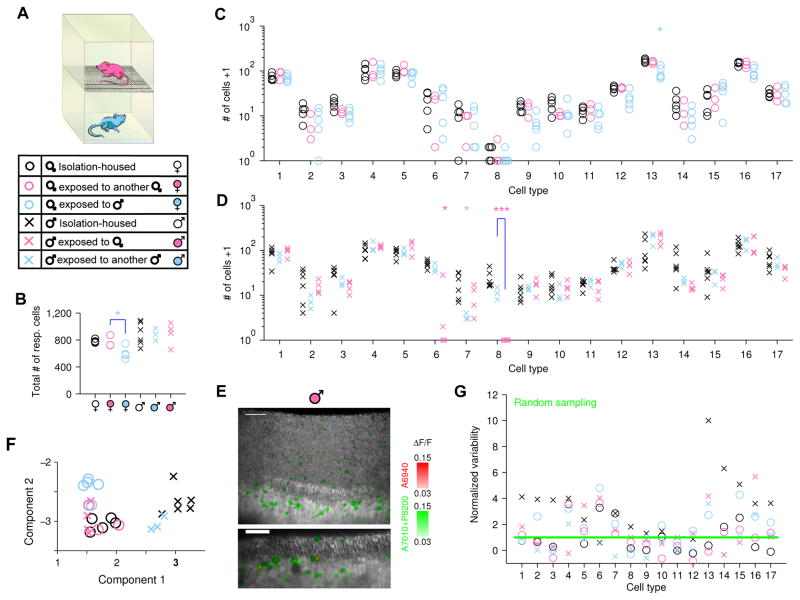
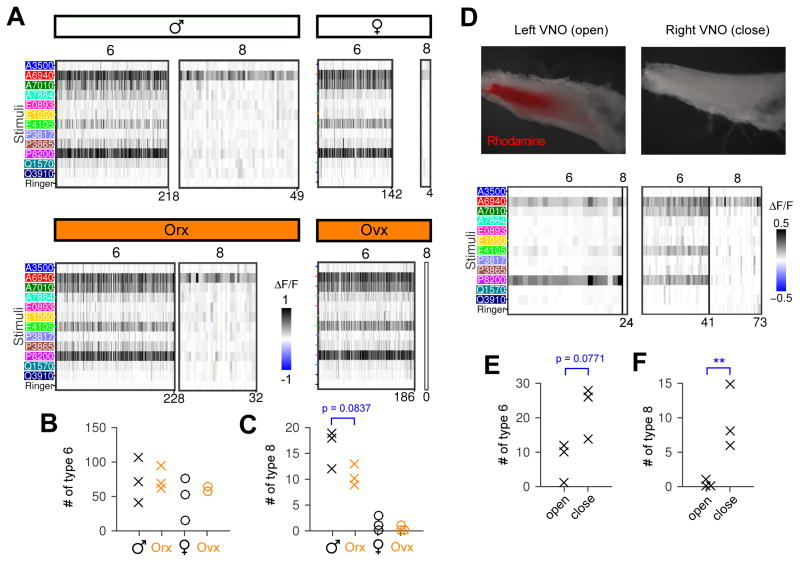
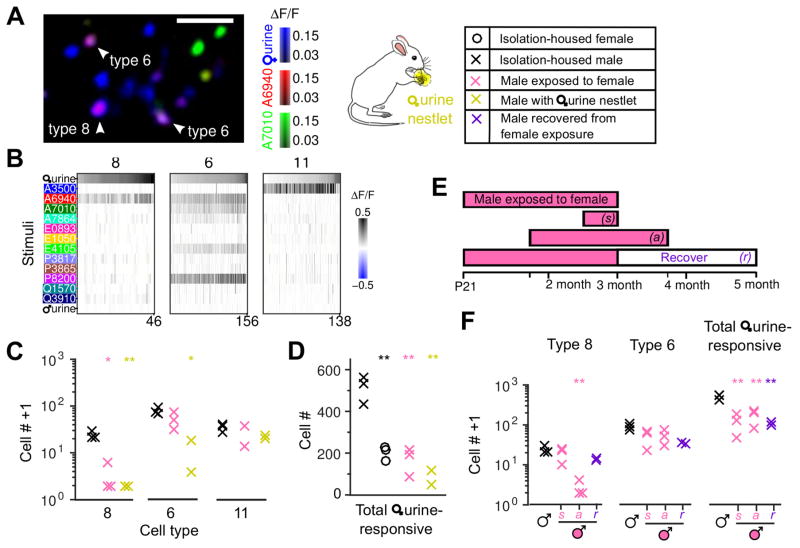
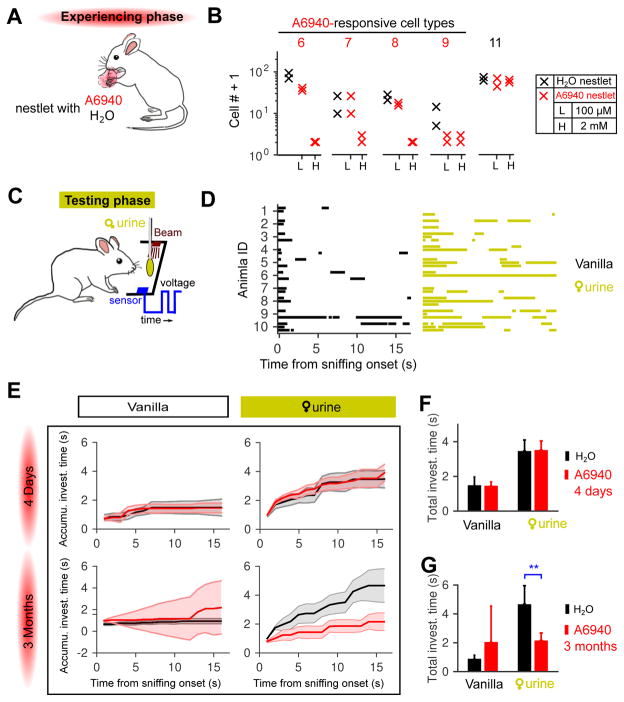
Different individuals exhibit distinct behaviors, but studying the neuronal basis of individuality is a daunting challenge. Here, we considered this question in the vomeronasal organ, a pheromone-detecting epithelium containing hundreds of distinct neuronal types. Using light-sheet microscopy, we characterized in each animal the abundance of 17 physiologically defined types, altogether recording from half a million sensory neurons. Inter-animal differences were much larger than predicted by chance, and different physiological cell types showed distinct patterns of variability. One neuronal type was present in males and nearly absent in females. Surprisingly, this apparent sexual dimorphism was generated by plasticity, as exposure to female scents or single ligands led to both the elimination of this cell type and alterations in olfactory behavior. That an all-or-none apparent sex difference in neuronal types is controlled by experience-even in a sensory system devoted to "innate" behaviors-highlights the extraordinary role of "nurture" in neural individuality.


Figures

Figure 1
Figure 1. Large-scale recording of mouse vomeronasal sensory responses to sulfated steroids and classification of VSN physiological types
(A) Three-dimensional rendering from an imaging volume of the whole-mount VNO. Gray scale is the raw fluorescence intensity of GCaMP2, and red/blue color scale represents the GCaMP2 fluorescence intensity change (ΔF/F) caused by stimuli, here exemplified by the androgen ketoetiocholanolone sulfate (A3500). Cells that responded to A3500 are visualized by the red cell bodies inside the tissue and the red dendritic knobs on the tissue surface (see comparison in Figure S1 C). (B) Two-dimensional slices of VNO imaging volumes show cellular responses to the other 11 sulfated steroids but not Ringer’s control. VSNs responsive to single steroids (illustrated by epipregnanolone sulfate, P8200) were heterogeneous: arrowheads indicate a cell responding exclusively to P8200; diamonds indicate a cell responding to P8200 and three androgens (A6940, A7010 and A7864); arrows indicate a cell responding to all pregnanolones (P8200, P3865 and P3817) and two androgens. Scale bar, 50 μm. (C &D) Cell counts in each VNO imaging volume, in terms of total number of steroid-responsive cells (C) and number of cells responding to each stimulus (D). Each dot represents a single imaging volume. The label “# of cells” always means “# of responsive cells” in all the figures. (E) Cluster organization of cells (from 26 imaging volumes) revealed at least 17 reproducibly-identified physiological types of VSN. *: previously-reported VSN physiological types (Meeks et al. 2010; Turaga and Holy 2012); **: corresponding to observed mitral cell responses in the accessory olfactory bulb (Meeks et al., 2010); bold: newly-discovered types. Each column represents a single cell. For each stimulus, gray intensity represents the average induced fluorescence change ΔF/F across 4 trials. See also Figure S1 and Movie S1.
Figure 2
Figure 2. Individual mice exhibited non-stochastic variability in VSN functional types
(A) Cell counts of each VSN functional type in each imaging volume. (B) Cell count variability (see Experimental Procedures) of each type in all imaging volumes. Green represents the 95% confidence interval if cell numbers are drawn from a multinomial distribution. (C) Variability was not correlated with cell abundance, r: Pearson’s correlation coefficient (p=0.14). (D) Pairs of imaging volumes recorded from the same animals. Each color represents one animal, and the two lines with the same color are the two non-overlapping imaging volumes from the same animal. (E) Left (by cell type): summed difference of intra-animal pairs (●) was smaller than that of any combination of inter-animal pairs (●, all 265 possible permutations of pairs in E are shown). Right (by total cell #): intra-animal difference (●) is not significantly smaller than all possible inter-animal differences ●. Error bars represent 95% confidence interval. See also Figure S2.
Figure 3
Figure 3. Functional neuronal types in VNOs from male and female mice
(A &B) Cell counts in each male (×) and female (○) VNO imaging volume, in terms of total number of steroid-responsive cells (a) and number of cells of each VSN functional type (B). Type 8 were more abundant in male than in female mice (p=3.1×10⁻⁵, Students’ t-test, significance tested with Ŝidák correction for multiple comparisons). ***: p<0.001; **: p<0.01; *: p<0.05. Note type 6 and 11 were not significant when corrected for multiple comparisons. Throughout the figures involves multiple cell types, y axes are in logarithmic scale, and “# of cells +1” were plotted to avoid displaying log0=−∞. (C &D) Three-dimensional images (upper) and two-dimensional slices (lower) of male (C) and female (D) VNOs. Red indicates the fluorescence change caused by epitestosterone sulfate (A6940) (ΔF/FA6940), and green colorizes max(ΔF/FA7010, ΔF/FP8200). Type-8 cells, exclusively responsive to A6940, are therefore red; note these were present only in the male VNO but not in the female VNO. Responses induced by P8200 (green) were particularly intense and spread to neighboring pixels, producing a green halo around the yellow cells. Scale bar, 50 μm. (E) Type-8 VSNs were found in all 6 male VNO imaging volumes (from 4 individual male mice). Dashed lines separate cells from different imaging volumes. Each imaging volume is labeled with the animal’s identity; multiple imaging volumes collected from the same animal are differentiated by letter. (F) Variability of male (×) and female (○) mice. For each sex, cell count variability of each type, and 95% confidence interval for multinomial random sampling, are shown as in Figure 2B. The confidence intervals are shown in pink and blue for the female and male groups, respectively. Within-sex variabilities were not distinguishable from random sampling in 3 (male) and 11 (female) cell types. See also Figure S3 & S4, and Movie S2–4.
Figure 4
Figure 4. Exposure to female scents triggers the disappearance of the male-specific VSN type
(A) Stacked cages provide chronic exposure to chemical social cues without permitting aggressive encounters or mating. Six groups of animals with varied sex and social cue experience are represented by different markers throughout the figure. (B–D) Number of cells in VNO imaging volume from mice with different olfactory experiences (see 6 groups in A). B, total number of cells responding to sulfated steroids; C &D, number of cells in each specific VSN functional type. Type-8 cells showed a dramatic decrease in abundance in males exposed to females compared to males exposed to other males (p=7.0×10⁻⁵, Students’ t-test, significance tested with Ŝidák correction for multiple comparison). Statistical tests were performed for all conditions against isolation-housed animals and also between groups with same- and opposite-sex experience. ***: p<0.001; *: p<0.05 (the latter not significant when corrected for multiple comparisons). (E) Three-dimensional rendering (upper) and two-dimensional slice (lower) of a VNO imaging volume from a male mouse exposed to a female. Coloration is identical to Figure 3C&D. The absence of red cells indicates the absence of type-8 VSNs, in contrast with isolation-housed males in Figure 3C and male-exposed males (see also Movie S3, 5 & 6). Scale bar, 50 μm. (F) Whole-animal view of VNO cell-type composition from mice with different sexes and experiences. A linear-discriminant projection onto the two components with largest eigenvalues are shown. Isolation-housed males (×) and females (○) were well separated; males exposed to female cues (×) would be grouped with females (note overlap with circles). (G) Normalized variability for each group of mice with the same sex and experience. For the 6 groups of animals, the numbers of cell types with variability consistent with random sampling (below the 95% confidence level marked by the green line) were 3 (×), 11 (○), 5 (°), 8 (°), 12 (×) and 9 (×) out of 17 types. See also Figure S5 and Movie S5 &6.
Figure 5
Figure 5. Sensory experience, rather than internal hormones, causes the main differences between male and female VSNs
(A) Type 6 and 8 cells in gonadectomized mice. Type 8 cells existed in both normal and orchiectomized males (Orx), but were rarely detected in females even after ovariectomy (Ovx). One of the intact female controls had 3 type-8 cells, the largest number we observed in all 21 females we recorded (1 had three, 1 had two, 3 had one, and the remaining 16/21 females had none). Cells for each group were pooled from 3 GCaMP3 mice. See Figure S6 A–E for all 17 cell types in example mice. (B &C) Number of type-6 (B) and type-8 cells (C) in individual animals. Orx males and Ovx females were not significantly different from normal male and female controls. Note a trend (p=0.084, Students’ t-test) of decreasing abundance of type 8 in males after orchiectomy, but these animals were not statistically distinguishable from control males. (D) Upper: two VNO tissues dissected from the same male mouse. The right naris was permanently closed prior to exposure to the female. Chemical access was limited to the open side, as shown by Rhodamine 6G uptake from dye-soaked nestlets. During physiological recording, stimuli accessed the VNO by superfusion, no matter whether the tissue was from the closed or open side. Lower: type-6 and type-8 neurons from the open and closed VNO. Note type 8 were robustly detected on the closed side, in contract to the open side (only a single cell). See a naris closed female VNO in Figure S6. (E &F) Number of type 6 (E) and type 8 (F) detected in multiple open and closed male VNOs. **: p<0.01, Students’ t-test. See also Figure S6.
Figure 6
Figure 6. Female urine activated specific cell types and caused experience-dependent loss of cell responses
(A) Overlap of type-8 and 6 neurons with responses to female mouse urine (1:50 dilution). A two-dimensional slice is shown; arrowheads represent examples of type-8 and type-6 cells that responded to female urine extracts. Scale bar, 50 μm. (B) Female urine extracts activated type-8, 6 and 11 VSNs, with decreasing strength. All urine-responsive neurons that also responded to at least one sulfated steroid are shown. (C) The number of type-8, 6, and 11 in isolation-housed males (×), males exposed to females (×), and males directly exposed to raw female urine soaked in nestlets (×). Chronic exposure to female mice or to female urine nestlets reduced (to different extents) the abundance of each urine-responsive type compared to non-exposed male control (×). (D) The total number of female urine (1:50 dilution) responsive cells (including type 8 and 6) in different groups of mice. (E) The time window for experience-dependent plasticity. Male mice were exposed to females at different developmental stages for varying exposure durations (pink bars). Besides the regular long-term exposure (~ 2 months) starting from postnatal day 21, exposure starting from adult (after 7-week-old), short-term exposure (1–2 weeks), and recovered (for another 2 months after removing exposure) were tested. (F) Cell counts from mice listed in (E). Note type-8 neurons significantly decreased after long-term exposure even during adulthood, but were not affected by short-term exposure. Type 8 (but not the overall female urine-responsive) neurons recovered significantly from long-term exposure p=0.039, compared to long-term exposed male group. ** p<0.01, * p<0.05, Students’ t-test, each compared to non-exposed male control.
Figure 7
Figure 7. Long-term exposure eliminated responses to epitestosterone sulfate (A6940), and reduced male investigation of female mouse urine
(A) Males were exposed to nestlets soaked with water or A6940 daily during the 4-day or 3-month experience phase. (B) Cell counts of A6940-responsive cell types after long-term exposure to low (100 μM) or high dosage (2 mM) of A6940. (C) Schematic of apparatus used to record episodes of olfactory exploration in freely-behaving animals. The infrared beam was broken (see the blue voltage trace) when the mouse contacted the cotton swab with 20μL of the tested stimulus. (D) Investigatory episodes of 10 male mice to control (1:10000 vanilla only, left) and 1:1 female urine solid-phase extracts (right). Each animal participated in 3 trials, each of which was aligned (t=0) to the time of the first sniff of the cotton swab. Blocks represent continuous periods of investigation. Blank trials were “failure trails” in which the animals never investigated the cotton swab. See Figure S7 for more animals and stimuli tested. (E) Duration of investigation of female urine extracts by male mice with short-term (4 days) and long-term (3 months) stimulus exposure. Cumulative time of ddH2O-exposed (black trace) mice and A6940-exposed mice (red trace) are shown. Data are presented as median±standard error in the median (computed by bootstrap). (F &G) The total investigation time of each group in E. The total investigation time to female urine extracts was not significantly different between ddH2O-exposed and males with short-term A6940 exposure (F), but dramatically decreased by long-term A6940 exposure (G) (**: p<0.0152, Wilcoxon rank-sum test). See individual sniffing patterns and breakdown of investigation time in Figure S7.

Similar articles

Cited by

References

    1. Alekseyenko OV, Baum MJ, Cherry JA. Sex and gonadal steroid modulation of pheromone receptor gene expression in the mouse vomeronasal organ. Neuroscience. 2006;140:1349–57. - PubMed
    1. Axelson M, Graham CE, Sjövall J. Identification and quantitation of steroids in sulfate fractions from plasma of pregnant chimpanzee, orangutan, and rhesus monkey. Endocrinology. 1984;114:337–44. - PubMed
    1. Bean NJ, Wysocki CJ. Vomeronasal organ removal and female mouse aggression: the role of experience. Physiol Behav. 1989;45:875–82. - PubMed
    1. Bergan JF, Ben-Shaul Y, Dulac C. Sex-specific processing of social cues in the medial amygdala. Elife. 2014;3:e02743. - PMC - PubMed
    1. Broad KD, Keverne EB. The post-natal chemosensory environment induces epigenetic changes in vomeronasal receptor gene expression and a bias in olfactory preference. Behav Genet. 2012;42:461–71. - PubMed

LinkOut - more resources