. 2016 Aug 18;7(8):e2341.
doi: 10.1038/cddis.2016.244.

Notch-Hes-1 axis controls TLR7-mediated autophagic death of macrophage via induction of P62 in mice with lupus

Affiliations

Notch-Hes-1 axis controls TLR7-mediated autophagic death of macrophage via induction of P62 in mice with lupus

Xiaojing Li et al. Cell Death Dis. .

Abstract

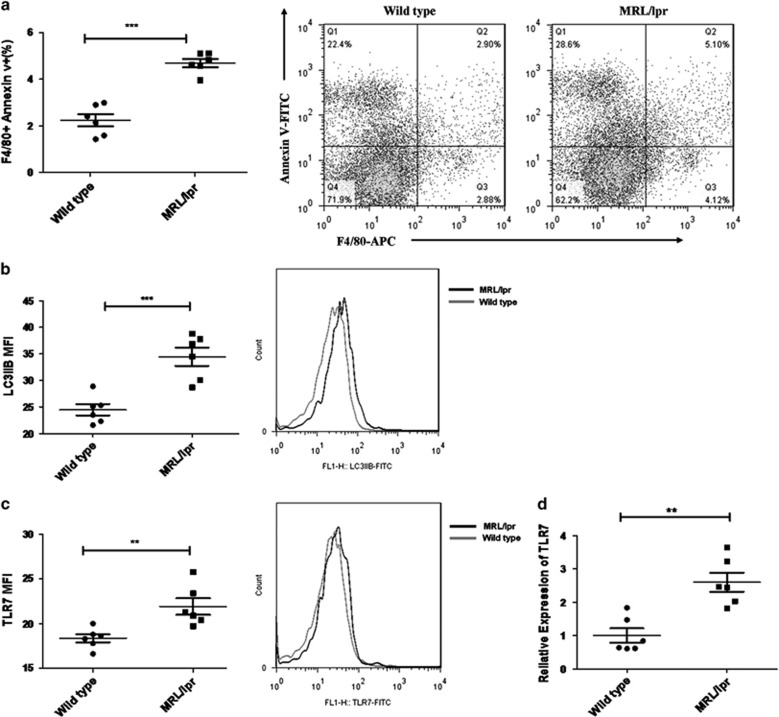
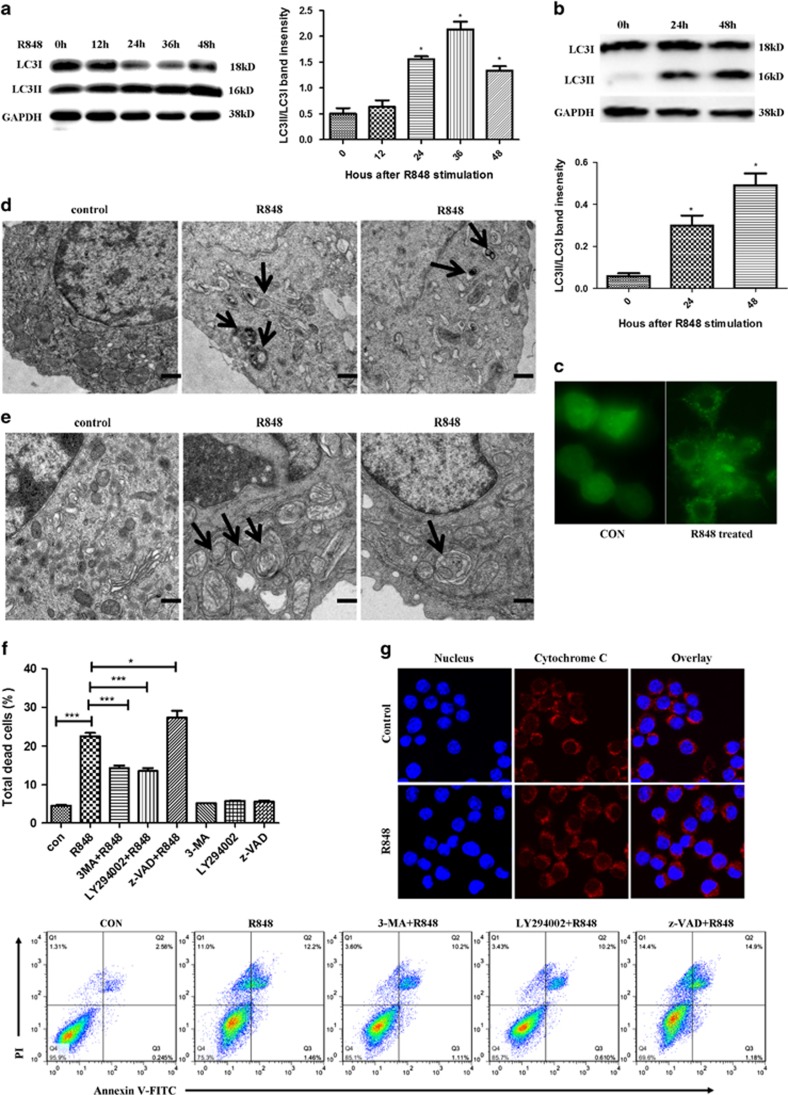
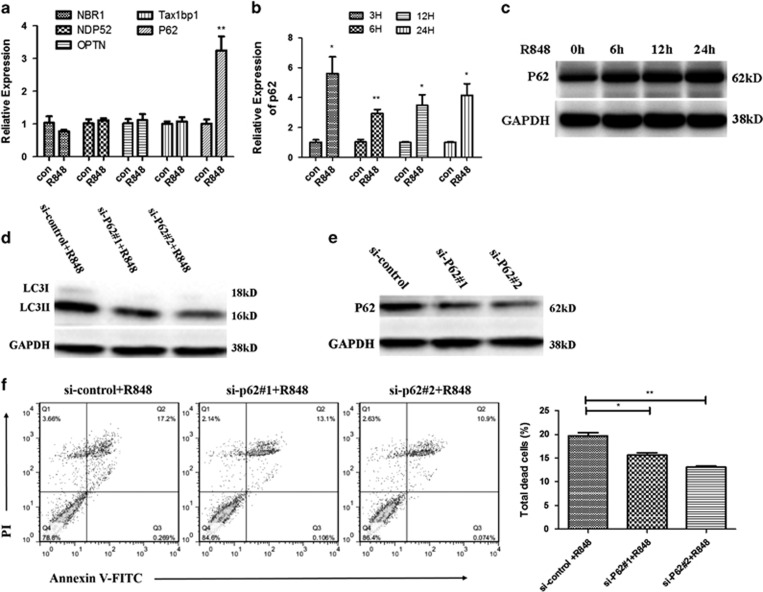
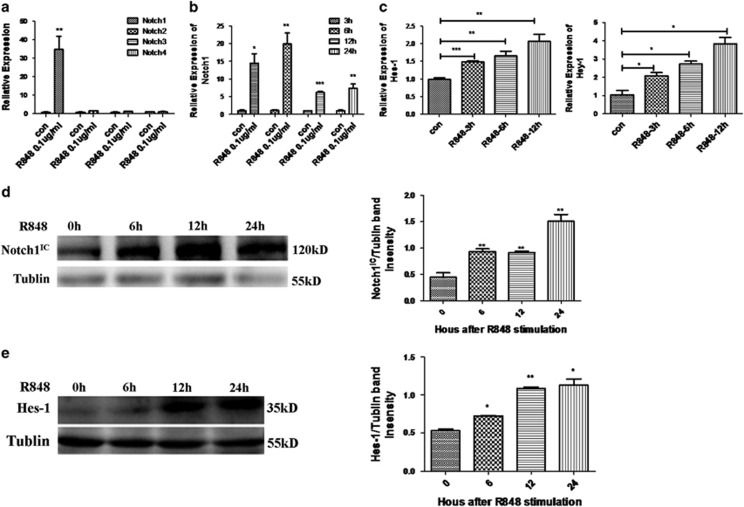
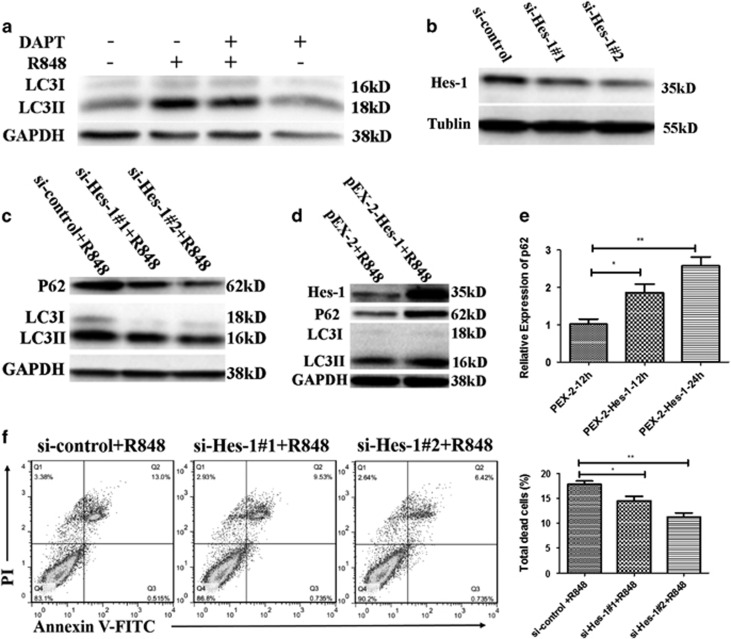
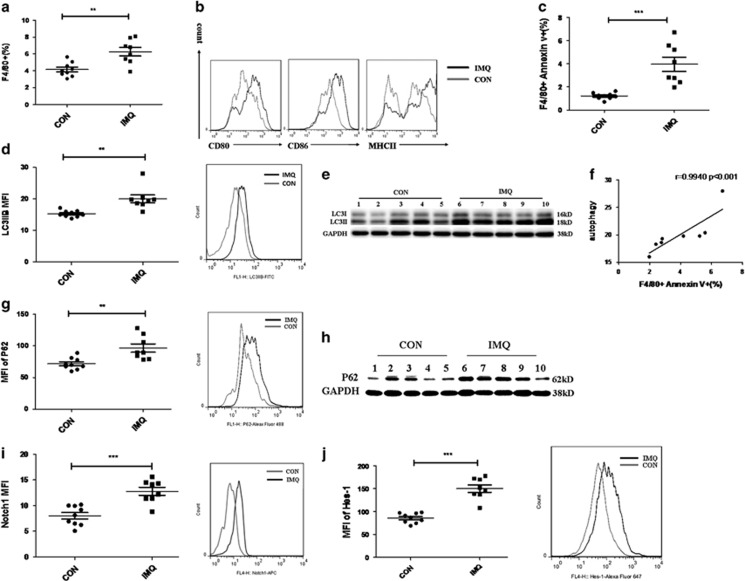
The increased death of macrophages has been considered as a pathogenic factor for systemic lupus erythematosus (SLE), and dysfunction of autophagy may contribute to improper cell death. However, the effect of autophagy on macrophage during the pathogenesis of SLE is still unclear. Here we found that the death rate and autophagy level of macrophages significantly increased in MRL/lpr lupus-prone mice. Activation of toll-like receptor 7 (TLR7) triggered macrophage death in an autophagy-dependent but caspase-independent way in vitro. Moreover, P62/SQSTM1 is thought to have an essential role in selective autophagy. We also demonstrated that P62/SQSTM1 was required for TLR7-induced autophagy, and knockdown of P62 suppressed R848-induced cell death and LC3II protein accumulation. As an important mediator for cell-cell communication, Notch signaling is responsible for cell-fate decisions. Our results showed that activation of TLR7 also upregulated the expression of Notch1, especially its downstream target gene Hairy and enhancer of split 1 (Hes-1) in macrophages. Of note, we found that Hes-1, as a transcriptional factor, controlled TLR7-induced autophagy by regulating P62 expression. Furthermore, to confirm the above results in vivo, TLR7 agonist imiquimod (IMQ)-induced lupus mouse model was prepared. Splenic macrophages from IMQ-treated mice exhibited increased autophagy and cell death as well as enhanced expressions of Notch1 and Hes-1. Our results indicate that Notch1-Hes-1 signaling controls TLR7-induced autophagic death of macrophage via regulation of P62 in mice with lupus.


Figures

Figure 1
Figure 1
Increased death and TLR7 expression of macrophages are exhibited in lupus mice. Splenic cells and peritoneal macrophages were obtained from 22 week-old female MRL/lpr mice (n=6) and age matched female C57BL/6 mice (n=6). (a) The percentage of F4/80+Annexin V+ macrophages among total splenic cells was examined by flow cytometry (left). Representative FACS dot plots showed the proportion of F4/80+Annexin V+ macrophages among all of the splenic cells (right). (b) Flow cytometry analysis of LC3IIB level in F4/80+ splenic macrophages. One pair of representative histograms was shown on the right of the picture. (c) Quantification of TLR7 expression in F4/80+ splenic macrophages by FACS analysis (left). Representative histograms were shown on the right. (d) mRNA level of TLR7 in peritoneal macrophages from lupus mice and control mice was detected by real-time PCR. (ad) The data are shown as means±S.E.M.s and represent two independent experiments. *P-values <0.05, **P<0.01 and ***P<0.001, determined by t-tests
Figure 2
Figure 2
Autophagy is involved in R848-triggered macrophage death in vitro. RAW 264.7 cells and BMDMs were unstimulated or stimulated with 0.1 μg/ml R848 or 0.01 μg/ml R848, respectively. (a) Protein expression of LC3II in RAW 264.7 cells treated with R848 for indicated time was detected by western blot (left). Graphical representation of band intensities was shown on the right of the picture. (b) LC3II expression in BMDMs was examined by western blot after R848 stimulation for indicated time (top). Representative graph of band intensities was shown in the picture blow. (c) Fluorescent images of RAW 264.7 cells transfected with the pcDNA3.1 -GFP-LC3 plasmids and treated with R848 for 24 h subsequently (original magnification × 1000). The images showed GFP-LC3 dots formation in R848-stimulated cells. (d, e) Transmission electron micrographs of RAW 264.7 cells (d) and BMDMs (e) treated with R848 for 48 h (scale bars: 500 nm). The arrows indicated double-membrane structured autophagosomes containing degrading contents. (f) RAW 264.7 cells were pre-treated with the autophagy inhibitor LY294002 (10 μM), 3-MA (0.25 Mm) or the pan-caspase inhibitor z-VAD (40 μM), respectively for 2 h and then treated with R848 for 24 h. The percentage of total dead cells was detected by flow cytometry. Total dead RAW 264.7 cells included Annexin V+ PI+, Annexin V+PI− and Annexin V− PI+ cells. Representative FACS dot plots were shown in the picture below. (g) RAW 264.7 cells were treated with R848 for 24 h and immunostained for cytochrome c. Images were acquired with a confocal microscope (original magnification × 180). (a, b, f) The data are shown as means±S.E.M.s and represent three independent experiments. *P<0.05, ***P<0.001, determined by t-tests
Figure 3
Figure 3
P62/SQSTM1 is requisite for TLR7-induced autophagic death of macrophages. (a) RAW 264.7 cells were unstimulated or stimulated with R848 (0.1 μg/ml) for 6 h. Real-time PCR was carried out to examine mRNA levels of the five autophagic adaptors in RAW 264.7 cells. (b) P62 expression was examined by real-time PCR in RAW 264.7 cells after R848 (0.1 μg/ml) stimulation. (c) Western analysis of P62 expression in RAW 264.7 cells treated with R848 (0.1 μg/ml) for indicated time. (d, f) RAW 264.7 cells were transfected with si-control or si-P62 for 24 h and then stimulated with R848 for 24 h. si-P62#1 and si-P62#2 represent two independent siRNAs targeting P62. (d) Protein level of LC3II was detected by western analysis. (f) The percentage of total dead RAW 264.7 cells was detected by flow cytometry. Total dead RAW 264.7 cells included Annexin V+ PI+, Annexin V+PI−and Annexin V– PI+ cells. Representative FACS dot plots were shown in the left. (e) Degree of knockdown of P62 in samples used in (d). (a, b, f) The data are shown as means±S.E.M.s and represent three independent experiments. *P<0.05, **P<0.01, determined by t-tests
Figure 4
Figure 4
Activation of TLR7 upregulates Notch1-Hes-1 signaling in macrophages in vitro. RAW 264.7 cells were untreated or treated with 0.1 μg/ml R848. (a) Real-time PCR analysis of Notch receptors expression at 6 h. (b, c) mRNA levels of Notch1 (b), Hes-1 and Hey-1 (c) in RAW 264.7 cells treated with R848 for indicated time. (d, e) Western analysis of protein expressions of Notch1IC (d) and Hes-1 (e) in RAW 264.7 cells treated with R848 for indicated time. Representative graphs of band intensities were shown in the right of the blots. Notch1IC expression was normalized to GAPDH and Hes-1 expression was normalized to Tublin. All data are shown as means±S.E.M.s and represent three independent experiments. *P<0.05, **P<0.01 and ***P<0.001, determined by t-tests
Figure 5
Figure 5
Hes-1 regulates TLR7-induced autophagic death of macrophages via P62. (a) RAW 264.7 cells were pre-treated with DAPT (10 μM) or DMSO (0.02%) for 2 h and then stimulated by R848 (0.1 μg/ml) for 24 h. Protein level of LC3II was assessed by western blot. (b) Degree of knockdown of Hes-1 in samples used in (c). (c, f) RAW 264.7 cells were transfected with si-control or si-Hes-1 for 24 h and then stimulated with R848 for 24 h. si-Hes-1#1 and si-Hes-1#2 represent two independent siRNAs targeting Hes-1. (c) Protein levels of Hes-1, P62 and LC3II were detected by western blot and normalized to GAPDH. (f) The percentage of total dead RAW 264.7 cells was detected by flow cytometry. Total dead RAW 264.7 cells included Annexin V+ PI+, Annexin V+PI− and Annexin V− PI+ cells. Representative FACS dot plots were shown (left). (d) PEX-2 plasmid transfected or PEX-2-Hes-1 plasmid transfected RAW 264.7 cells were stimulated with R848 (0.1 μg/ml) for 24 h. Protein expression levels of Hes-1, P62 and LC3II were detected by western blot and normalized to GAPDH. (e) mRNA level of P62 in RAW 264.7 cells transfected with PEX-2-Hes-1 plasmid or control vector for indicated time. (e, f) The data are shown as means±S.E.M.s and represent three independent experiments. *P<0.05, **P<0.01, determined by t-tests
Figure 6
Figure 6
Autophagic death of macrophage is re-verified in TLR7 agonist-induced lupus mouse model. TLR7 agonist-induced lupus mouse model was established by treating wild-type C57BL/6 mice with imiquimod for 10 weeks. (a) The percentage of F4/80+ macrophages among total splenic cells in IMQ-treated mice (n=8) and control mice (n=9) was determined by flow cytometry analysis. (b) Expression levels of macrophage activation markers (CD80, CD86 and MHCII) in splenic macrophages from IMQ-treated mice (n=8) and control mice (n=9). (c) The proportion of F4/80+ Annexin V+ macrophages among total splenic cells in IMQ-treated mice (n=8) and control mice (n=9). (d, g, i, j) Flow cytometry analysis of the levels of LC3IIB (d), P62 (g), Notch1 (i) and Hes-1 (j) in splenic macrophages from IMQ-treated mice (n=8) and control mice (n=9). Representative histograms showed the MFI of detected proteins were all on the right of stastical charts. (e, h) BMDM cells were generated from the bone marrow of IMQ-treated mice (n=5) and control mice (n=5). The protein levels of LC3II (e) and P62 (h) were assessed by western blot and normalized to GAPDH. (f) The correlation analysis between percentage of F4/80+ Annexin V+ splenic macrophages and MFI of LC3II in splenic macrophages from IMQ-treated mice. And the correlation results were determined by linear regression analysis. (a, c, d, g, i, j) The data are shown as means±S.E.M.s and represent two independent experiments. **P<0.01, ***P<0.001, determined by t-tests

Similar articles

Cited by

References

    1. Yu C, Gershwin ME, Chang C. Diagnostic criteria for systemic lupus erythematosus: a critical review. J Autoimmun 2014; 48-49: 10–13. - PubMed
    1. Orme J, Mohan C. Macrophage subpopulations in systemic lupus erythematosus. Discov Med 2012; 13: 151–158. - PubMed
    1. Chalmers SA, Chitu V, Ramanujam M, Putterman C. Therapeutic targeting of macrophages in lupus nephritis. Discov Med 2015; 20: 43–49. - PubMed
    1. Burbano C, Vasquez G, Rojas M. Modulatory effects of CD14+CD16++ monocytes on CD14++CD16- monocytes: a possible explanation of monocyte alterations in systemic lupus erythematosus. Arthritis Rheumatol 2014; 66: 3371–3381. - PubMed
    1. Carlucci F, Ishaque A, Ling GS, Szajna M, Sandison A, Donatien P et al. C1q modulates the response to TLR7 stimulation by pristane-primed macrophages: implications for pristane-induced lupus. J Immunol 2016; 196: 1488–1494. - PMC - PubMed

Publication types