. 2016 Aug 16;14(8):154.
doi: 10.3390/md14080154.

Tumor Protein (TP)-p53 Members as Regulators of Autophagy in Tumor Cells upon Marine Drug Exposure

Affiliations

Tumor Protein (TP)-p53 Members as Regulators of Autophagy in Tumor Cells upon Marine Drug Exposure

Edward A Ratovitski. Mar Drugs. .

Abstract

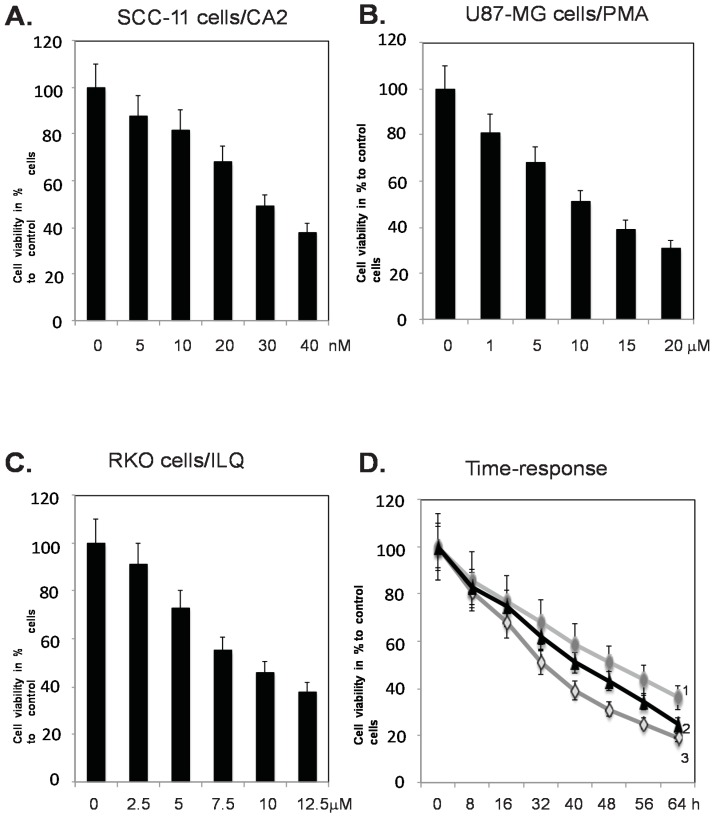
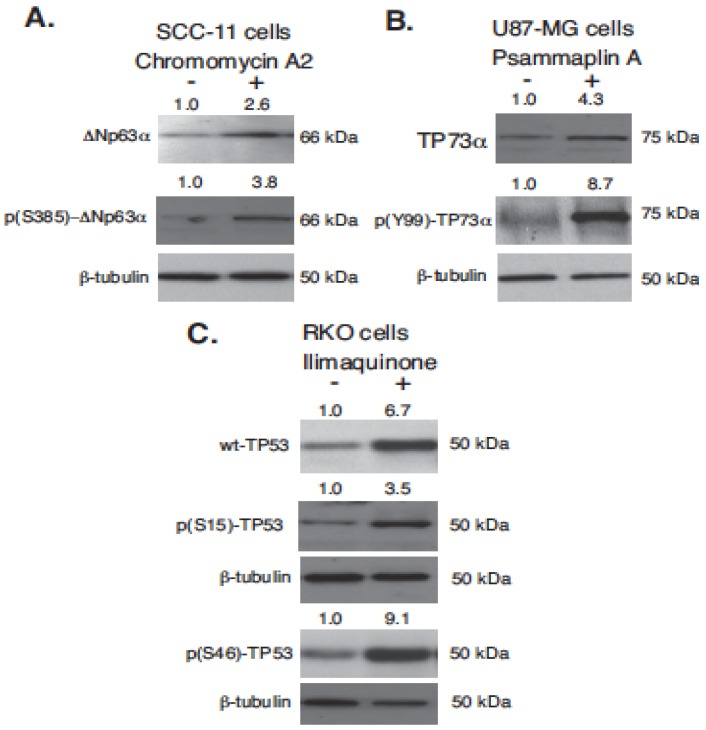
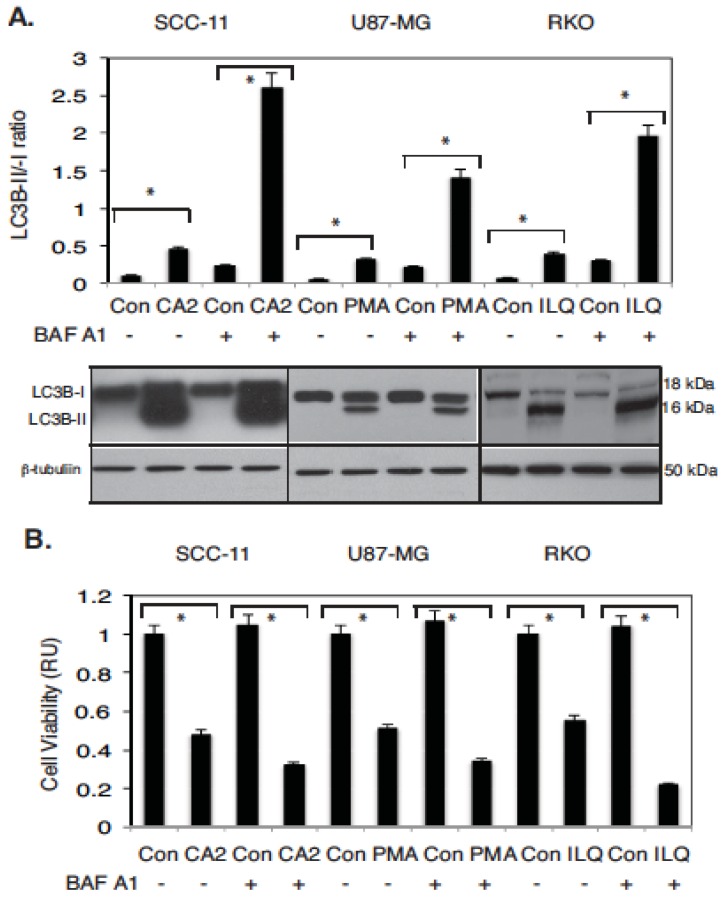
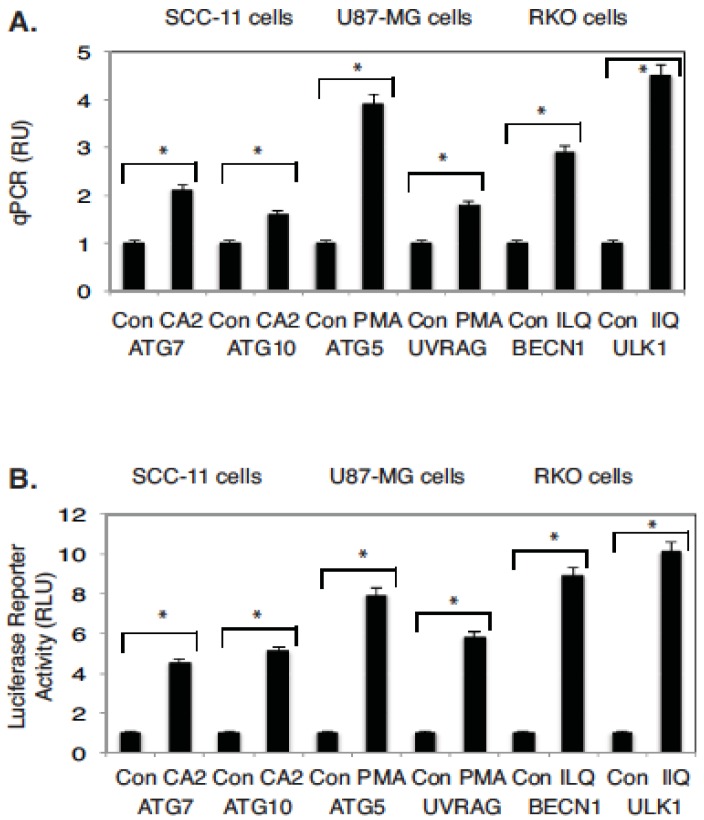
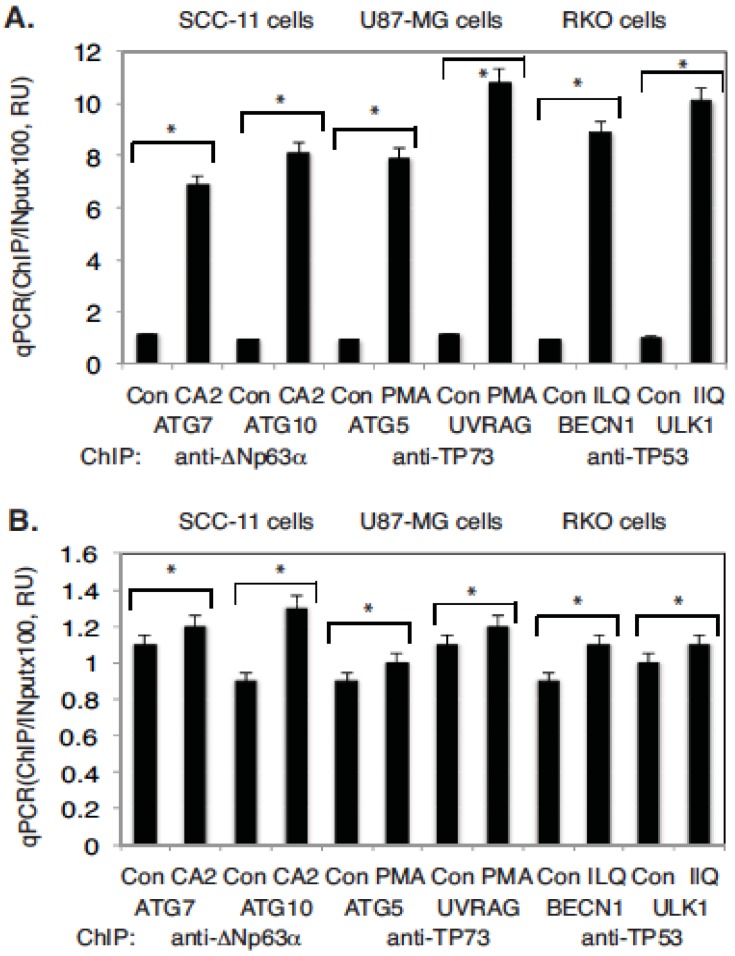
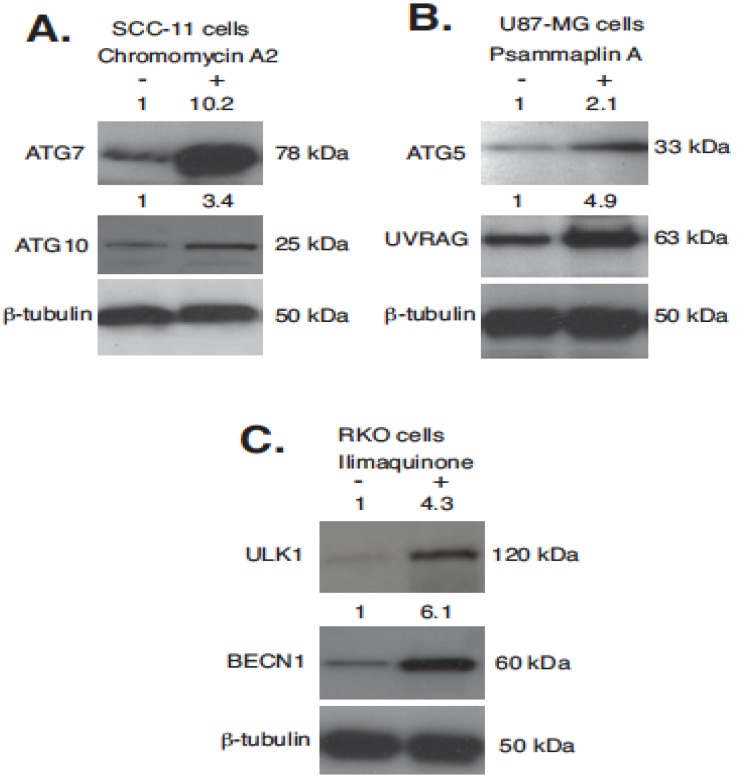
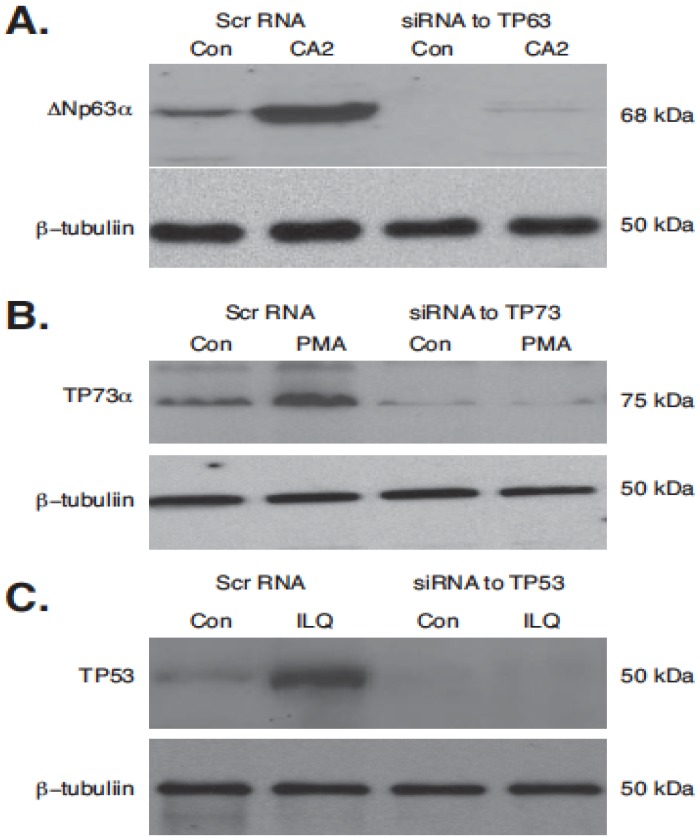
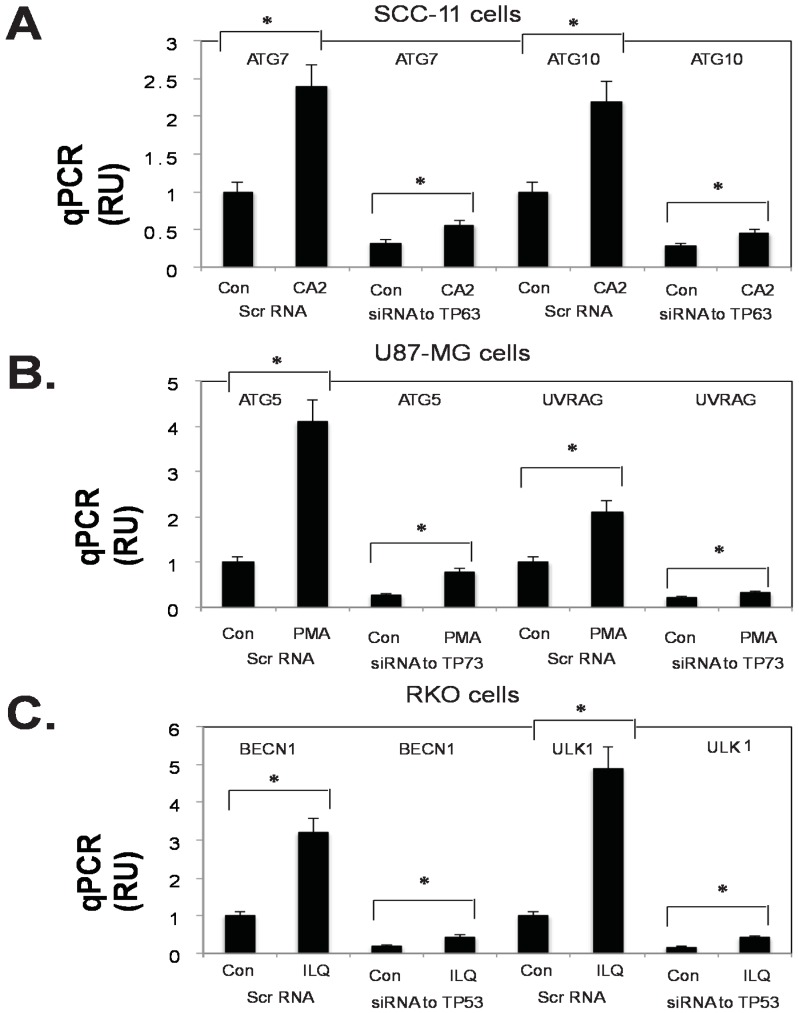
Targeting autophagic pathways might play a critical role in designing novel chemotherapeutic approaches in the treatment of human cancers, and the prevention of tumor-derived chemoresistance. Marine compounds were found to decrease tumor cell growth in vitro and in vivo. Some of them were shown to induce autophagic flux in tumor cells. In this study, we observed that the selected marine life-derived compounds (Chromomycin A2, Psammaplin A, and Ilimaquinone) induce expression of several autophagic signaling intermediates in human squamous cell carcinoma, glioblastoma, and colorectal carcinoma cells in vitro through a transcriptional regulation by tumor protein (TP)-p53 family members. These conclusions were supported by specific qPCR expression analysis, luciferase reporter promoter assay, and chromatin immunoprecipitation of promoter sequences bound to the TP53 family proteins, and silencing of the TP53 members in tumor cells.

Keywords: autophagy; cancer; marine drugs; p53 family members; transcription.


Figures

Figure 1
Figure 1
Selected marine drugs decrease tumor cell viability in dose- and time-dependent manner. Tumor cells (SCC-11, panel A, U87-MG, panel B, and RKO, panel C) were treated with control media and chromomycin A2 (CA2), psammaplin A (PMA), and ilimaquinome (ILQ), respectively in a dose-dependent manner for 24 h, as indicated. Tumor cell viability is shown as a percentage of viable cells after drug treatment compared to control media treatment. In panel D, tumor cells (SCC-11, designated as 1, U87-MG, designated as 2, and RKO, designated as 3) are treated with control media and CA2 (30 nM), PMA (7.5 µM), and ILQ (10 µM) for the indicated time periods.
Figure 2
Figure 2
Selected marine drug activated p53 family members in human tumor cells. Tumor cells (SCC-11, M87-MG, and RKO) were treated with control media (−) and chromomycin A2 (+, 30 nM, panel A), psammaplin A (+, 7.5 µM, panel B) and ilimaquinone (+, 10 µM, panel C) for 16 h. Total protein lysates were analyzed by immunoblotting with indicated antibodies against ΔNp63α TAp73α and wild type (wt)-TP53, as well as against p(S385)-ΔNp63α, p(Y99)-TP73, p(S15)-TP53, and p(S46)-TP53. Level of β-tubulin served as a loading control.
Figure 3
Figure 3
Selected marine drugs induced autophagic flux and inhibit cell viability in tumor cells. Tested tumor cells were treated with control media (Con), or chromomycin A2 (CA2, 30 nM), psammaplin A (PMA, 7.5 µM) and ilimaquinone (ILQ, 10 µM) for 48 h. Additionally, the 100 nM of bafilomycin A1 (BAF A1, #B1793, Sigma) was added to cells for 12 h, as indicated by (+). (A) Protein levels for LC3B-I, -II, normalized by the β-tubulin level (loading control) were examined using immunoblotting (representative immunoblots shown). Immunoblots were scanned using PhosphorImager (Molecular Dynamics) and quantified by ImageQuant software version 3.3 (Molecular Dynamics). Values of LC3B-II were expressed as a portion of LC3B-I values defined as 1. The LC3B-II/LC3B-I ratios were plotted as bars using the Microsoft Excel software with standard deviations (± SD) resulting from three independent experiments and three individual measurements of each experiment (* p < 0.05, t-test); (B) Cell viability assay. 104 cells/well in 96-well plates were incubated in serum-free medium with 5 μg/mL of 3-(4,5-dimethyl thiazol-2-yl)-2,5-diphenyl tetrazolium bromide (American Tissue Culture Collection) in the dark for 4 h at 37 °C. Cells were lysed and incubated for 2 h at 37 °C, and the measurements (A570nm to A650nm) were obtained on a Spectra Max-250 plate reader (Molecular Devices), as described in reference 44. Each assay was repeated three times in triplicate. Diagrams indicated the extent of cell viability expressed as a portion of the control represented as 1. Bars are the mean ± SD of triplicate (* p < 0.05, t-test).
Figure 4
Figure 4
Expression of autophagic genes (ATG7, ATG10, ATG5, UVRAG, BECN1, and ULK1) in tumor cells treated with marine drugs. (A) Expression of indicated autophagic genes (ATG7, ATG10, ATG5, UVRAG, BECN1, and ULK1) in tumor cells upon exposure to marine drugs. QPCR analysis of gene targets in SCC-11 cells, U87-MG cells, and RKO cells. Three independent qPCR assays were performed in triplicate (± SD are indicated. * p < 0.05); (B) Luciferase reporter assay of target gene promoters (ATG7, ATG10, ATG5, UVRAG, BECN1, and ULK1). Tested cells were transfected for 24 h with 100 ng of the LightSwitch_Pro reporter plasmids containing the indicated autophagic promoters or with 100 ng of the control promoter-less reporter plasmid. Cells were exposed to control medium (Con) or medium with chromomycin A2 (CA2, 30 nM), psammaplin A (PMA, 7.5 µM), and ilimaquinone (ILQ, 10 µM) for 12 h. RenSP Renilla luciferase reporter activity assays were conducted using three independent biological experiments in triplicate (± SD are indicated. * p < 0.05). Data is presented as relative to the data obtained from the control untreated cells containing the promoter-less reporter plasmid designated as 1.
Figure 5
Figure 5
TP53 family members bound to the tested autophagic gene promoters upon exposure to the indicated marine drugs. Tumor cells were exposed to control medium (Con) or medium with chromomycin A2 (CA2, 30 nM), psammaplin A (PMA, 7.5 µM), and ilimaquinone (ILQ, 10 µM) for 12 h. Chromatin imunoprecipitation (ChIP) of the TP53, TP63, and TP73 (using indicated antibodies) bound to the specific regions (A) and nonspecific regions (B) of the indicated autophagic gene promoter sequences. Quantitative real-time qPCR experiments were performed in triplicate with ±SD as indicated (* p < 0.05). The amount of immunoprecipitated-enriched DNA in each sample (ChIP) is represented as a signal relative to the total amount of input chromatin DNA (Input) using the same primers multiplied by 100. Assays were performed using three independent biological experiments in triplicate.
Figure 6
Figure 6
Expression of autophagic proteins (ATG7, ATG10, ATG5, UVRAG, BECN1, and ULK1) in human tumor cells upon exposure to indicated marine drugs. Tested tumor cells were exposed to control medium (−) or medium with chromomycin A2 (+, 30 nM, panel A), psammaplin A (+, 7.5 µM, panel B), or ilimaquinone (+, 10 µM, panel C) for 16 h. Total protein lysates were analyzed by immunoblotting with indicated antibodies against ATG7, ATG10, ATG5, UVRAG, ULK1, and BECN1. Level of β-tubulin served as a loading control.
Figure 7
Figure 7
Silencing of TP53 family members by siRNA upon exposure of tumor cells selected marine drugs. Tumor cells (SCC-11 in panel A; U87-MG in panel B; and RKO I panel C) were transfected with the scrambled siRNA (Scr RNA) and siRNA against TP63 (panel A), TP73 (panel B), and TP53 (panel C) for 48 h, and were subsequently treated with control media (Con) and indicated marine drugs (CA2, 30 nM, PMA, 7.5 µM, and ILQ, 10 µM) for an additional 16 h. Expression of TP53 family members was examined by immunoblotting with indicated antibodies. Level of β-tubulin served as a loading control.
Figure 8
Figure 8
Silencing of TP53 family members by siRNA modulate the transcription of tested autophagic genes (ATG7, ATG10, ATG5, UVRAG, BECN1, and ULK1) in tumor cells treated with selected marine drugs. Tumor cells (SCC-11 in panel A; U87-MG in panel B; and RKO I panel C) were transfected with the scrambled siRNA (Scr RNA) and siRNA against TP63 (panel A), TP73 (panel B), and TP53 (panel C) for 48 h, and were subsequently treated with control media (Con) and the indicated marine drugs (CA2, 30 nM, PMA, 7.5 µM, and ILQ, 10 µM) for an additional 16 h. QPCR analysis of gene targets in SCC-11 cells, U87-MG cells, and RKO cells. Three independent qPCR assays were performed in triplicate (± SD are indicated. * p < 0.05).

Similar articles

Cited by

References

    1. Liu J., Debnath J. The Evolving, Multifaceted Roles of Autophagy in Cancer. Adv. Cancer Res. 2016;130:1–53. doi: 10.1016/bs.acr.2016.01.005. - DOI - PubMed
    1. Cosway B., Lovat P. The role of autophagy in squamous cell carcinoma of the head and neck. Oral Oncol. 2016;54:1–6. doi: 10.1016/j.oraloncology.2015.12.007. - DOI - PubMed
    1. Roos W.P., Thomas A.D., Kaina B. DNA damage and the balance between survival and death in cancer biology. Nat. Rev. Cancer. 2016;16:20–33. doi: 10.1038/nrc.2015.2. - DOI - PubMed
    1. Chen S., Rehman S.K., Zhang W., Wen A., Yao L., Zhang J. Autophagy is a therapeutic target in anticancer drug resistance. Biochim. Biophys. Acta. 2010;1806:220–229. doi: 10.1016/j.bbcan.2010.07.003. - DOI - PubMed
    1. Belaid A., Ndiaye P.D., Filippakis H., Roux J., Röttinger É., Graba Y., Brest P., Hofman P., Mograbi B. Autophagy: Moving Benchside Promises to Patient Bedsides. Curr. Cancer Drug Targets. 2015;15:684–702. doi: 10.2174/156800961508151001102452. - DOI - PubMed

MeSH terms

LinkOut - more resources