Multicenter Study
. 2016 Aug 19:7:12158.
doi: 10.1038/ncomms12158.

Dynamic clonal equilibrium and predetermined cancer risk in Barrett's oesophagus

Affiliations
Multicenter Study

Dynamic clonal equilibrium and predetermined cancer risk in Barrett's oesophagus

Pierre Martinez et al. Nat Commun. .

Abstract

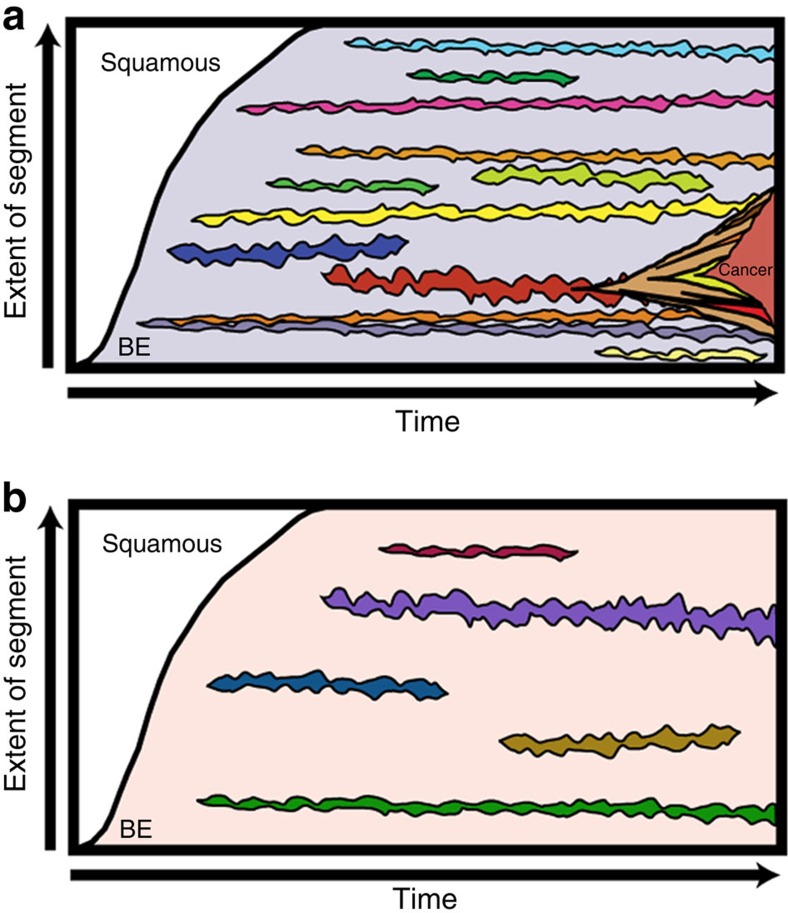
Surveillance of Barrett's oesophagus allows us to study the evolutionary dynamics of a human neoplasm over time. Here we use multicolour fluorescence in situ hybridization on brush cytology specimens, from two time points with a median interval of 37 months in 195 non-dysplastic Barrett's patients, and a third time point in a subset of 90 patients at a median interval of 36 months, to study clonal evolution at single-cell resolution. Baseline genetic diversity predicts progression and remains in a stable dynamic equilibrium over time. Clonal expansions are rare, being detected once every 36.8 patient years, and growing at an average rate of 1.58 cm(2) (95% CI: 0.09-4.06) per year, often involving the p16 locus. This suggests a lack of strong clonal selection in Barrett's and that the malignant potential of 'benign' Barrett's lesions is predetermined, with important implications for surveillance programs.


Conflict of interest statement

Dr Krishnadath has a patent 10999US01 issued: US/23.09.11/USP201161538291, Materials and methods for prognosis of progression of Barrett's oesophagus. The remaining authors declare no conflict of interests.

Figures

Figure 1
Figure 1. Patient properties.
(a) Genotypes encountered in more than 0.5% of all scored. (b) Per cell per patient distributions of p16 loss, p53 loss and p53 LOH. (c) Distribution of the number of different genotypes per patient. (d) Distribution of Shannon diversity indices per patient. (e) Distribution of Shannon diversity indices for whole-set and single-probe measures, colour-coded per probe set (red for set 1, blue for set 2, purple for both). For each violin plot, white marks define the median of each distribution, black rectangles delimit the second and third quartiles and vertical lines indicate the 95% confidence intervals while coloured shapes show the kernel density.
Figure 2
Figure 2. Genetic evolution of Barrett's oesophagus between endoscopic brushes.
(a) Number of disappearing and appearing clones in both probe sets between time points (brushes). White marks define the median of each distribution, black rectangles delimit the second and third quartiles and vertical lines indicate the 95% confidence intervals while coloured shapes show the kernel density. Thick black lines indicate the middle quartiles and white dots highlight the medians. (b,c) Linear models of genetic diversity fitted to the time between time points. Blue dots: non-progressors; red dots: patients progressing after second time point; green dots: patients progressing before second time point.
Figure 3
Figure 3. Clonal contractions and expansions.
(a) Growth rate as the decrease/increase of each significant clonal expansion in percentage of the total cell population per month. (b) Growth rate as the decrease/increase of each significant clonal expansion in cm2 per year. Dashes are individual measurements; red lines annotated with a number represent the mean. (c) Evolution of p16 loss and gain frequencies over time. The increase and decrease in frequency for both p16 loss (blue) and p16 gain (red) is recorded at every second time point for all samples with multiple brushes to generate cumulative curves.
Figure 4
Figure 4. Examples of Kaplan–Meier curves for genetic diversity-based patient stratification.
Coloured lines indicate the proportion of patients progressing to cancer and vertical bars indicate right censoring (end of follow-up data). (a) Stratification based on the number of clones per cell in the first probe set. (b) Stratification based on the number of clones per cell in the second probe set.
Figure 5
Figure 5. Updated evolutionary model of Barrett's oesophagus.
Clones can appear without leading to major clonal sweeps in the population, eventually dying out or leading to cancer progression. (a) Sample with stable high genetic diversity. (b) Sample with stable low genetic diversity.

References

    1. Nowell P. C. The clonal evolution of tumor cell populations. Science 194, 23–28 (1976). - PubMed
    1. Greaves M. & Maley C. C. Clonal evolution in cancer. Nature 481, 306–313 (2012). - PMC - PubMed
    1. Reid B. J., Li X., Galipeau P. C. & Vaughan T. L. Barrett's oesophagus and oesophageal adenocarcinoma: time for a new synthesis. Nat. Rev. Cancer 10, 87–101 (2010). - PMC - PubMed
    1. Weaver J. M. J. et al. Ordering of mutations in preinvasive disease stages of esophageal carcinogenesis. Nat. Genet. 46, 837–843 (2014). - PMC - PubMed
    1. Dulak A. M. et al. Exome and whole-genome sequencing of esophageal adenocarcinoma identifies recurrent driver events and mutational complexity. Nat. Genet. 45, 478–486 (2013). - PMC - PubMed

Publication types

MeSH terms