

Distinctive Leukocyte Subpopulations According to Organ Type in Cynomolgus Macaques
- PMID: 27538862
- PMCID: PMC4983173
Distinctive Leukocyte Subpopulations According to Organ Type in Cynomolgus Macaques
Abstract
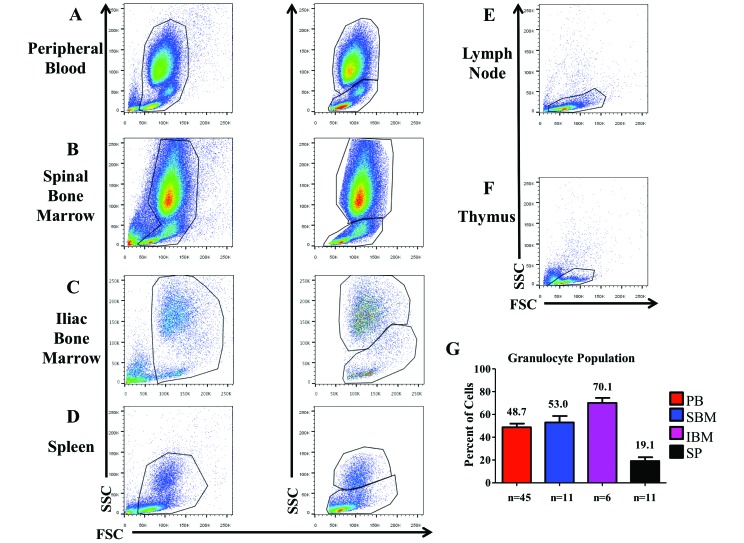
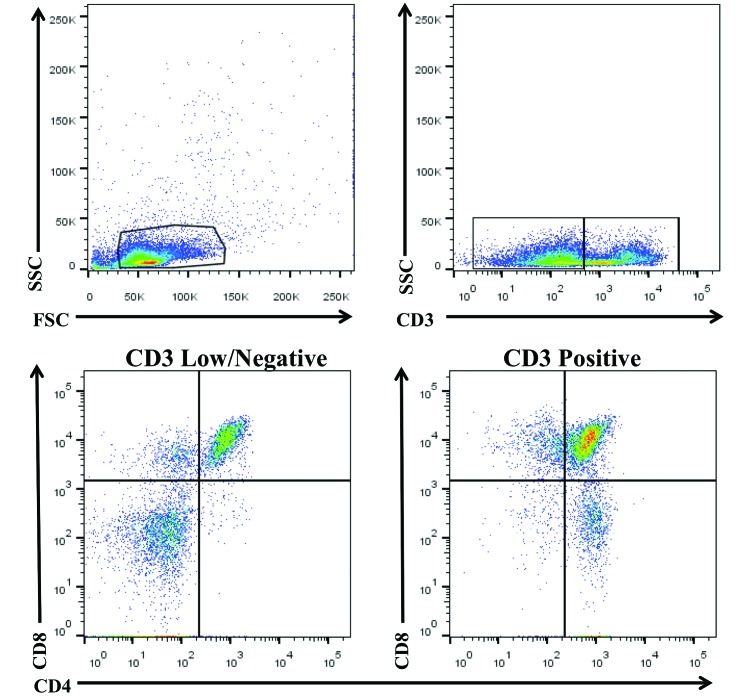
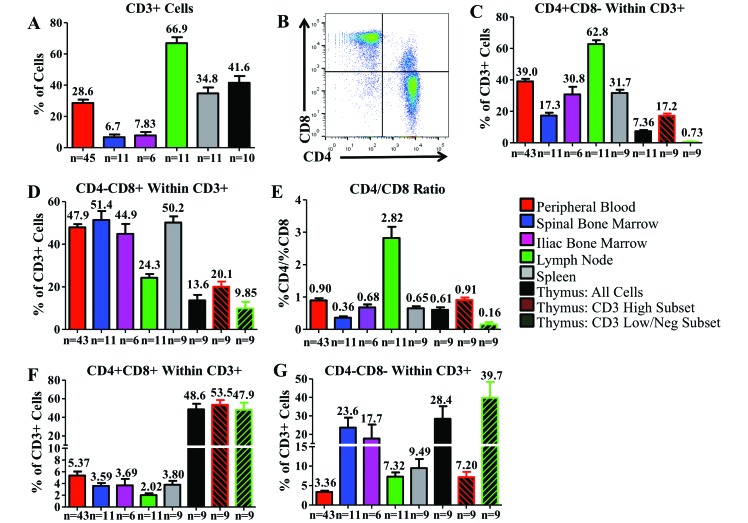
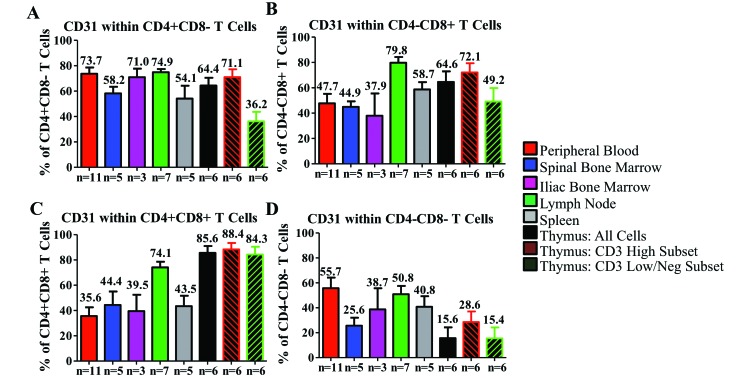
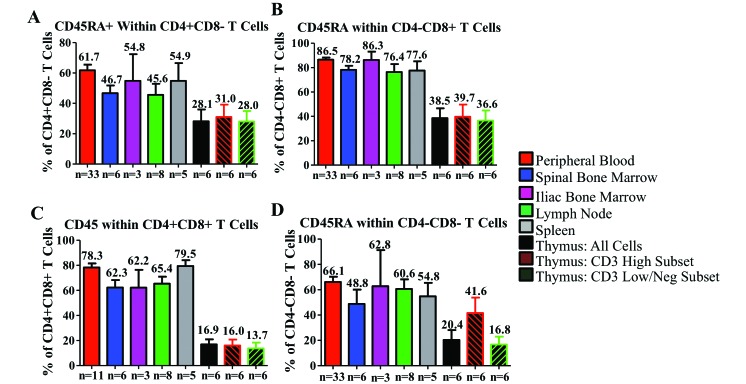
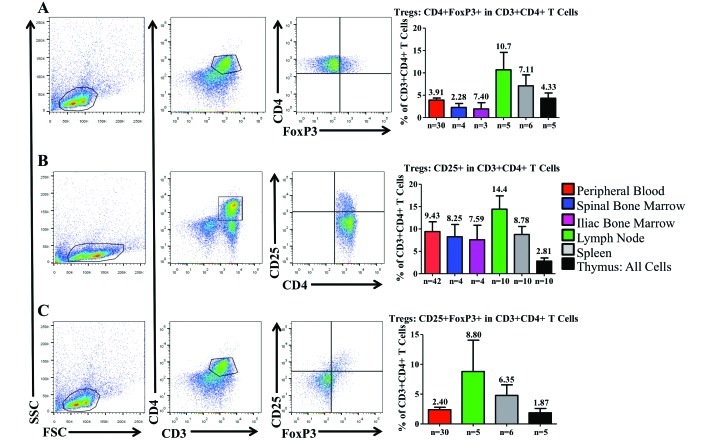
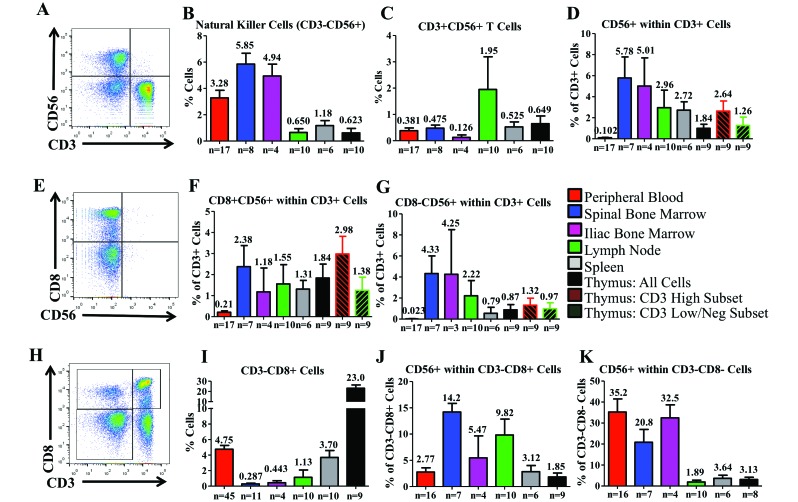
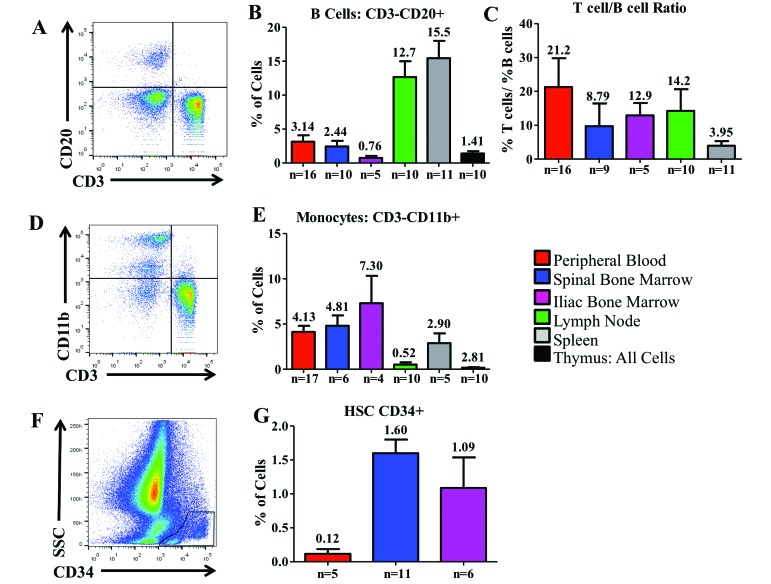
Cynomolgus macaques (CYNO; Macaca fascicularis) are a well-established NHP model used for studies in immunology. To provide reference values on the baseline cell distributions in the hematopoietic and lymphoid organs (HLO) of these animals, we used flow cytometry to analyze the peripheral blood, bone marrow, mesenteric lymph nodes, spleen, and thymus of a cohort of male, adult, research-naïve, Mauritian CYNO. Our findings demonstrate that several cell distribution patterns differ between CYNO and humans. First, the CD4(+):CD8(+) T-cell ratio is lower in CYNO compared with humans. Second, the peripheral blood of CYNO contains a population of CD4(+)CD8(+) T cells. Third, the CD31 level was elevated in all organs studied, suggesting that CD31 may not be an accurate marker of recent thymic emigrants within the CD4(+) T cells of CYNO. Finally the B-cell population is lower in CYNO compared with humans. In summary, although the majority of immune cell populations are similar between cynomolgus macaques and humans, several important differences should be considered when using CYNO in immunologic studies. Our current findings provide valuable information to not only researchers but also veterinarians working with CYNO at research centers, in zoos, or in the wild.
Figures
Similar articles
-
B-cell subsets in blood and lymphoid organs in Macaca fascicularis.Cytometry A. 2004 Sep;61(1):69-75. doi: 10.1002/cyto.a.20039. Cytometry A. 2004. PMID: 15351991
-
Cyno-EBV (EBV-related herpesvirus from cynomolgus macaques) induces rabbit malignant lymphomas and their tumor cell lines frequently show specific chromosomal abnormalities.Lab Invest. 1999 Jul;79(7):823-35. Lab Invest. 1999. PMID: 10418823
-
Lymphoid organ development in rabbits: major lymphocyte subsets.Dev Comp Immunol. 2007;31(6):632-44. doi: 10.1016/j.dci.2006.10.002. Epub 2006 Nov 7. Dev Comp Immunol. 2007. PMID: 17126399
-
Cell surface marker evaluation of infant Macaca monkey leukocytes in peripheral whole blood using simultaneous dual-color immunophenotypic analysis.J Med Primatol. 1996 Apr;25(2):89-105. doi: 10.1111/j.1600-0684.1996.tb00200.x. J Med Primatol. 1996. PMID: 8864980
-
Flow cytometric characterization of lymphocyte subpopulations in the cynomolgus monkey (Macaca fascicularis).Vet Immunol Immunopathol. 1993 Jun;37(1):1-13. doi: 10.1016/0165-2427(93)90011-r. Vet Immunol Immunopathol. 1993. PMID: 7688169
Cited by
-
Differences in host immune populations between rhesus macaques and cynomolgus macaque subspecies in relation to susceptibility to Mycobacterium tuberculosis infection.Sci Rep. 2021 Apr 23;11(1):8810. doi: 10.1038/s41598-021-87872-x. Sci Rep. 2021. PMID: 33893359 Free PMC article.
-
Gamma-Tocotrienol Modulates Total-Body Irradiation-Induced Hematopoietic Injury in a Nonhuman Primate Model.Int J Mol Sci. 2022 Dec 18;23(24):16170. doi: 10.3390/ijms232416170. Int J Mol Sci. 2022. PMID: 36555814 Free PMC article.
-
Cellular Therapies for the Treatment of Hematological Malignancies; Swine Are an Ideal Preclinical Model.Front Oncol. 2019 Jun 21;9:418. doi: 10.3389/fonc.2019.00418. eCollection 2019. Front Oncol. 2019. PMID: 31293961 Free PMC article. Review.
-
Large Animal Models of Vascularized Composite Allotransplantation: A Review of Immune Strategies to Improve Allograft Outcomes.Front Immunol. 2021 Jun 30;12:664577. doi: 10.3389/fimmu.2021.664577. eCollection 2021. Front Immunol. 2021. PMID: 34276656 Free PMC article. Review.
-
Characterization, biology, and expansion of regulatory T cells in the Cynomolgus macaque for preclinical studies.Am J Transplant. 2019 Aug;19(8):2186-2198. doi: 10.1111/ajt.15313. Epub 2019 Mar 29. Am J Transplant. 2019. PMID: 30768842 Free PMC article.
References
-
- Akari H, Terao K, Murayama Y, Nam KH, Yoshikawa Y. 1997. Peripheral blood CD4+CD8+ lymphocytes in cynomolgus monkeys are of resting memory T lineage. Int Immunol 9:591–597. - PubMed
-
- Allan SE, Crome SQ, Crellin NK, Passerini L, Steiner TS, Bacchetta R, Roncarolo MG, Levings MK. 2007. Activation-induced FOXP3 in human T effector cells does not suppress proliferation or cytokine production. Int Immunol 19:345–354. - PubMed
-
- Baroncelli S, Panzini G, Geraci A, Pardini S, Corrias F, Iale E, Varano F, Turillazzi PG, Titti F, Verani P. 1997. Longitudinal characterization of CD4+CD8+ T-cell subsets and of haematological parameters in healthy newborns of cynomolgus monkeys. Vet Immunol Immunopathol 59:141–150. - PubMed
Publication types
MeSH terms
Substances
Grants and funding
LinkOut - more resources
Full Text Sources
Research Materials