

Intracranial Applications of MR Imaging-Guided Focused Ultrasound
- PMID: 27538905
- PMCID: PMC7960005
- DOI: 10.3174/ajnr.A4902
Intracranial Applications of MR Imaging-Guided Focused Ultrasound
Abstract
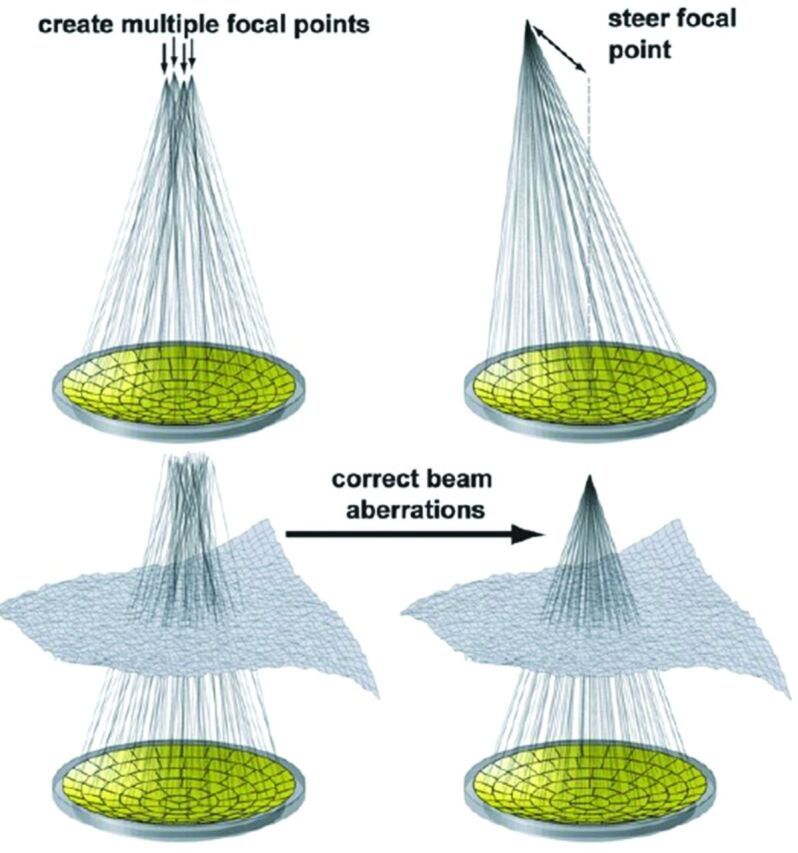
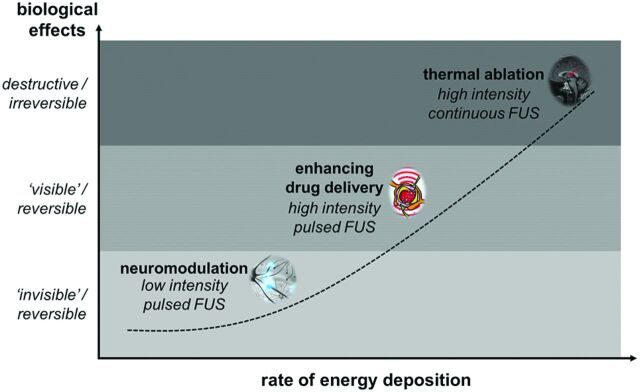
Initially used in the treatment of prostate cancer and uterine fibroids, the role of focused ultrasound has expanded as transcranial acoustic wave distortion and other limitations have been overcome. Its utility relies on focal energy deposition via acoustic wave propagation. The duty cycle and intensity of focused ultrasound influence the rate of energy deposition and result in unique physiologic and biomechanical effects. Thermal ablation via high-intensity continuous exposure generates coagulative necrosis of tissues. High-intensity, pulsed application reduces temporally averaged energy deposition, resulting in mechanical effects, including reversible, localized BBB disruption, which enhances neurotherapeutic agent delivery. While the precise mechanisms remain unclear, low-intensity, pulsed exposures can influence neuronal activity with preservation of cytoarchitecture. Its noninvasive nature, high-resolution, radiation-free features allow focused ultrasound to compare favorably with other modalities. We discuss the physical characteristics of focused ultrasound devices, the biophysical mechanisms at the tissue level, and current and emerging applications.
© 2017 by American Journal of Neuroradiology.
Figures
Similar articles
-
MR-guided focused ultrasound: a potentially disruptive technology.J Am Coll Radiol. 2009 Jul;6(7):510-3. doi: 10.1016/j.jacr.2009.01.004. J Am Coll Radiol. 2009. PMID: 19560068 Review.
-
Ultrasound focusing using magnetic resonance acoustic radiation force imaging: application to ultrasound transcranial therapy.Med Phys. 2010 Jun;37(6):2934-42. doi: 10.1118/1.3395553. Med Phys. 2010. PMID: 20632605
-
MR imaging-controlled focused ultrasound ablation: a noninvasive image-guided surgery.Magn Reson Imaging Clin N Am. 2005 Aug;13(3):545-60. doi: 10.1016/j.mric.2005.04.008. Magn Reson Imaging Clin N Am. 2005. PMID: 16084419 Review.
-
High-intensity focused ultrasound surgery of the brain: part 1--A historical perspective with modern applications.Neurosurgery. 2009 Feb;64(2):201-10; discussion 210-1. doi: 10.1227/01.NEU.0000336766.18197.8E. Neurosurgery. 2009. PMID: 19190451 Free PMC article. Review.
-
Intracranial inertial cavitation threshold and thermal ablation lesion creation using MRI-guided 220-kHz focused ultrasound surgery: preclinical investigation.J Neurosurg. 2015 Jan;122(1):152-61. doi: 10.3171/2014.9.JNS14541. J Neurosurg. 2015. PMID: 25380106
Cited by
-
Reversible neuroinhibition by focused ultrasound is mediated by a thermal mechanism.Brain Stimul. 2019 Nov-Dec;12(6):1439-1447. doi: 10.1016/j.brs.2019.07.015. Epub 2019 Jul 23. Brain Stimul. 2019. PMID: 31377096 Free PMC article.
-
Effect of high-intensity focused ultrasound ablation on endometriosis of the abdominal wall.Int J Clin Exp Pathol. 2018 Apr 1;11(4):2118-2124. eCollection 2018. Int J Clin Exp Pathol. 2018. PMID: 31938321 Free PMC article.
-
Technical Comparison of Treatment Efficiency of Magnetic Resonance-Guided Focused Ultrasound Thalamotomy and Pallidotomy in Skull Density Ratio-Matched Patient Cohorts.Front Neurol. 2022 Jan 21;12:808810. doi: 10.3389/fneur.2021.808810. eCollection 2021. Front Neurol. 2022. PMID: 35126300 Free PMC article.
-
Transcranial ultrasound stimulation applied in ischemic stroke rehabilitation: A review.Front Neurosci. 2022 Jul 22;16:964060. doi: 10.3389/fnins.2022.964060. eCollection 2022. Front Neurosci. 2022. PMID: 35937889 Free PMC article. Review.
-
Brain-focussed ultrasound: what's the "FUS" all about? A review of current and emerging neurological applications.Br J Radiol. 2018 Jul;91(1087):20170481. doi: 10.1259/bjr.20170481. Epub 2018 Mar 6. Br J Radiol. 2018. PMID: 29419328 Free PMC article. Review.
References
Publication types
MeSH terms
LinkOut - more resources
Full Text Sources
Other Literature Sources