. 2016 Oct 1;9(10):1193-1202.
doi: 10.1242/dmm.025999. Epub 2016 Aug 18.

Early applications of granulocyte colony-stimulating factor (G-CSF) can stabilize the blood-optic-nerve barrier and ameliorate inflammation in a rat model of anterior ischemic optic neuropathy (rAION)

Affiliations

Early applications of granulocyte colony-stimulating factor (G-CSF) can stabilize the blood-optic-nerve barrier and ameliorate inflammation in a rat model of anterior ischemic optic neuropathy (rAION)

Yao-Tseng Wen et al. Dis Model Mech. .

Abstract

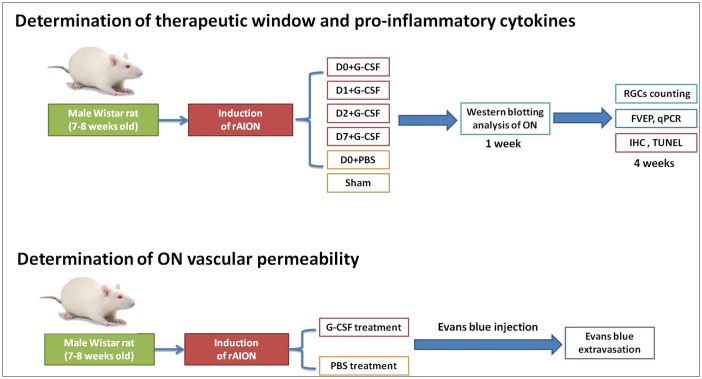
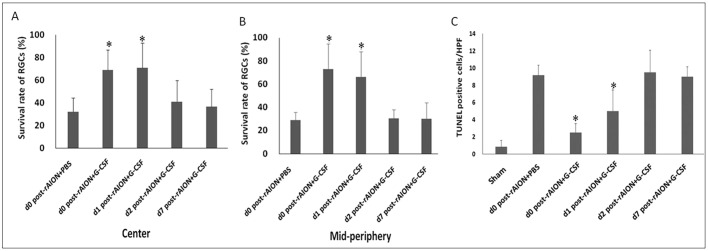
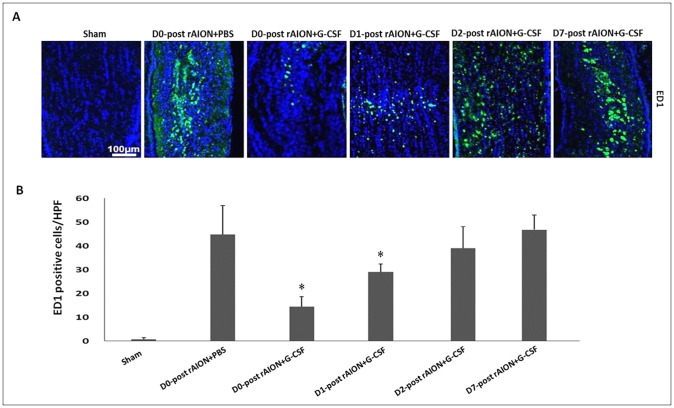
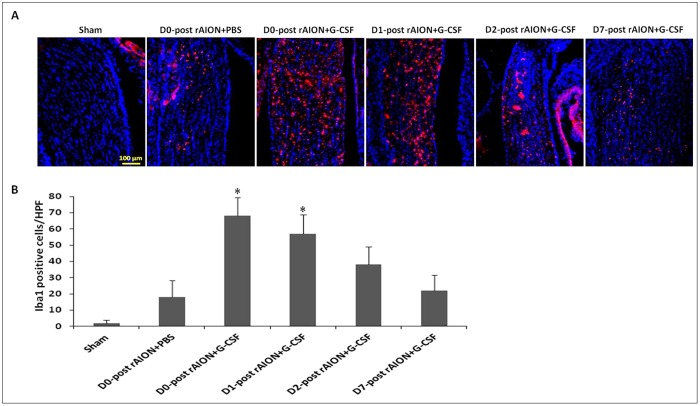
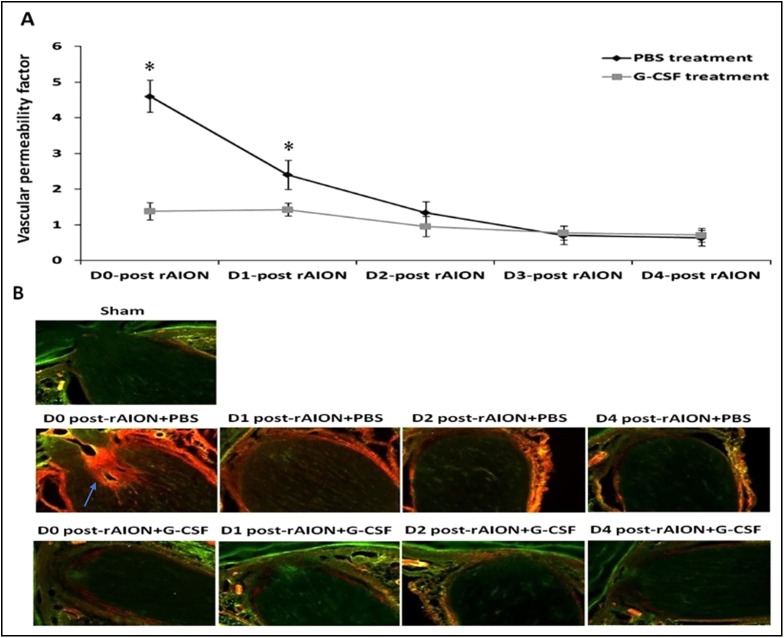
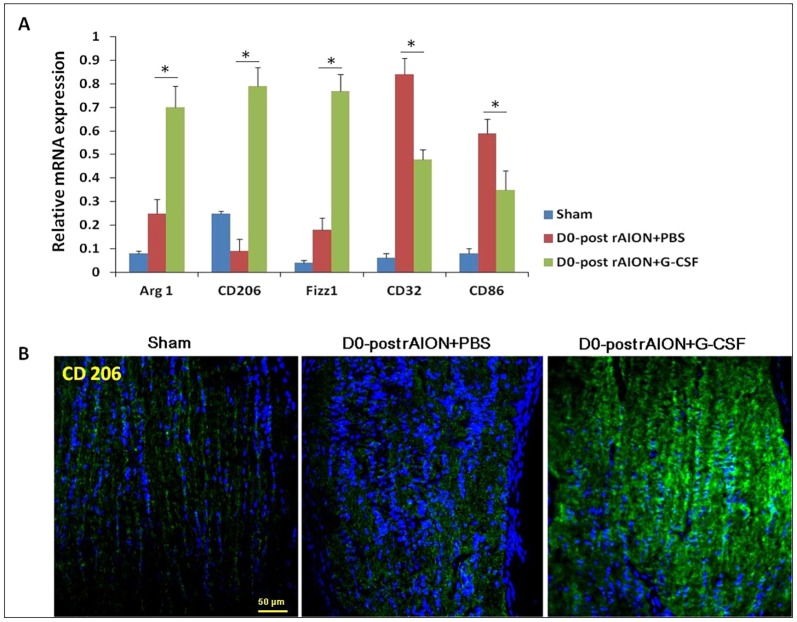
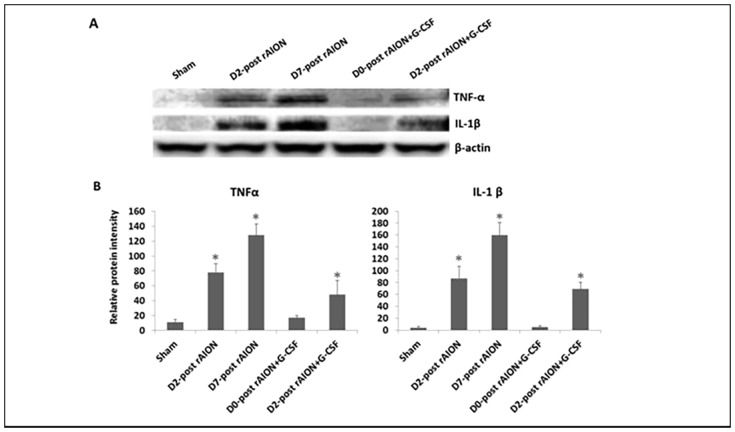
Granulocyte colony-stimulating factor (G-CSF) was reported to have a neuroprotective effect in a rat model of anterior ischemic optic neuropathy (rAION model). However, the therapeutic window and anti-inflammatory effects of G-CSF in a rAION model have yet to be elucidated. Thus, this study aimed to determine the therapeutic window of G-CSF and investigate the mechanisms of G-CSF via regulation of optic nerve (ON) inflammation in a rAION model. Rats were treated with G-CSF on day 0, 1, 2 or 7 post-rAION induction for 5 consecutive days, and a control group were treated with phosphate-buffered saline (PBS). Visual function was assessed by flash visual evoked potentials at 4 weeks post-rAION induction. The survival rate and apoptosis of retinal ganglion cells were determined by FluoroGold labeling and TUNEL assay, respectively. ON inflammation was evaluated by staining of ED1 and Iba1, and ON vascular permeability was determined by Evans Blue extravasation. The type of macrophage polarization was evaluated using quantitative real-time PCR (qRT-PCR). The protein levels of TNF-α and IL-1β were analyzed by western blotting. A therapeutic window during which G-CSF could rescue visual function and retinal ganglion cell survival was demonstrated at day 0 and day 1 post-infarct. Macrophage infiltration was reduced by 3.1- and 1.6-fold by G-CSF treatment starting on day 0 and 1 post-rAION induction, respectively, compared with the PBS-treated group (P<0.05). This was compatible with 3.3- and 1.7-fold reductions in ON vascular permeability after G-CSF treatment compared with PBS treatment (P<0.05). Microglial activation was increased by 3.8- and 3.2-fold in the early (beginning treatment at day 0 or 1) G-CSF-treated group compared with the PBS-treated group (P<0.05). Immediate (within 30 mins of infarct) treatment with G-CSF also induced M2 microglia/macrophage activation. The cytokine levels were lower in the group that received immediate G-CSF treatment compared to those in the later G-CSF treatment group (P<0.05). Early treatment with G-CSF stabilized the blood-ON barrier to reduce macrophage infiltration and induced M2 microglia/macrophage polarization to decrease the expressions of pro-inflammatory cytokines in this rAION model.

Keywords: Blood–optic-nerve barrier; Granulocyte colony-stimulating factor (G-CSF); Macrophage infiltration; Microglia/macrophage polarization; Rat anterior ischemic optic neuropathy (rAION).


Conflict of interest statement

The authors declare no competing or financial interests.

Figures

Fig. 1.
Fig. 1.
Illustration of the study design to investigate the therapeutic window of G-CSF treatment and the role of G-CSF in regulating optic nerve (ON) inflammation in a rAION model. G-CSF, granulocyte colony-stimulating factor; RGCs, retinal ganglion cells; FVEP, flash visual evoked potentials; qPCR, quantitative polymerase chain reaction; IHC, immunohistochemistry; TUNEL, in situ nick end-labeling.
Fig. 2.
Fig. 2.
Evaluation of the recovery of injured optic nerves (ONs) by FVEPs in the rAION model. Representative FVEP tracings at 4 weeks following rAION induction in (A) sham, (B) D0+PBS, (C) D0+G-CSF, (D) D1+G-CSF, (E) D2+G-CSF and (F) D7+G-CSF groups. (G) Bar charts showing P1-N2 amplitude. Data are expressed as mean±s.d. in each group (n=6 in each group). The amplitude of the P1-N2 waves in the D0+G-CSF-treated group and D1+G-CSF-treated group were significantly higher than that of the PBS-treated group [27.9±11.9 μV (P=0.005) and 16.9±4.4 μV (P=0.013) vs 8.1±4.3 μV, respectively]. *P<0.05 compared with D0 PBS treatment by the Mann–Whitney U-test.
Fig. 3.
Fig. 3.
Survival rate of RGCs and apoptotic RGCs in rAION-induced rats with PBS treatment and G-CSF treatment on day 0, 1, 2 or 7 post-rAION induction. (A) The RGC survival rates of central retinas and (B) mid-peripheral retinas in each group were calculated as a percentage of the RGC density in the sham group. (C) Quantification of TUNEL-positive cells per high-power field (HPF). Data are expressed as mean±s.d. in each group (n=6). In the central retinas, the survival rates of the RGCs in the D0+G-CSF-treated group and D1+G-CSF-treated group were both 2.2-fold higher than that of the PBS-treated group (P=0.013 and P=0.020, respectively). In mid-peripheral retinas, the RGC survival rates in the D0+G-CSF-treated group and D1+G-CSF-treated group were 2.5-fold (P=0.005) and 2.3-fold (P=0.005) higher compared to the PBS-treated group. The numbers of TUNEL-positive cells/HPF in the D0+G-CSF-treated group and D1+G-CSF-treated group were 3.7- and 2.0-fold lower than that of the PBS-treated group, respectively (P=0.005, P=0.013). *P<0.05 compared with D0 PBS treatment by the Mann–Whitney U-test.
Fig. 4.
Fig. 4.
Immunohistochemistry of ED1 in optic nerves (ONs) at 4 weeks after rAION induction to evaluate macrophage infiltration. (A) The representative figures show anti-ED1 staining in longitudinal sections of ONs. The ED1-positive cells in green were labeled with FITC, and the nuclei in blue were stained with DAPI. (B) Quantification of ED1-positive cells per high-power field (HPF). Data are expressed as mean±s.d. in each group (n=6 in each group). The level of extrinsic macrophage infiltration was reduced by 3.1- and 1.6-fold by G-CSF treatment starting on day 0 and day 1 post-rAION induction, respectively, compared to PBS treatment (P=0.005, P=0.013). *P<0.05 compared with D0 PBS treatment by the Mann–Whitney U-test.
Fig. 5.
Fig. 5.
Immunohistochemistry of Iba1 in optic nerves (ONs) at 4 weeks after rAION induction to evaluate microglial activation. (A) The representative figures show anti-Iba1 staining in longitudinal sections of ONs. The Iba1-positive cells in red were labeled with Rhodamine, and the nuclei in blue were stained with DAPI. (B) Quantification of Iba1-positive cells per high-power field (HPF). Data are expressed as mean±s.d. in each group (n=6 in each group). The levels of intrinsic microglia activation were increased by 3.8- and 3.2-fold by G-CSF treatment starting on day 0 and 1 post-rAION induction compared to PBS treatment (P=0.005, P=0.005). *P<0.05 compared with D0 PBS treatment by the Mann–Whitney U-test.
Fig. 6.
Fig. 6.
Optic nerve (ON) vascular leakage in the PBS-treated rats and the G-CSF-treated rats. (A) Evans-Blue-based quantification of ON vascular permeability. G-CSF treatment starting on day 0 and day 1 post-rAION induction reduced ON vascular permeability by 3.3- and 1.7-fold compared to PBS treatment (P<0.05). Data are expressed as mean±s.d. in each group (n=6 in each group). *P<0.05 by the Mann–Whitney U-test. (B) Evans Blue fluorescence image of ON sections. The Evans-Blue-stained ON tissue emitted orange red fluorescence (blue arrow) and the unstained ON tissue emitted green auto-fluorescence. G-CSF treatment starting on day 0 and day 1 post-rAION induction reduced Evans Blue leakage in the ON sections compared with PBS treatment.
Fig. 7.
Fig. 7.
Relative mRNA expression levels of markers of M1 and M2 macrophages in the optic nerves (ONs) are shown as histograms. (A) Each value was normalized to GypA. Statistical analysis indicated that the expressions of Arg1, CD206 and Fizz1 (markers of M2 macrophages) increased after immediate treatment with G-CSF compared to treatment with PBS (P<0.05). CD32 and CD86 (markers of M1 macrophages) decreased after immediate treatment with G-CSF compared to treatment with PBS (P<0.05). *P<0.05 by the Mann–Whitney U-test. (B) Representative CD206 IHC stainings of ONs. Note that CD206-positive cells increased in the ON of D0 post-rAION+G-CSF rats as compared with that of sham and PBS-treated rats.
Fig. 8.
Fig. 8.
The expressions of TNF-α and IL-1β in the optic nerve (ON) tissues. (A) Analysis of TNF-α and IL-1β expressions using western blotting. (B) Quantification of the protein bands of TNF-α and IL-1β. Data are expressed as mean±s.d. in each group (n=6 in each group). The TNF-α expression in the ON tissues was increased by 7.1- and 11.6-fold after 2 and 7 days post-rAION induction, respectively, compared to the sham controls (P<0.05). The IL-1β level in the ON tissues was increased by 21.8- and 40.8-fold after 2 and 7 days post-rAION induction, respectively, compared to the sham controls (P<0.05). *P<0.05 compared with the sham control by the Mann–Whitney U-test.

References

    1. Bernstein S. L. and Miller N. R. (2015). Ischemic optic neuropathies and their models: disease comparisons, model strengths and weaknesses. Jpn. J. Ophthalmol. 59, 135-147. 10.1007/s10384-015-0373-5 - DOI - PMC - PubMed
    1. Bernstein S. L., Johnson M. A. and Miller N. R. (2011). Nonarteritic anterior ischemic optic neuropathy (NAION) and its experimental models. Prog. Retin. Eye Res. 30, 167-187. 10.1016/j.preteyeres.2011.02.003 - DOI - PMC - PubMed
    1. Chang C. H., Huang T. L., Huang S. P. and Tsai R. K. (2014). Neuroprotective effects of recombinant human granulocyte colony-stimulating factor (G-CSF) in a rat model of anterior ischemic optic neuropathy (rAION). Exp. Eye Res. 118, 109-116. 10.1016/j.exer.2013.11.012 - DOI - PubMed
    1. Cui Q., Yin Y. and Benowitz L. I. (2009). The role of macrophages in optic nerve regeneration. Neuroscience 158, 1039-1048. 10.1016/j.neuroscience.2008.07.036 - DOI - PMC - PubMed
    1. Doycheva D. M., Hadley T., Li L., Applegate R. L. II, Zhang J. H. and Tang J. (2014). Anti-neutrophil antibody enhances the neuroprotective effects of G-CSF by decreasing number of neutrophils in hypoxic ischemic neonatal rat model. Neurobiol. Dis. 69, 192-199. 10.1016/j.nbd.2014.05.024 - DOI - PMC - PubMed

Publication types

MeSH terms