

Associations of genetic risk scores based on adult adiposity pathways with childhood growth and adiposity measures
- PMID: 27538985
- PMCID: PMC4991119
- DOI: 10.1186/s12863-016-0425-y
Associations of genetic risk scores based on adult adiposity pathways with childhood growth and adiposity measures
Abstract
Background: Results from genome-wide association studies (GWAS) identified many loci and biological pathways that influence adult body mass index (BMI). We aimed to identify if biological pathways related to adult BMI also affect infant growth and childhood adiposity measures.
Methods: We used data from a population-based prospective cohort study among 3,975 children with a mean age of 6 years. Genetic risk scores were constructed based on the 97 SNPs associated with adult BMI previously identified with GWAS and on 28 BMI related biological pathways based on subsets of these 97 SNPs. Outcomes were infant peak weight velocity, BMI at adiposity peak and age at adiposity peak, and childhood BMI, total fat mass percentage, android/gynoid fat ratio, and preperitoneal fat area. Analyses were performed using linear regression models.
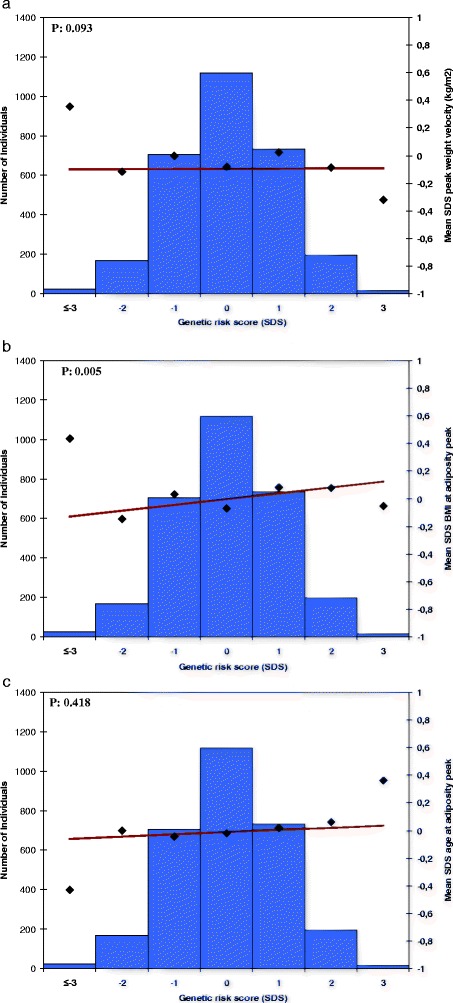
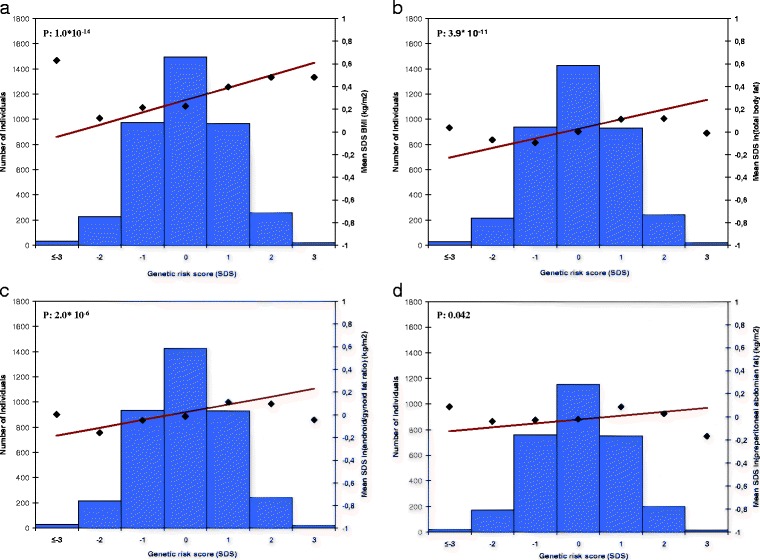
Results: A higher overall adult BMI risk score was associated with infant BMI at adiposity peak and childhood BMI, total fat mass, android/gynoid fat ratio, and preperitoneal fat area (all p-values < 0.05). Analyses focused on specific biological pathways showed that the membrane proteins genetic risk score was associated with infant peak weight velocity, and the genetic risk scores related to neuronal developmental processes, hypothalamic processes, cyclicAMP, WNT-signaling, membrane proteins, monogenic obesity and/or energy homeostasis, glucose homeostasis, cell cycle, and muscle biology pathways were associated with childhood adiposity measures (all p-values <0.05). None of the pathways were associated with childhood preperitoneal fat area.
Conclusions: A genetic risk score based on 97 SNPs related to adult BMI was associated with peak weight velocity during infancy and general and abdominal fat measurements at the age of 6 years. Risk scores based on genetic variants linked to specific biological pathways, including central nervous system and hypothalamic processes, influence body fat development from early life onwards.
Keywords: Body mass index; Genetics; Genome-wide association study; Pediatrics; Polymorphism, single nucleotide.
Figures
References
-
- World Health Organisation. Obesity and Overweight. Fact sheet No311. Available from: http://www.who.int/mediacentre/factsheets/fs311/en/, Accessed July 2015.
Publication types
MeSH terms
LinkOut - more resources
Full Text Sources
Other Literature Sources
Medical
