

Global electrical heterogeneity: A review of the spatial ventricular gradient
- PMID: 27539162
- PMCID: PMC5159246
- DOI: 10.1016/j.jelectrocard.2016.07.025
Global electrical heterogeneity: A review of the spatial ventricular gradient
Abstract
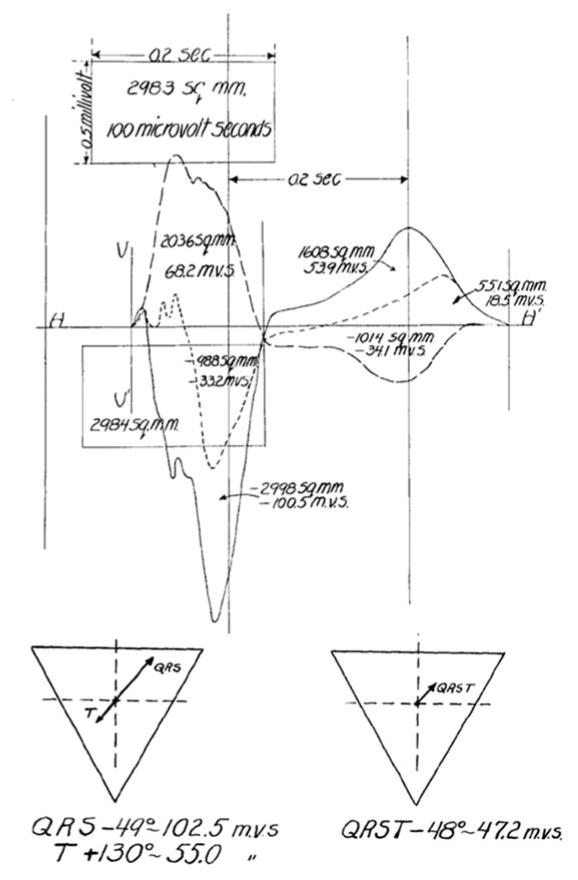
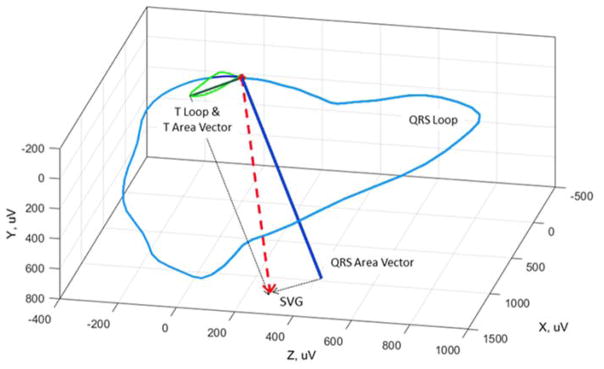
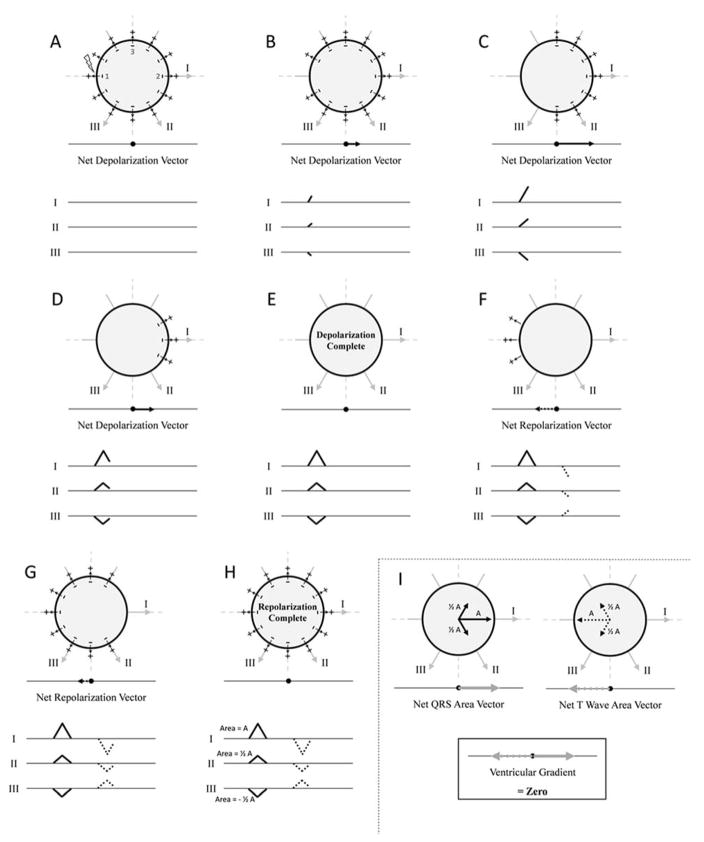
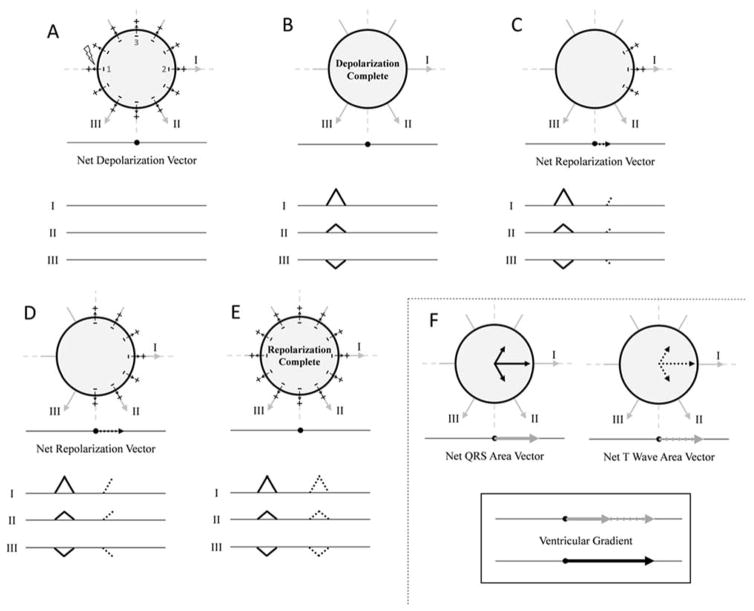
The ventricular gradient, an electrocardiographic concept calculated by integrating the area under the QRS complex and T-wave, represents the degree and direction of myocardial electrical heterogeneity. Although the concept of the ventricular gradient was first introduced in the 1930s, it has not yet found a place in routine electrocardiography. In the modern era, it is relatively simple to calculate the ventricular gradient in three dimensions (the spatial ventricular gradient (SVG)), and there is now renewed interest in using the SVG as a tool for risk stratification of ventricular arrhythmias and sudden cardiac death. This manuscript will review the history of the ventricular gradient, describe its electrophysiological meaning and significance, and discuss its clinical utility.
Keywords: Spatial ventricular gradient; Vectorcardiogram.
Copyright © 2016 Elsevier Inc. All rights reserved.
Figures
Similar articles
-
The derivation of the spatial QRS-T angle and the spatial ventricular gradient using the Mason-Likar 12-lead electrocardiogram.J Electrocardiol. 2015 Nov-Dec;48(6):1045-52. doi: 10.1016/j.jelectrocard.2015.08.009. Epub 2015 Aug 4. J Electrocardiol. 2015. PMID: 26381798
-
Frequency content and characteristics of ventricular conduction.J Electrocardiol. 2015 Nov-Dec;48(6):933-7. doi: 10.1016/j.jelectrocard.2015.08.034. Epub 2015 Aug 28. J Electrocardiol. 2015. PMID: 26364232 Free PMC article. Review.
-
A single moving dipole model of ventricular depolarization.Biomed Sci Instrum. 2006;42:237-42. Biomed Sci Instrum. 2006. PMID: 16817614
-
Can local ventricular fibrillation interval predict ventricular refractory period in human hearts?Med Hypotheses. 2004;63(3):446-8. doi: 10.1016/j.mehy.2003.10.032. Med Hypotheses. 2004. PMID: 15288365
-
The QRS complex--a biomarker that "images" the heart: QRS scores to quantify myocardial scar in the presence of normal and abnormal ventricular conduction.J Electrocardiol. 2009 Jan-Feb;42(1):85-96. doi: 10.1016/j.jelectrocard.2008.07.011. Epub 2008 Sep 13. J Electrocardiol. 2009. PMID: 18790501 Review. No abstract available.
Cited by
-
Global electrical heterogeneity associated with drug-induced torsades de pointes.Heart Rhythm. 2021 Jan;18(1):57-62. doi: 10.1016/j.hrthm.2020.07.038. Epub 2020 Aug 8. Heart Rhythm. 2021. PMID: 32781158 Free PMC article.
-
Risk stratification of sudden cardiac death in hypertension.J Electrocardiol. 2017 Nov-Dec;50(6):798-801. doi: 10.1016/j.jelectrocard.2017.08.012. Epub 2017 Aug 14. J Electrocardiol. 2017. PMID: 28916176 Free PMC article. Review.
-
Competing risks of monomorphic vs. non-monomorphic ventricular arrhythmias in primary prevention implantable cardioverter-defibrillator recipients: Global Electrical Heterogeneity and Clinical Outcomes (GEHCO) study.Europace. 2024 Jun 3;26(6):euae127. doi: 10.1093/europace/euae127. Europace. 2024. PMID: 38703375 Free PMC article.
-
Intra-Individual Comparison of Sinus and Ectopic Beats Probing the Ventricular Gradient's Activation Dependence.J Cardiovasc Dev Dis. 2023 Feb 20;10(2):89. doi: 10.3390/jcdd10020089. J Cardiovasc Dev Dis. 2023. PMID: 36826585 Free PMC article.
-
Electrophysiological ventricular substrate of stroke: a prospective cohort study in the Atherosclerosis Risk in Communities (ARIC) study.BMJ Open. 2021 Sep 3;11(9):e048542. doi: 10.1136/bmjopen-2020-048542. BMJ Open. 2021. PMID: 34479935 Free PMC article.
References
-
- Wilson FN, Macleod AG, Barker PS, Johnston FD. The determination and the significance of the areas of the ventricular deflections of the electrocardiogram. American Heart Journal. 1934;10:46–61.
-
- Wilson FN, Macleon FS, Barker PS. The T Deflection of the Electrocardiogram. Transactions of the Association of American Physicians. 1931;46:29–38.
-
- Ashman R, Byer E. The normal human ventricular gradient: I. Factors which affect its direction and its relation to the mean QRS axis. American Heart Journal. 1943;25:16–35.
-
- Gardberg M, Rosen IL. Monophasic curve analysis and the ventricular gradient in the electrogram of strips of turtle ventricle. Circ Res. 1959;7:870–5. - PubMed
-
- Burch GE, Abildskov AA, Cronvich JA. A study of the spatial vectorcardiogram of the ventricular gradient. Circulation. 1954;9:267–75. - PubMed
Publication types
MeSH terms
Grants and funding
LinkOut - more resources
Full Text Sources
Other Literature Sources
