. 2016 Aug 19:7:12405.
doi: 10.1038/ncomms12405.

Bright monomeric near-infrared fluorescent proteins as tags and biosensors for multiscale imaging

Affiliations

Bright monomeric near-infrared fluorescent proteins as tags and biosensors for multiscale imaging

Daria M Shcherbakova et al. Nat Commun. .

Abstract

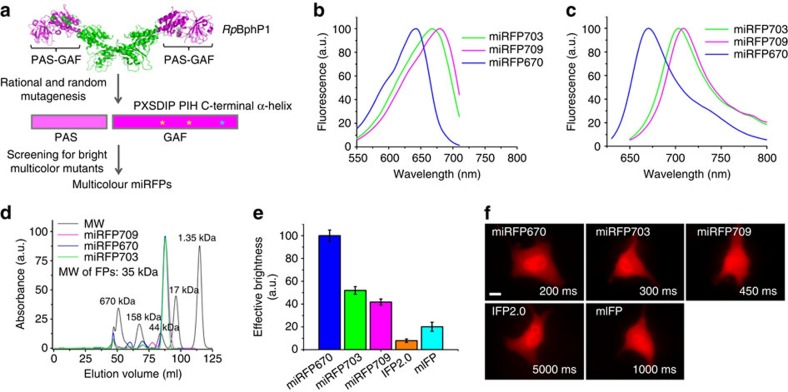
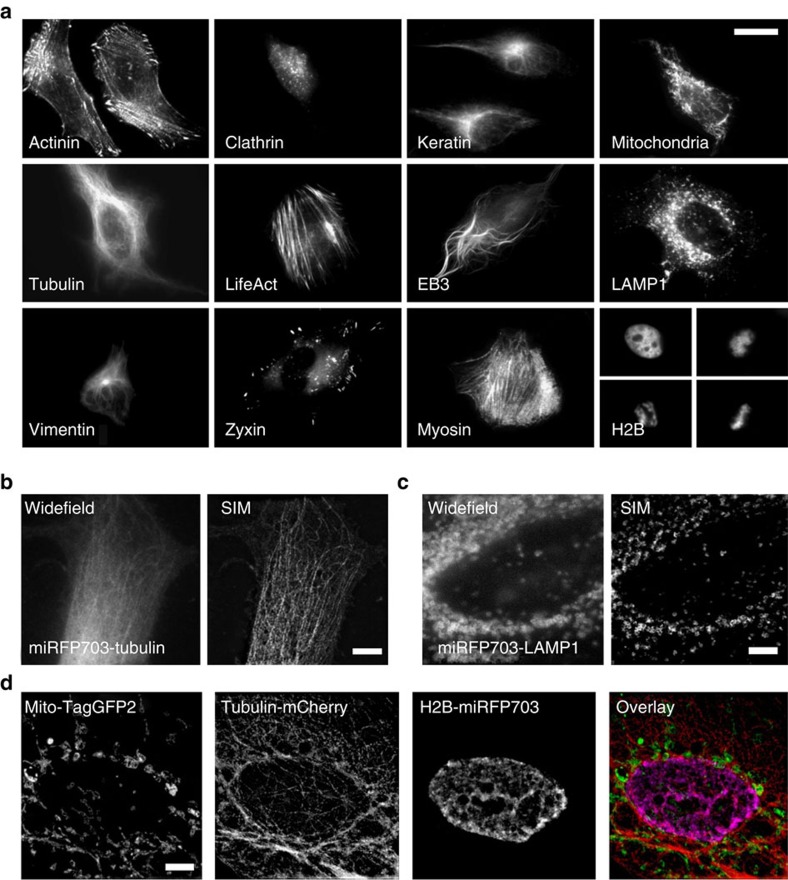
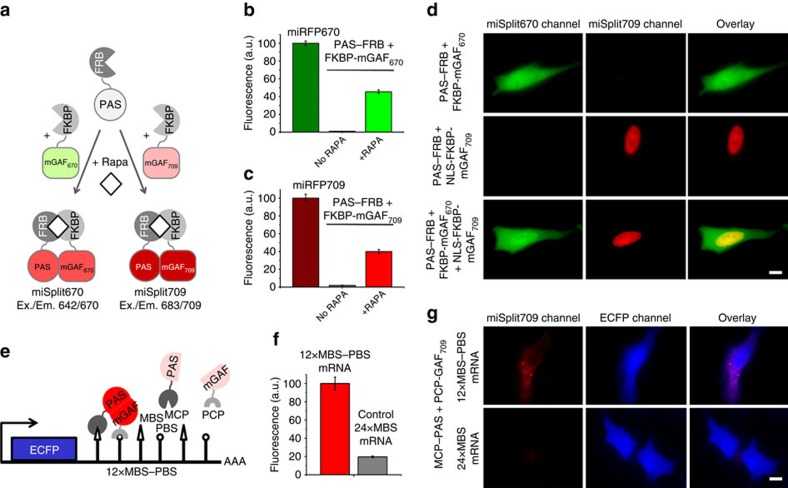
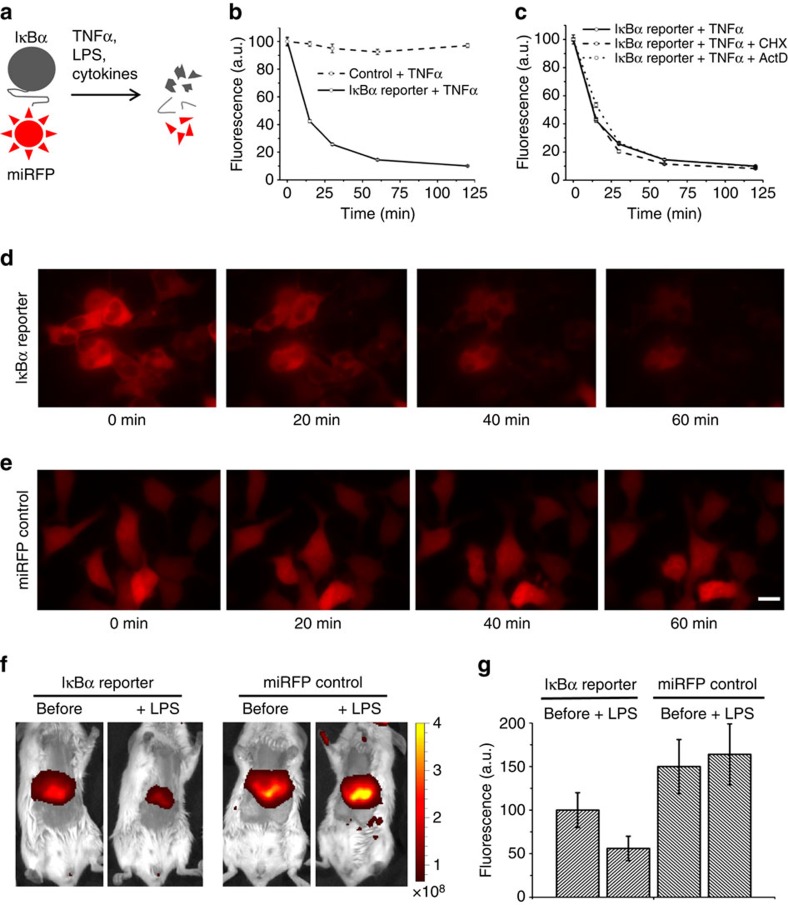
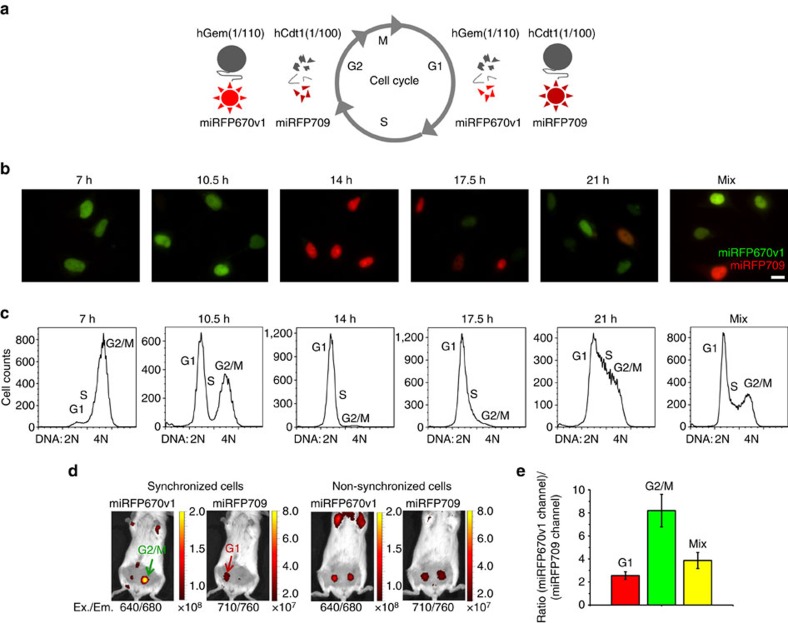
Monomeric near-infrared (NIR) fluorescent proteins (FPs) are in high demand as protein tags and components of biosensors for deep-tissue imaging and multicolour microscopy. We report three bright and spectrally distinct monomeric NIR FPs, termed miRFPs, engineered from bacterial phytochrome, which can be used as easily as GFP-like FPs. miRFPs are 2-5-fold brighter in mammalian cells than other monomeric NIR FPs and perform well in protein fusions, allowing multicolour structured illumination microscopy. miRFPs enable development of several types of NIR biosensors, such as for protein-protein interactions, RNA detection, signalling cascades and cell fate. We demonstrate this by engineering the monomeric fluorescence complementation reporters, the IκBα reporter for NF-κB pathway and the cell cycle biosensor for detection of proliferation status of cells in culture and in animals. miRFPs allow non-invasive visualization and detection of biological processes at different scales, from super-resolution microscopy to in vivo imaging, using the same probes.


Figures

Figure 1
Figure 1. Development and characterization of three monomeric miRFPs.
(a) Schematics of directed molecular evolution resulted in three monomeric miRFPs. The chromophore-binding PAS-GAF domains, which are not involved in dimerization of RpBphP1, were used as a starting point. To exclude formation of even weak dimers, we mutated residues in the C-terminal α-helix in the GAF domain. To obtain spectrally distinct variants, we mutated residues 201 and 202 in the -PXSDIP- motif and residue 253 in the -PIH- motif in the GAF domain. (b) Fluorescence excitation spectra of engineered miRFP670, miRFP703 and miRFP709. (c) Fluorescence emission spectra of miRFPs. (d) Size exclusion chromatography of miRFPs and indicated molecular weight standards. Apparent molecular weight of all miRFPs was ∼35 kDa. (e) Brightness of live HeLa cells transiently transfected with several BphP-based NIR FPs analysed by flow cytometry. The NIR fluorescence intensity was normalized to transfection efficiency (fluorescence of co-transfected EGFP), to excitation efficiency of each FP with 635 nm laser, and to fluorescence signal of each FP in the emission filter. The NIR effective brightness of miRFP670 was assumed to be 100%. Error bars, s.d. (n=3; transfection experiments). (f) Representative fluorescence images of several BphP-based NIR FPs in live HeLa cells. Acquisition time for each image is indicated. Scale bar, 10 μm.
Figure 2
Figure 2. miRFP fusions visualized by widefield and super-resolution microscopy.
(a) Live HeLa cells transiently transfected with the miRFP703 N- and C-terminal fusion constructs. The N-terminal fusions are α-actinin, keratin, vimentin and tubulin-binding EB3, mitochondrial, focal adhesion protein zyxin, lysosomal membrane glycoprotein LAMP1, vesicular protein clathrin, actin-binding LifeAct and histone H2B. The C-terminal fusions are α-tubulin and myosin. (b,c) Widefield and structured illumination microscopy (SIM) imaging of fixed HeLa cells expressing α-tubulin (b) and LAMP1 (c) labelled with miRFP703. (d) Three-colour SIM of fixed HeLa cells expressing mitochondria labelled with TagGFP2, α-tubulin labelled with mCherry and H2B labelled with miRFP703. Scale bar, 5 μm.
Figure 3
Figure 3. Two bimolecular fluorescence complementation (BiFC) monomeric miSplit reporters.
(a) Schematics of design and application of miSplit670 and miSplit709 reporters for protein–protein interaction (PPI). The two mSplits share the same PAS fragment that can interact with either mGAF670 or mGAF709 fragments producing the fluorescence signal corresponding to complemented miSplit670 or miSplit709, respectively. (b,c) Brightness and complementation contrast of miSplit670 (b) and miSplit709 (c) in live HeLa cells. HeLa cells were transiently transfected with the plasmids encoding the indicated proteins. Rapamycin (Rapa) was added where indicated. The mean fluorescence intensities of cells were analysed by flow cytometry. Error bars, s.d. (n=3; transfection experiments). (d) Two-colour imaging of two alternative PPIs in one cell. Transiently transfected HeLa cells expressed cytoplasmic FRB-PAS together with either cytoplasmic FKBP-mGAF670 (top) or nuclear FKBP-mGAF709 (middle), or both (bottom) of FKBP-fused GAF fragments. Pseudocolour images (miSplit670 channel in green and miSplit709 channel in red) and the overlays are shown. Scale bar, 10 μm. (e) Schematics of the approach for NIR low-background RNA imaging. RNA (here mRNA encoding ECFP) is tagged with pairs of RNA-binding motifs, MBS and PBS, which bind bacteriophage coat proteins MS2 (MCP) and PP7 (PCP), respectively. MCP and PCP are fused with two fragments of miSplit reporter. mRNA serves as a scaffold to bring two split fragments together and reconstitute fluorescence. (f) mRNA detection with miSplit709. Live HeLa cells co-expressed PAS-MCP and PCP-mGAF709 together with ECFP mRNA tagged with 12xMBS-PBS binding sites. ECFP mRNA tagged with 24xMBS binding sites served as a control. The mean fluorescence intensities of cells were analysed by flow cytometry. Error bars, s.d. (n=3; transfection experiments). (g) Representative images of live HeLa cells analysed in f. Pseudocolour images (miSplit709 channel in red and ECFP channel in blue) and the overlay are shown for ECFP mRNA with 12xMBS-PBS (top) and ECFP mRNA with 24xMBS (bottom). Scale bar, 10 μm.
Figure 4
Figure 4. NIR IκBα reporter for canonical NF-κB pathway.
(a) Schematics showing stimulus-induced degradation of the NIR IκBα reporter. Stimuli inducing IKK activation, such as TNFα, lipopolysaccharide (LPS) and cytokines, lead to IκBα phosphorylation by IKK and degradation of the fusion. (b) The response of the NIR IκBα reporter to treatment with TNFα. Live HEK293 cells stably expressing the reporter or untagged miRFP703 control were treated with TNFα. The fluorescence intensity of cells were analysed by flow cytometry at different time points. Error bars, s.d. (n=3). (c) Effect of pretreatment with translation inhibitor cycloheximide (CHX) or transcription inhibitor actinomycin D (ActD) on the TNFα-induced reporter degradation kinetics studied as in b. Error bars, s.d. (n=3). (d,e) Microscopy time-lapse images of live HEK293 cells stably expressing either NIR IκBα-miRFP703 reporter (d) or untagged miRFP703 control (e) on treatment with TNFα. Scale bar, 10 μm. (f) Representative images of a mouse expressing the NIR IκBα reporter in the liver and a control mouse expressing untagged miRFP703 before and 2 h after injection with LPS. The colour bar indicates the total fluorescence radiant efficiency (photons s−1 cm−2 steradian−1 per μW cm−2). (g) Quantification of the fluorescence changes for the data in f. Total radiant efficiencies of the areas corresponding to the livers were quantified. Error bars, s.d. (n=3).
Figure 5
Figure 5. NIR cell cycle reporter based on two spectrally distinct miRFPs.
(a) Schematics of cell-cycle-dependent fluorescence changes in NIR cell cycle reporter, which consists of a combination of miRFP670v1-hGem(1/110) and miRFP709-hCdt1(1/100) fusions. These fusions are degraded reciprocally during the cell cycle. The miRFP670v1-hGem(1/110) fusion accumulates in S/G2/M phases, whereas the miRFP709-hCdt1(1/100) fusion accumulates in G1 phase. (b) Microscopy images of NIR cell cycle reporter in cells at different time points during cell cycle progression. HeLa cells stably expressing NIR cell cycle reporter were released after the synchronization by double thymidine block and analysed at indicated time points. The overlays of two pseudocolour images (miRFP670v1 channel in green and miRFP709 channel in red) are shown. Unsynchronized cells are shown in the most right panel (mix). Scale bar, 10 μm. (c) Flow cytometry histograms of Hoechst 33342 fluorescence distribution representing the cell cycle progression for the cells shown in b. Cells in b and c were prepared and analysed in parallel. (d) Representative images of mice with implanted cells expressing the NIR cell cycle reporter. A mouse on the left was injected with cells synchronized as in b and c. The cells in G2/M and G1 phases were injected in the left and right sides of the mouse, respectively. A mouse on the right was injected with the non-synchronized cells into both sides. The two channels for miRFP670v1 and miRFP709 imaging are shown. The colour bars indicate the total fluorescence radiant efficiency (photons s−1 cm−2 steradian−1 per μW cm−2). (e) The ratios between the fluorescence intensities of the implanted cells in the miRFP670v1 and miRFP709 channels for the data in d. Total radiant efficiencies of the areas corresponding to the implanted cells were quantified for each channel and the ratios were calculated. Error bars, s.d. (n=6).

References

    1. Shcherbakova D. M., Baloban M. & Verkhusha V. V. Near-infrared fluorescent proteins engineered from bacterial phytochromes. Curr. Opin. Chem. Biol. 27, 52–63 (2015). - PMC - PubMed
    1. Weissleder R. A clearer vision for in vivo imaging. Nat. Biotechnol. 19, 316–317 (2001). - PubMed
    1. Shu X. et al. Mammalian expression of infrared fluorescent proteins engineered from a bacterial phytochrome. Science 324, 804–807 (2009). - PMC - PubMed
    1. Filonov G. S. et al. Bright and stable near-infrared fluorescent protein for in vivo imaging. Nat. Biotechnol. 29, 757–761 (2011). - PMC - PubMed
    1. Shcherbakova D. M., Shemetov A. A., Kaberniuk A. A. & Verkhusha V. V. Natural photoreceptors as a source of fluorescent proteins, biosensors, and optogenetic tools. Annu. Rev. Biochem. 84, 519–550 (2015). - PMC - PubMed

Publication types

MeSH terms