

Quantitative analysis of human centrosome architecture by targeted proteomics and fluorescence imaging
- PMID: 27539480
- PMCID: PMC5048348
- DOI: 10.15252/embj.201694462
Quantitative analysis of human centrosome architecture by targeted proteomics and fluorescence imaging
Abstract
Centrioles are essential for the formation of centrosomes and cilia. While numerical and/or structural centrosomes aberrations are implicated in cancer, mutations in centriolar and centrosomal proteins are genetically linked to ciliopathies, microcephaly, and dwarfism. The evolutionarily conserved mechanisms underlying centrosome biogenesis are centered on a set of key proteins, including Plk4, Sas-6, and STIL, whose exact levels are critical to ensure accurate reproduction of centrioles during cell cycle progression. However, neither the intracellular levels of centrosomal proteins nor their stoichiometry within centrosomes is presently known. Here, we have used two complementary approaches, targeted proteomics and EGFP-tagging of centrosomal proteins at endogenous loci, to measure protein abundance in cultured human cells and purified centrosomes. Our results provide a first assessment of the absolute and relative amounts of major components of the human centrosome. Specifically, they predict that human centriolar cartwheels comprise up to 16 stacked hubs and 1 molecule of STIL for every dimer of Sas-6. This type of quantitative information will help guide future studies of the molecular basis of centrosome assembly and function.
Keywords: centriole; centrosome; fluorescence imaging; proteomics; selected reaction monitoring.
© 2016 The Authors. Published under the terms of the CC BY NC ND 4.0 license.
Figures
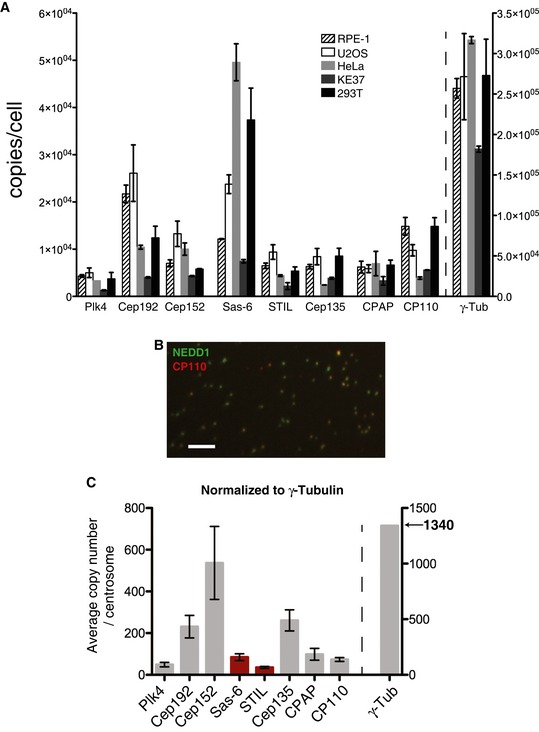
The absolute abundance of centrosomal proteins in whole‐cell lysates, prepared from asynchronous growing cells, was determined using SRM mass spectrometry combined with stable isotope dilution. Copy numbers per cell were measured in three independent experiments. Because not all peptides could be detected in all experiments, histograms show average values determined in those two measurements in which most peptides could be measured reliably. Results presented are means ± SEM. RPE‐1 (non‐transformed) cells were compared with various tumor‐derived (U2OS, HeLa, KE37) or transformed cells (HEK293T). Note the different scale for γ‐tubulin on the y‐axis.
Representative image showing centrosome preparation stained with antibodies to NEDD1 (green) and CP110 (red). Scale bar: 10 μm.
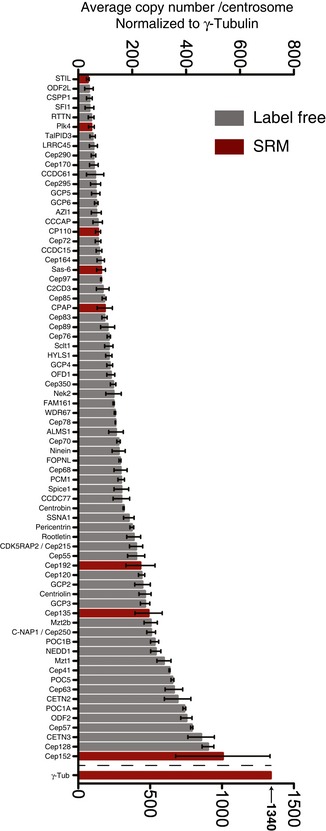
Purified centrosomes from KE37 cells were analyzed by SRM with stable isotope dilution. Histogram a priori represents relative copy numbers per centrosome (results presented are means ± SEM). To predict protein abundance in absolute numbers (average number of copies/centrosome), data were normalized to 1,340 γ‐tubulin molecules, that is the average number of γ‐tubulin per centrosome as deduced by combining SRM and EGFP fluorescence measurements (Figs 4 and 5). Bars for Sas‐6 and STIL are marked in red to indicate that the corresponding values should be approximately doubled to correct for the fact that some 50% of purified centrosomes are derived from G1‐phase cells that mostly lack these two proteins. Note the different scale for γ‐tubulin on the y‐axis.
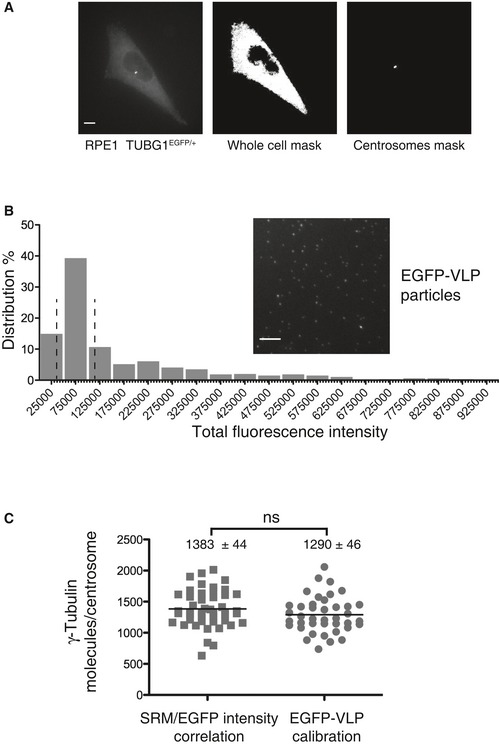
Fluorescence analysis of RPE‐1 cells expressing endogenously tagged γ‐tubulin‐EGFP. Cells were synchronized in G2, using RO‐3306, to allow for a clear distinction of the two centrosomes present at this cell cycle stage. Panels illustrate sum projections of the stacks from an original picture (left), a whole‐cell mask (middle), and a centrosome mask (right); both masks are based on intensity thresholding. Scale bar: 10 μm.
EGFP‐tagged viral‐like particles (GFP‐VLP2/6) are used as a reference for quantification of γ‐tubulin‐EGFP. The histogram shows the distribution of the total fluorescence intensity associated with single GFP‐VLP2/6; the two dashed lines delimit the population used for assigning an average fluorescence intensity value to represent the 120 GFP molecules associated with each VLP2/6 particle (Charpilienne et al, 2001). The inset shows a sum projection of EGFP‐VLPs fluorescence image. Scale bar: 10 μm.
Scatter plots show the numbers of γ‐tubulin molecules per centrosome determined by calibrations using either SRM measurements (n = 46 cells) or EGFP‐VLP2/6 fluorescence (n = 40 cells). The black lines represent mean values; numbers ± SEM are indicated on top of each scatter plot. P‐values from t‐tests are indicated as follows: ***P < 0.001, **P = 0.001–0.01, *P = 0.01–0.05, and ns P > 0.05.
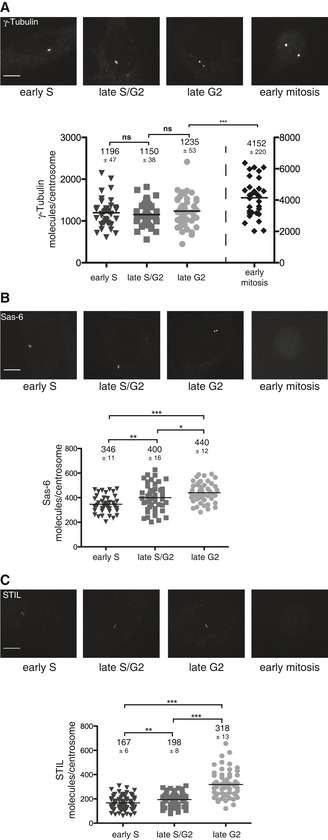
- A–C
Top panels: RPE‐1 cells expressing (endogenous) γ‐tubulin‐EGFP (A), Sas‐6 (B), or STIL (C) at the indicated cell cycle stages. Fluorescence images of representative cells are shown as maximum projections. Scale bars: 10 μm. Bottom panels: Fluorescence quantifications were performed using the EGFP‐VLP2/6 method for calibration. Scatter plots represent the number of γ‐tubulin (A), Sas‐6 (B), or STIL (C) molecules per centrosome at the indicated cell cycle stages. The black lines represent mean values; numbers ± SEM are indicated on top of each scatter plot. The following numbers of cells were analyzed in early S phase: γ‐tubulin: 45, Sas‐6: 43, STIL: 79; in late S/G2 phase: γ‐tubulin: 45, Sas‐6: 46, STIL: 68; in late G2 phase: γ‐tubulin: 48, Sas‐6: 48, STIL: 68; and in early mitosis: γ‐tubulin: 31. Note that fluorescence images were recorded using identical settings. P‐values from t‐tests are indicated as follows: ***P < 0.001, **P = 0.001–0.01, *P = 0.01–0.05, and ns P > 0.05.
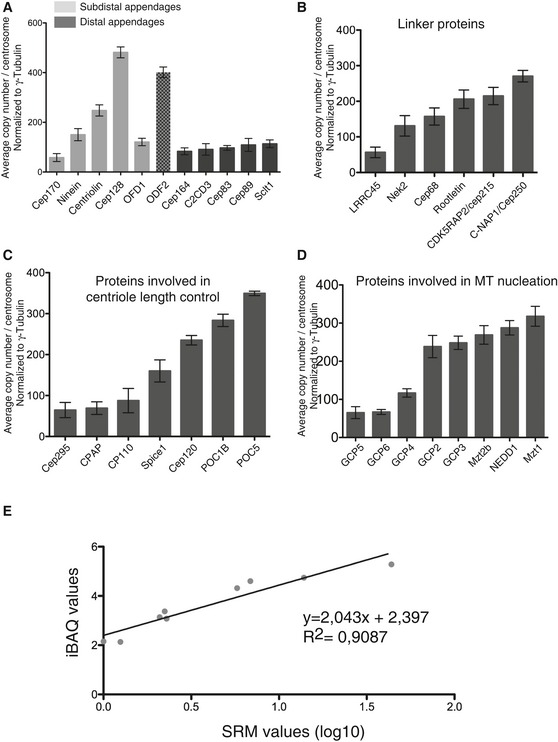
- A–D
Histograms show quantifications for subsets of centrosomal proteins; results presented are means ± SEM. Data are extracted from Fig 3 but arranged to facilitate comparisons of proteins with similar localizations and/or functions. Grouped together are distal and subdistal appendage proteins (A; note that ODF2 is believed to associate with both structures), centrosomal linker proteins (B), proteins involved in centriole length control (C), and core components involved in MT nucleation (D).
- E
Correlation analysis shows excellent correspondence between values determined by iBAQ and SRM.
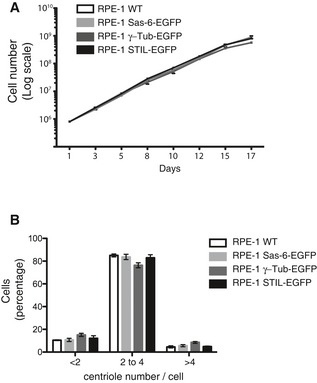
EGFP‐tagging of centrosomal proteins does not detectably affect cell proliferation. The indicated cell lines were grown under standard conditions, and cell numbers counted at the indicated times. Note that all growth curves are nearly identical.
EGFP‐tagging of centrosomal proteins does not detectably affect centriole number. Cells of the indicated genotype were grown on coverslips, and centriole numbers were counted after staining with anti‐CP110 antibodies (immunofluorescence microscopy). Histogram shows average of two experiments; results presented are means ± SEM. Note that the vast majorities of cells showed between 2 and 4 centrioles (as expected for G1‐ and G2‐phase cells, respectively), with no discernible differences between cell lines.
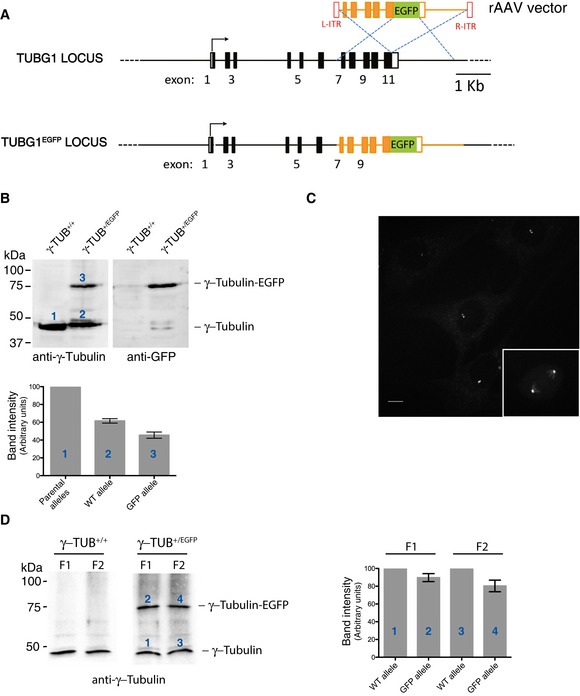
Schematic representation of wild‐type (WT) TUBG1 locus and the targeted allele obtained after rAAV‐mediated homologous recombination. Black rectangles represent exons and black lines introns. After insertion of the EGFP coding sequence, cells expressing γ‐tubulin‐EGFP were selected by FACS.
Western blot analysis of parental RPE‐1 and γ‐tubulin‐EGFP‐expressing RPE‐1 cells. Protein extracts were probed with anti‐γ‐tubulin (left panel) and anti‐GFP (right panel) antibodies. Histogram shows quantification of the numbered bands; average of two experiments. Results presented are means ± SEM. Band intensity for WT alleles was set to 100%.
Maximum projection fluorescence microscopy image showing asynchronously growing RPE‐1 cells expressing γ‐tubulin‐EGFP. Inset shows mitotic cell (metaphase). Scale bar: 10 μm.
Centrosomes were purified from parental RPE‐1 cells (left panel) or γ‐tubulin‐EGFP‐expressing RPE‐1 cells (right panel), using a previously described procedure (Blomberg‐Wirschell & Doxsey, 1998). In brief, starting with material derived from 2 × 15 cm plates, method 1 was employed with minor modifications. The first two centrosomal fractions (F1, F2; 0.5 ml each) were collected and concentrated by TCA precipitation prior to Western blot analysis. Membranes were probed by anti‐γ‐tubulin antibody. Histogram shows quantification of the numbered bands; average of two experiments. Results presented are means ± SEM. Band intensity for WT alleles was set to 100%. Note that both centrosome fractions (F1 and F2) contained WT γ‐tubulin and EGFP‐tagged γ‐tubulin in similar proportions.
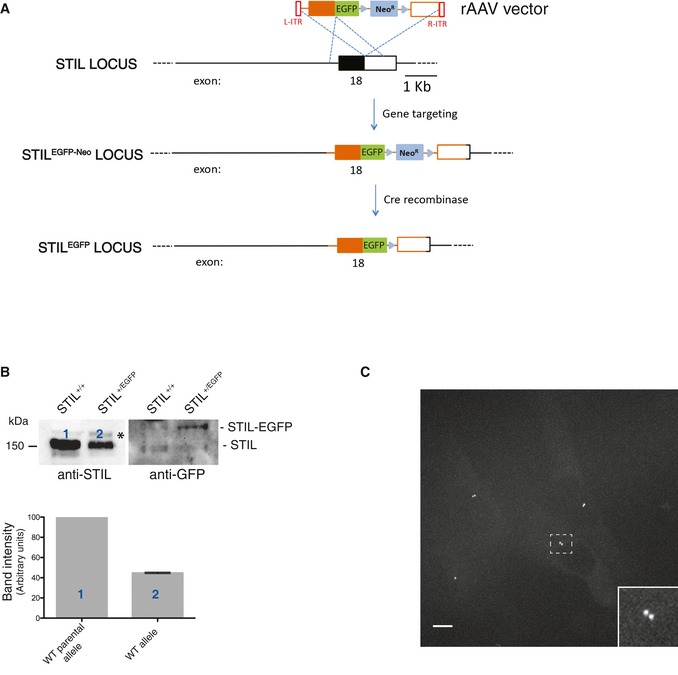
Schematic representation of WT STIL locus and the targeted STIL allele obtained after rAAV‐mediated homologous recombination. Black rectangles represent exons and black lines introns. After insertion of the EGFP coding sequence and the G418 resistance cassette, cells were selected by addition of G418 to the medium. Then, the neomycin cassette was removed using an adenovirus‐expressed Cre recombinase (Vector Biolabs, Malvern, PA, USA), and clones were isolated by serial dilution (loss of resistance to G418 was confirmed by replica plating). Finally, positive cells were confirmed by fluorescence microscopy.
Western blot analysis of parental RPE‐1 and STIL‐EGFP‐expressing RPE‐1 cells. Protein extracts were probed with anti‐STIL (left panel; asterisks denotes background band) and anti‐GFP (right panel) antibodies. Note that only the anti‐GFP antibody recognizes STIL‐EGFP; lack of reactivity by the anti‐STIL antibody almost certainly reflects interference of the EGFP tag with the epitope recognized by this antibody (this antibody was raised against a peptide corresponding to the C‐terminus of STIL (last 50 amino acids), and involvement of the C‐terminus in the fusion with EGFP makes interference plausible). Histogram shows quantification of the numbered bands; average of two experiments. Results presented are means ± SEM. Band intensity for WT alleles was set to 100%.
Maximum projection fluorescence microscopy image showing asynchronously growing RPE‐1 cells expressing STIL‐EGFP. Scale bar: 10 μm. The inset shows an enlargement of the boxed interphase centrosome.
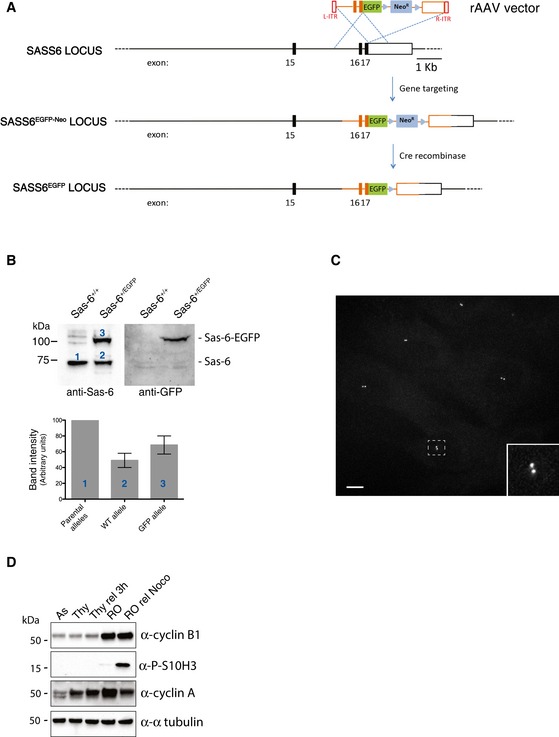
Scheme of WT SASS6 locus and the targeted SASS6 allele obtained by rAAV‐mediated homologous recombination. Black rectangles represent exons and black lines introns. After insertion of the EGFP coding sequence and the G418 resistance cassette, cells were selected by addition of G418 in the medium. Then, the neomycin cassette was removed using an adenovirus‐expressed Cre recombinase (Vector Biolabs, Malvern, PA, USA), and clones were isolated by serial dilution (loss of resistance to G418 was confirmed by replica plating). Finally, positive cells were confirmed by fluorescence microscopy.
Western blot analysis of parental RPE‐1 and Sas‐6‐EGFP‐expressing RPE‐1 cells. Protein extracts were probed with anti‐Sas‐6 (left panel) and anti‐GFP (right panel) antibodies. Histogram shows quantification of the numbered bands. Results presented are means ± SEM. Band intensity for WT alleles was set to 100%.
Maximum projection fluorescence microscopy image showing asynchronously growing RPE‐1 cells expressing Sas‐6‐EGFP. Scale bar: 10 μm. The inset shows an enlargement of the boxed interphase centrosome.
Efficacy of cell cycle synchronization was demonstrated by subjecting cell lysates to Western blotting with the indicated antibodies against cell cycle markers.
References
-
- Addona TA, Abbatiello SE, Schilling B, Skates SJ, Mani DR, Bunk DM, Spiegelman CH, Zimmerman LJ, Ham AJ, Keshishian H, Hall SC, Allen S, Blackman RK, Borchers CH, Buck C, Cardasis HL, Cusack MP, Dodder NG, Gibson BW, Held JM et al (2009) Multi‐site assessment of the precision and reproducibility of multiple reaction monitoring‐based measurements of proteins in plasma. Nat Biotechnol 27: 633–641 - PMC - PubMed
-
- Ahrne E, Molzahn L, Glatter T, Schmidt A (2013) Critical assessment of proteome‐wide label‐free absolute abundance estimation strategies. Proteomics 13: 2567–2578 - PubMed
-
- Andersen JS, Wilkinson CJ, Mayor T, Mortensen P, Nigg EA, Mann M (2003) Proteomic characterization of the human centrosome by protein correlation profiling. Nature 426: 570–574 - PubMed
-
- Arike L, Valgepea K, Peil L, Nahku R, Adamberg K, Vilu R (2012) Comparison and applications of label‐free absolute proteome quantification methods on Escherichia coli . J Proteomics 75: 5437–5448 - PubMed
Publication types
MeSH terms
Substances
LinkOut - more resources
Full Text Sources
Other Literature Sources
