. 2016 Oct;17(5):417-31.
doi: 10.1007/s10162-016-0578-4. Epub 2016 Aug 18.

Genome-Wide Association Analysis Identifies Dcc as an Essential Factor in the Innervation of the Peripheral Vestibular System in Inbred Mice

Affiliations

Genome-Wide Association Analysis Identifies Dcc as an Essential Factor in the Innervation of the Peripheral Vestibular System in Inbred Mice

Pezhman Salehi et al. J Assoc Res Otolaryngol. 2016 Oct.

Abstract

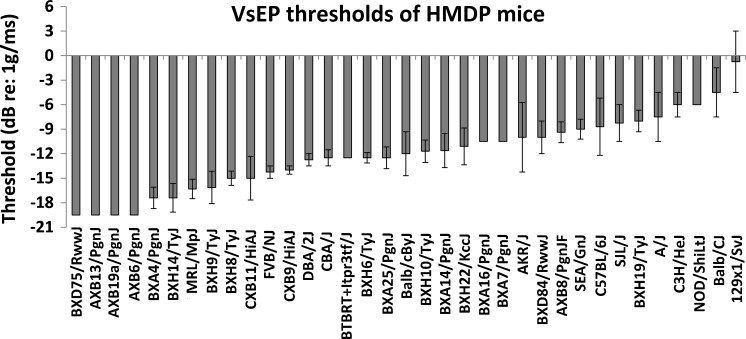
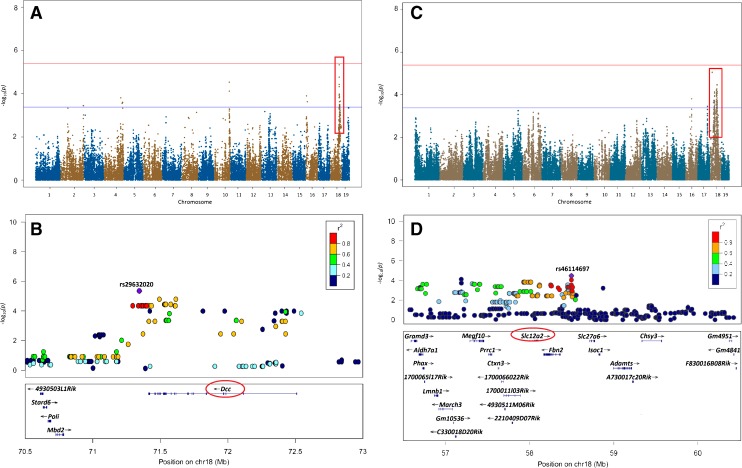
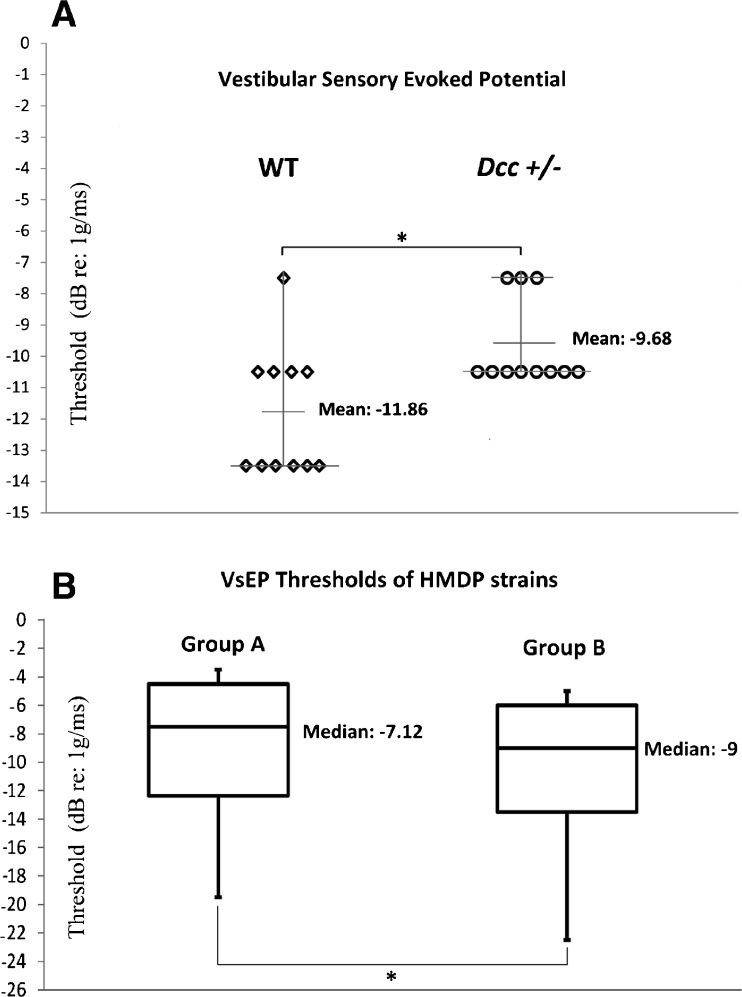
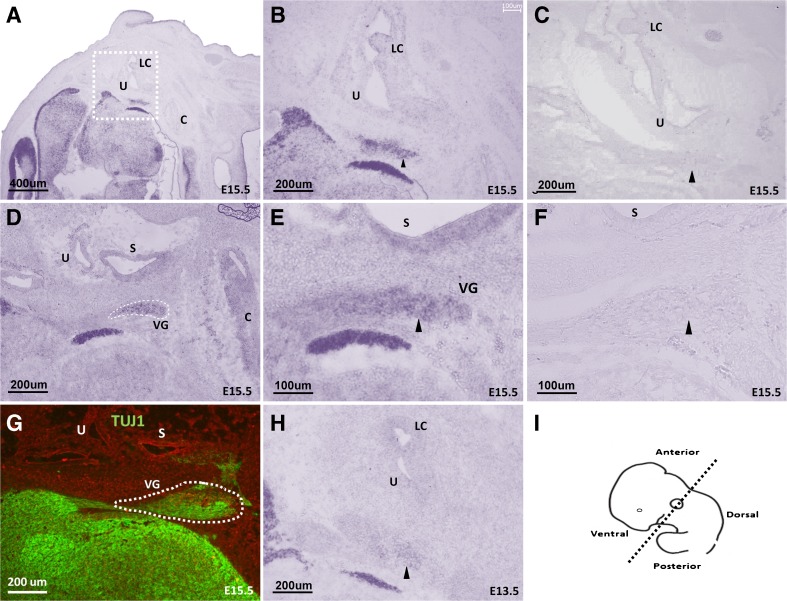
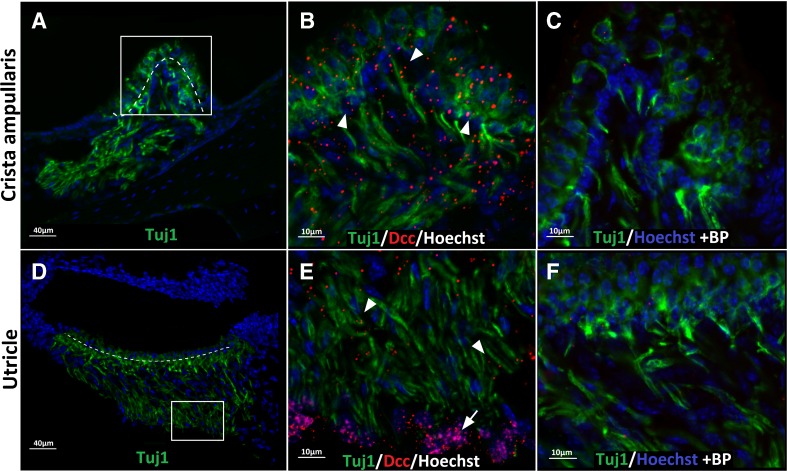
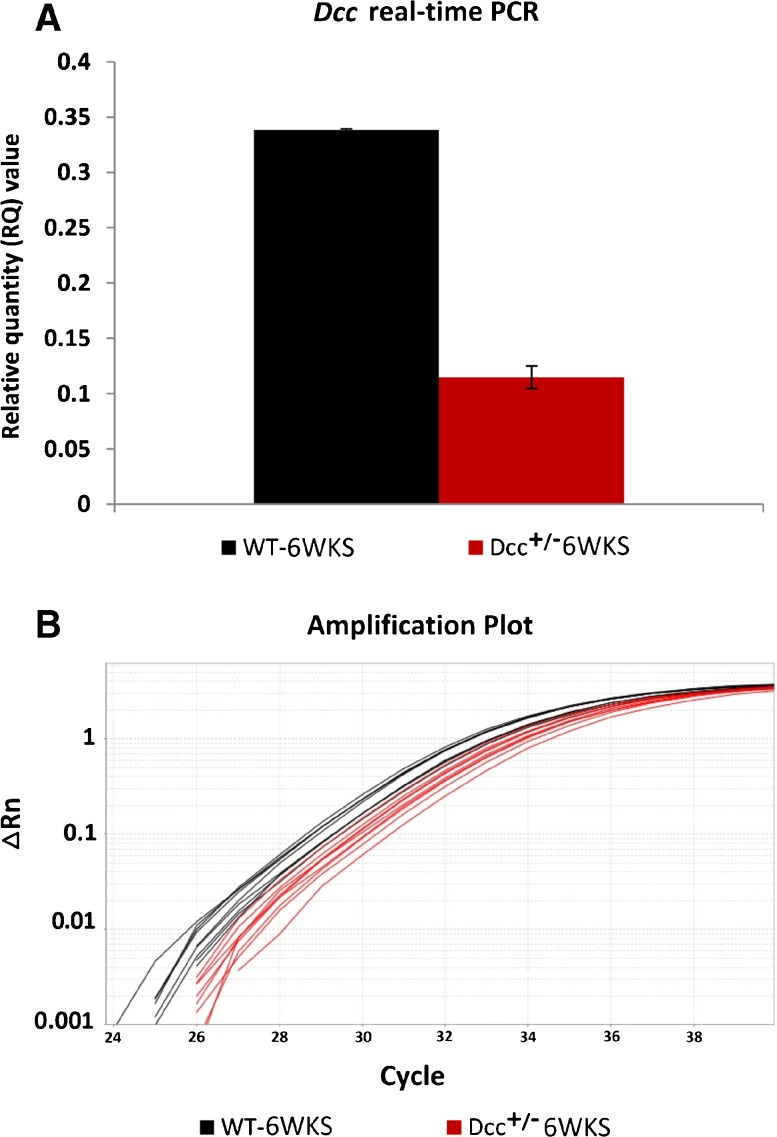
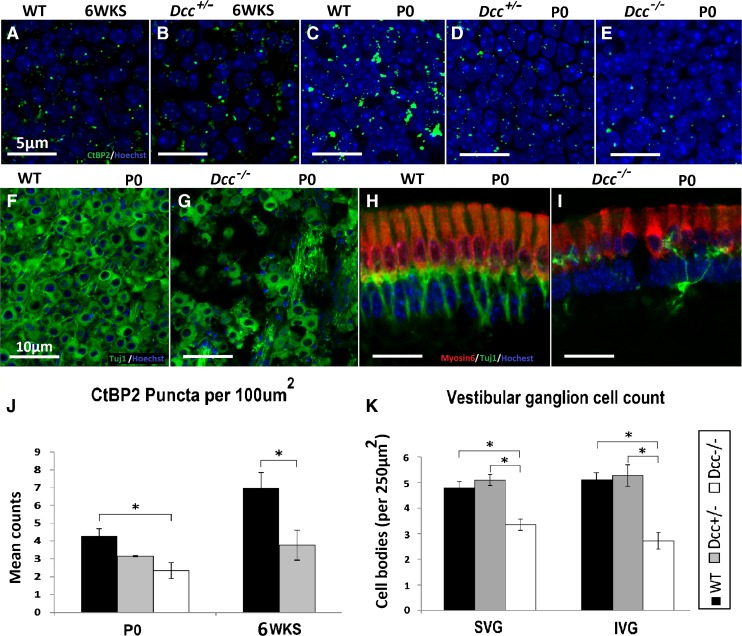
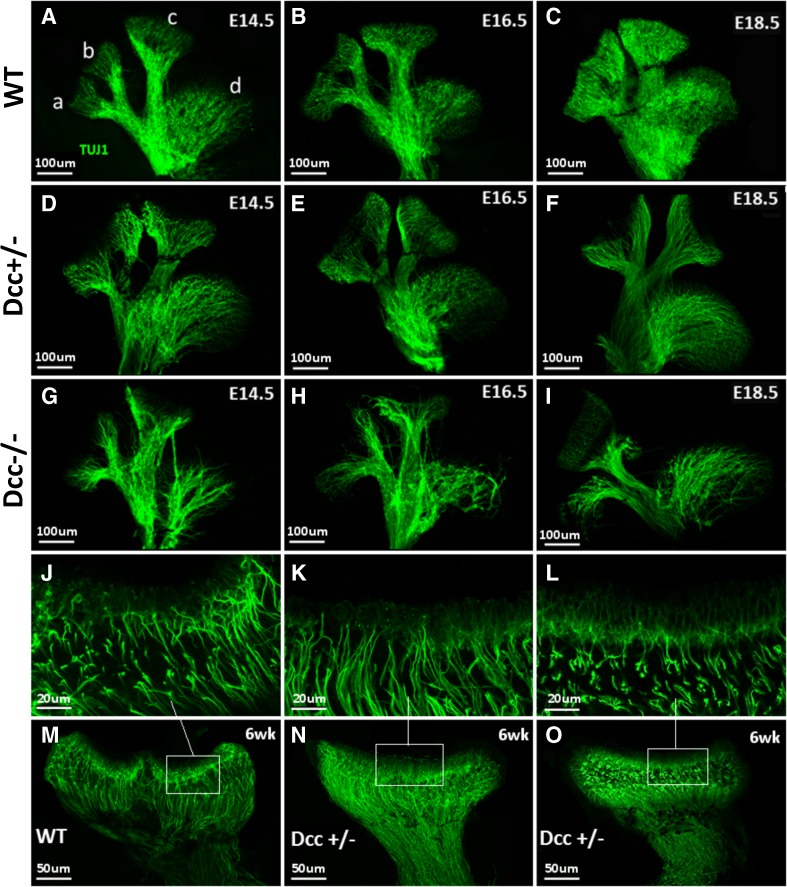
This study aimed to investigate the genetic causes of vestibular dysfunction. We used vestibular sensory-evoked potentials (VsEPs) to characterize the vestibular function of 35 inbred mouse strains selected from the Hybrid Mouse Diversity Panel and demonstrated strain-dependent phenotypic variation in vestibular function. Using these phenotypic data, we performed the first genome-wide association study controlling for population structure that has revealed two highly suggestive loci, one of which lies within a haplotype block containing five genes (Stard6, 4930503L19Rik, Poli, Mbd2, Dcc) on Chr. 18 (peak SNP rs29632020), one gene, deleted in colorectal carcinoma (Dcc) has a well-established role in nervous system development. An in-depth analysis of Dcc-deficient mice demonstrated elevation in mean VsEP threshold for Dcc (+/-) mice (-11.86 dB) compared to wild-type (-9.68 dB) littermates. Synaptic ribbon studies revealed Dcc (-/-) (P0) and Dcc (+/-) (6-week-old) mice showed lower density of the presynaptic marker (CtBP2) as compared to wild-type controls. Vestibular ganglion cell counts of Dcc (-/-) (P0) was lower than controls. Whole-mount preparations showed abnormal innervation of the utricle, saccule, and crista ampullaris at E14.5, E16.5, and E18.5. Postnatal studies were limited by the perinatal lethality in Dcc (-/-) mice. Expression analyses using in situ hybridization and immunohistochemistry showed Dcc expression in the mouse vestibular ganglion (E15.5), and utricle and crista ampullaris (6-week-old), respectively. In summary, we report the first GWAS for vestibular functional variation in inbred mice and provide evidence for the role of Dcc in the normal innervation of the peripheral vestibular system.

Keywords: Hybrid Mouse Diversity Panel; axonal migration; crista; deleted in colorectal carcinoma (Dcc); genome-wide association study; utricle; vestibular ganglia; vestibular sensory evoked potential; vestibular system.


Figures

FIG. 1
FIG. 1
VsEP characterization of HMDP mice reveals variation in afferent vestibular signaling among inbred strains. Mean ± standard error (SE) is shown for VsEP threshold.
FIG. 2
FIG. 2
GWAS results using 35 HMDP strains phenotyped with VsEPs. A Manhattan plot showing the association p values (−log10 transformed) as a function of SNP position in the genome. The analysis was performed using 189,613 SNPs with a minor allele frequency >5 %. Each chromosome is plotted on the x-axis in alternating brown and blue colors. SNP rs29632020 on Chr. 18 approached the predetermined genome-wide significance threshold when analyzing VsEP threshold (red line; −logP = 5.34). B Regional plot on Chr. 18 centered on the peak SNP rs29632020 (purple diamond; p = 4.58E−06). C, D Manhattan and regional plots, respectively, using VsEP amplitude as the trait. The regional plot shows Slc12a2, a Na-K-2Cl co-transporter known to play a critical role in endolymphatic homeostasis in the otic vesicle, in the association interval. The positions of all RefSeq genes are plotted using genome locations (NCBI’s Build37 genome assembly). SNPs are colored based on their linkage disequilibrium (LD) with the peak SNP: red SNPs in LD at r 2 > 0.8, orange SNPs in LD at r 2 > 0.6, and green SNPs in LD at r 2 > 0.4.
FIG. 3
FIG. 3
Genetic variation in the Dcc affect VsEP threshold. Mice heterozygous for the Dcc knockout allele have elevated VsEP thresholds. Mean VsEP thresholds for 6-week-old Dcc +/− heterozygotes (−9.68 dB, SE = 0.42) showed statistically significant elevations in mean VsEP threshold relative to WT littermates (−11.86 dB, SE = 0.62) (t test t(20) = 2.9, p = 0.013, n = 11/group). B A statistically significant difference of −2.16 dB between the mean thresholds of group AA (mean −8.13 dB) and group CC (mean −10.29 dB) (t test t(202) = 2.34, p = 0.019) shows the variation of the strains for VsEP threshold as a function of genotype at peak SNP rs29632020. AA: AKR/J, BXH10/TyJ, BXH19/TyJ, BXH22/KccJ, BXH8/TyJ, C3H/HeJ, C57L/J, CBA/J, DBA/2J, NON/Ltj, NZW/LacJ, SEA/GnJ, SJL/J, SWR/J (n = 70). CC: A/J, AXB1/PgnJ, AXB13/PgnJ, m AXB15/PgnJ, AXB19a/PgnJ, AXB23/PgnJ, AXB6/PgnJ, AXB8/PgnJ, Balb/cByJ, Balb/cJ, BXA12/PgnJ, BXA13/PgnJ BXA14/PgnJ, BXA16/PgnJ, BXA25/PgnJ, BXA4/PgnJ, BXA7/PgnJ, BXD75/RwwJ, BXD84/RwwJ, BXH14/TyJ, BXH6/TyJ, BXH2/TyJ, BXH7/Tyj, BXH9/TyJ, C57BL/6J, CXB1/ByJ, CXB11/HiAJ, CXB2/ByJ, CXB9/HiAJ, FVB/NJ, LG/J, MRL/MpJ, NOR/LtJ, PL/J, RIIIS/J, NOD/ShiLtJ, BXH2/TyJ (n = 185).
FIG. 4
FIG. 4
Dcc is expressed in the developing vestibular system at E15.5. AC In situ hybridization reveals expression of Dcc in the vestibular ganglia and vestibular epithelium. G, H Dcc expression and Tuj1 immunostaining of vestibular ganglia using adjacent frozen section blocks; Alexa Fluor-594 was used to show the background in red. I The plane of sections. C cochlea, LC lateral crista, S saccule, U utricle, VG vestibular ganglia.
FIG. 5
FIG. 5
Dcc expression in the vestibular tissues of adult mice. A, D Micrographs showing crista and utricle of WT mice (×20 magnification). Boxes outline areas of higher power images in B, C, E, and F. B, E Dcc detected in the crista ampullaris and utricle of 6-week-old mice. Dcc expression was seen on neuronal cell bodies at the base of the utricle (arrow) and on the projections of neurons to the crista ampullaris and utricle (arrowheads). C, F Crista ampullaris and utricle of adjacent sections were treated with Dcc blocking peptide. Scale bar 40 μm for A and D, and 10 μm for B, C, E, and F.
FIG. 6
FIG. 6
Quantitative real-time PCR revealed 3.75-fold higher Dcc expression in adult (6-week-old) WT mice (0.435) as compared to adult Dcc heterozygotes (0.116). B The amplification plot for Dcc +/− and WT samples (n = 3 per group).
FIG. 7
FIG. 7
Dose-dependent effect of Dcc on utricular synapse formation. AE Utricles from Dcc −/−, Dcc +/−, and WT mice immunostained for the presynaptic marker CtBP2 show a progressive decrease in CtBP2 puncta. Scale bar = 5 μm. F, G Micrographs representatives of the vestibular ganglion cells of the WT and Dcc −/− mice show missing cells in Dcc knockouts (n = 3 per group). H, I Micrographs show abnormal utricular hair cells innervation of Dcc −/− as compared to WT controls (n = 3 per group). B Quantification of mean CtBP2 foci from Dcc −/−, Dcc +/−, and WT mice at P0 and 6 weeks of age (n = 4 per group) per 100-μm2 area. *p < 0.05. Error bars ± 1 SE. C Vestibular ganglion cell count at P0. Superior (SVG) and inferior vestibular ganglia (IVG) cell counts revealed a statistically significant decrease for Dcc −/− mice in comparison to Dcc +/−, and WT mice (n = 6 per group). There was no statistically significant difference in mean cell body count of the Dcc +/− and WT mice. *p < 0.05. Error bars ± 1 SE.
FIG. 8
FIG. 8
AI Whole-mount TuJ1-stained utricle and crista from Dcc −/−, Dcc +/−and WT embryos. Morphological changes of Dcc −/− mutants are shown as disorganized axons or absence of axons of the utricle and crista at E14.5, E16.6, and E18.5 (n = 3/group). Scale bar 200 μm. JO Whole-mount TuJ1-stained crista with two phenotypic variation for Dcc +/− mutants. Dcc +/− mice in some instances showed axonal organization similar to WT mice (K, N). The other Dcc +/− mice had reduced axonal density in comparison to WT mice (L, O). For consistency, ~22 confocal optical sections, spanning a tissue thickness of ~16 μm, were collected for each sample (n = 4/group). G, H Frozen sections (sagittal cut) of utricle stained with TuJ1 and Hoechst 33342 did not show any identifiable difference in neuron projection pattern between the Dcc +/− and WT mice (n = 4/group). Scale bar 40 μm for AC, G, and H. Scale bar 100 μm for DF.

Similar articles

Cited by

References

    1. Abbas L, Whitfield TT. Nkcc1 (Slc12a2) is required for the regulation of endolymph volume in the otic vesicle and swim bladder volume in the zebrafish larva. Development. 2009;136:2837–2848. doi: 10.1242/dev.034215. - DOI - PMC - PubMed
    1. Bennett BJ, Farber CR, Orozco L, Kang HM, Ghazalpour A, Siemers N, Neubauer M, Neuhaus I, Yordanova R, Guan B, et al. A high-resolution association mapping panel for the dissection of complex traits in mice. Genome Res. 2010;20:281–290. doi: 10.1101/gr.099234.109. - DOI - PMC - PubMed
    1. Berndt SI, Sampson J, Yeager M, et al. Large-scale fine mapping of the HNF1B locus and prostate cancer risk. Hum Mol Genet. 2011;16:3322–3329. doi: 10.1093/hmg/ddr213. - DOI - PMC - PubMed
    1. Bush WS, Moore JH. Chapter 11: Genome-wide association studies. PLoS Comput Biol. 2012;8:e1002822. doi: 10.1371/journal.pcbi.1002822. - DOI - PMC - PubMed
    1. Civelek M, Lusis AJ. Systems genetics approaches to understand complex traits. Nat Rev Genet. 2014;15:34–48. doi: 10.1038/nrg3575. - DOI - PMC - PubMed