. 2016 Oct;22(10):1592-603.
doi: 10.1261/rna.056895.116. Epub 2016 Aug 18.

An integrative transcriptomics approach identifies miR-503 as a candidate master regulator of the estrogen response in MCF-7 breast cancer cells

Affiliations

An integrative transcriptomics approach identifies miR-503 as a candidate master regulator of the estrogen response in MCF-7 breast cancer cells

Jeanette Baran-Gale et al. RNA. 2016 Oct.

Abstract

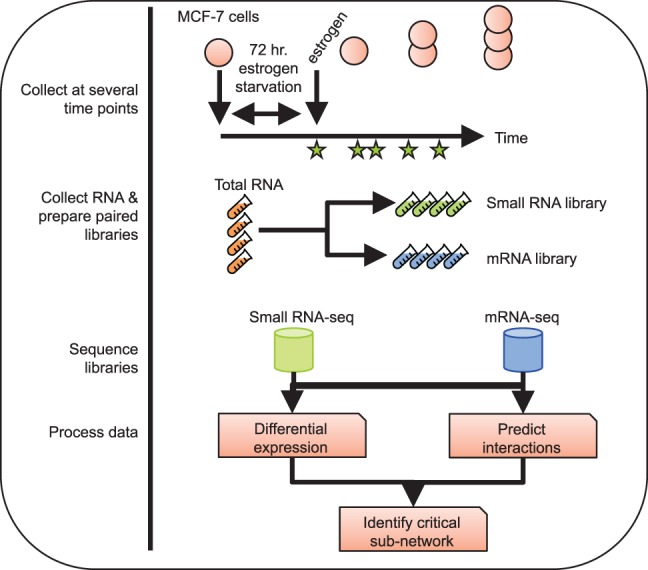
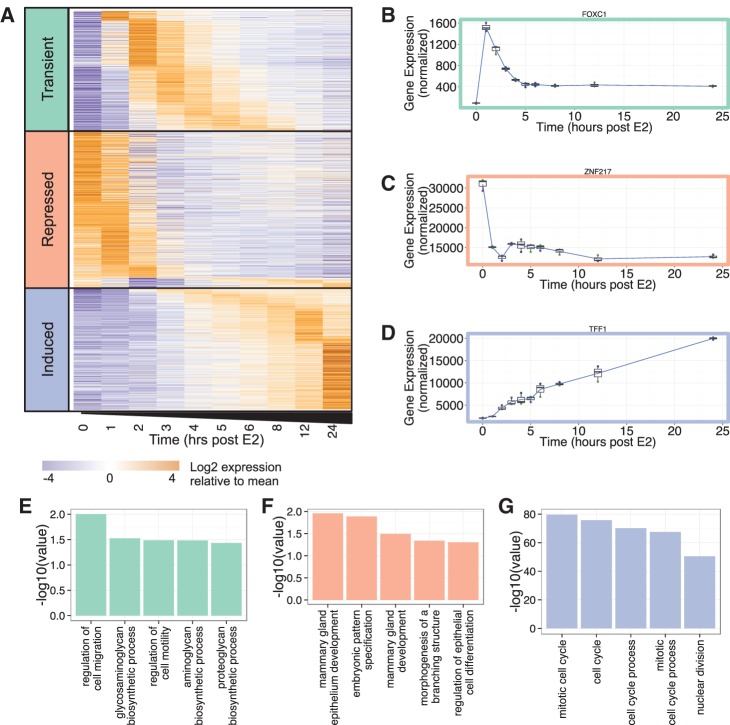
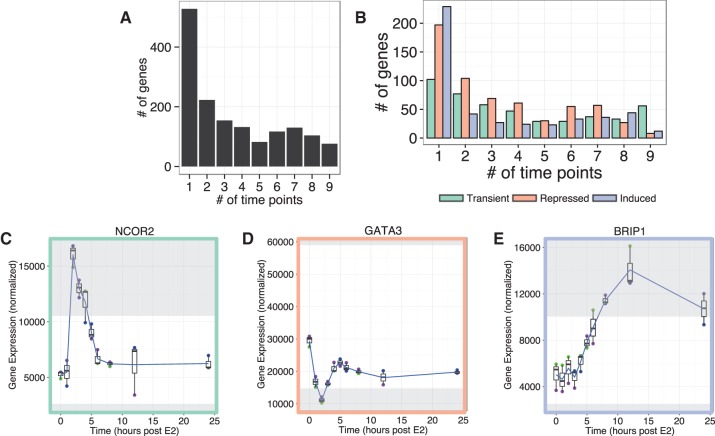
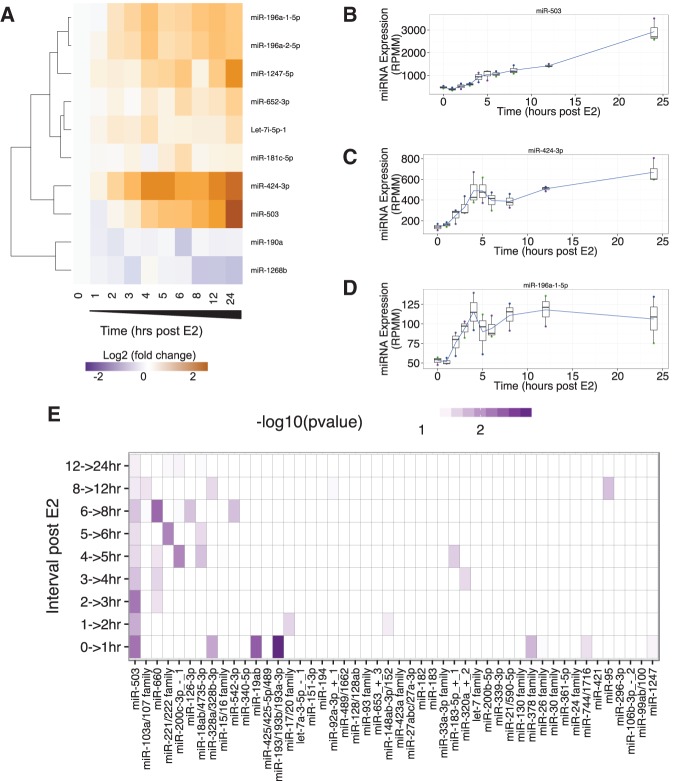
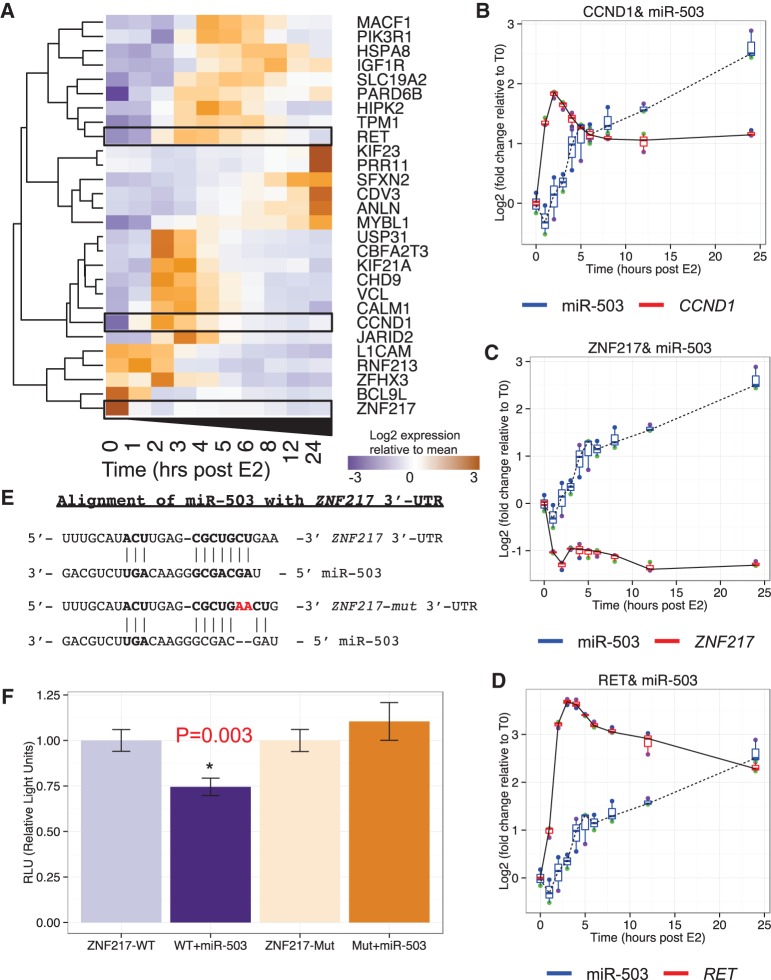
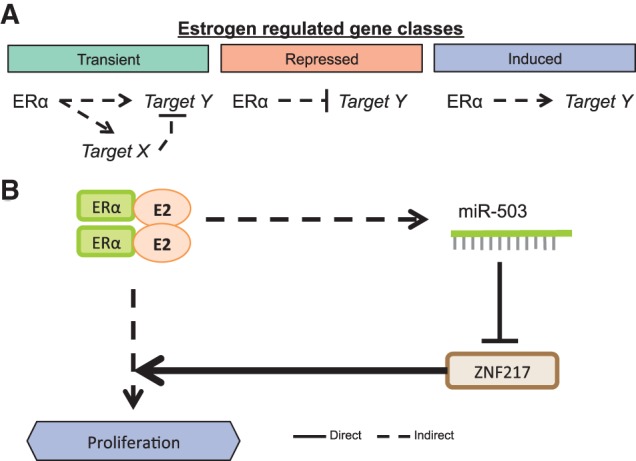
Estrogen receptor α (ERα) is an important biomarker of breast cancer severity and a common therapeutic target. In response to estrogen, ERα stimulates a dynamic transcriptional program including both coding and noncoding RNAs. We generate a fine-scale map of expression dynamics by performing a temporal profiling of both messenger RNAs (mRNAs) and microRNAs (miRNAs) in MCF-7 cells (an ER+ model cell line for breast cancer) in response to estrogen stimulation. We identified three primary expression trends-transient, induced, and repressed-that were each enriched for genes with distinct cellular functions. Integrative analysis of mRNA and miRNA temporal expression profiles identified miR-503 as the strongest candidate master regulator of the estrogen response, in part through suppression of ZNF217-an oncogene that is frequently amplified in cancer. We confirmed experimentally that miR-503 directly targets ZNF217 and that overexpression of miR-503 suppresses MCF-7 cell proliferation. Moreover, the levels of ZNF217 and miR-503 are associated with opposite outcomes in breast cancer patient cohorts, with high expression of ZNF217 associated with poor survival and high expression of miR-503 associated with improved survival. Overall, these data indicate that miR-503 acts as a potent estrogen-induced candidate tumor suppressor miRNA that opposes cellular proliferation and has promise as a novel therapeutic for breast cancer. More generally, our work provides a systems-level framework for identifying functional interactions that shape the temporal dynamics of gene expression.

Keywords: ZNF217; breast cancer; estrogen receptor α (ERα); gene expression dynamics; miR-503; microRNAs.


Figures

FIGURE 1.
FIGURE 1.
Experimental design. MCF-7 cells were cultured in stripped media for 72 h, then 10 nM E2 was added to the media. RNA was harvested at 0, 1, 2, 3, 4, 5, 6, 8, 12, and 24 h post E2, and paired small RNA and mRNA-seq libraries were generated. Each data set was subject to differential expression analysis, and interactions were predicted between miRNAs and target mRNAs.
FIGURE 2.
FIGURE 2.
Gene expression response to estrogen stimulation. (A) The expression profile of 1546 mRNAs that have a significant (adjusted P-value <0.05) greater than or equal to twofold change at one or more time points in response to estrogen stimulation, and a mean normalized expression of at least 500 across the time series. Genes are clustered into three classes (transient, repressed, and induced). (B) Expression profile of FOXC1, an example of a transient gene. (C) Expression profile of ZNF217, an example of a repressed gene. (D) Expression profile of TFF1, an example of an induced gene. All plots show the mean of three biological replicates as a blue line with a box and whisker plot showing the variation in normalized expression among the replicates. (E) Selected results from Gene Ontology analysis of genes in the transient class. (F) Selected results from Gene Ontology analysis of genes in the repressed class. (G) Selected results from Gene Ontology analysis of genes in the induced class.
FIGURE 3.
FIGURE 3.
Most genes reach greater than or equal to twofold change at few and disparate time points. (A) The number of time points during the 24 h collection for which each of the 1546 estrogen-responsive genes reaches a greater than or equal to twofold change from time zero. (B) The number of time points during the 24 h collection for which genes within the three classes reach a greater than or equal to twofold change from time zero. (C) The expression profile of NCOR2, a representative gene from the transient class, reaches greater than or equal to twofold change from time zero at three of the time points. (D) The expression profile of GATA3, a representative gene from the repressed class, reaches greater than or equal to twofold change from time zero at one time point. (E) The expression profile of BRIP1, a representative gene from the induced class, reaches greater than or equal to twofold change from time zero at three of the time points. All plots show the mean of three biological replicates as a blue line with box and whisker plots showing the variation in normalized expression among the replicates, and regions greater than or equal to twofold different than time zero are shaded in gray.
FIGURE 4.
FIGURE 4.
miRNA expression response to estrogen stimulation. (A) The expression profile of 10 miRNAs that have a ≥1.5 mean fold change of at least one time point in response to estrogen stimulation and a mean normalized expression of at least 50 RPMM. The expression profiles of miRNAs were clustered using a hierarchical clustering method. (B) Expression profile of the strongest responding miRNA, miR-503. (C) Expression profile of miR-424-3p. (D) Expression profile of miR-196a-1-5p. All plots (BD) show the mean of three biological replicates as a blue line with box and whisker plots showing the variation in normalized expression among the replicates. (E) This plot shows the −Log10(uncorrected P-value) of enrichment for each miRNA family among the genes that is characteristic of the change in expression between each time interval. miRNA families on the x-axis are sorted by decreasing significance (sum across all time intervals).
FIGURE 5.
FIGURE 5.
Potential miR-503 targets. (A) The expression profile of 28 miR-503 targets mRNAs that are characteristic of the difference in gene expression between consecutive time points. The expression profiles of miRNAs were clustered using a hierarchical clustering method. (B) Expression profile of miR-503 and validated target, CCND1. (C) Expression profile of miR-503 and predicted target, ZNF217. (D) Expression profile of miR-503 and predicted target, RET. All plots (BD) show the mean of three biological replicates as a blue line with box and whisker plots showing the variation in log2 (fold change) between replicates. (E) miR-503 target site in the ZNF217 3′-UTR. A dual-luciferase reporter was used to validate the response of ZNF217 to miR-503. The reporter was mutated by inserting two A's (red) to disrupt the seed region binding of miR-503. (F) Response of the ZNF217 reporter and mutant reporter with and without 10 nM miR-503 mimic. Significance assessed using a Student's t-test.
FIGURE 6.
FIGURE 6.
Summary. (A) Potential mechanism behind regulation of the three classes of estrogen-responsive genes. (B) Summary mechanism showing the interaction of the estrogen-responsive genes ESR1 and ZNF217 and the estrogen-responsive miRNA miR-503.

References

    1. Alon U. 2007. Network motifs: theory and experimental approaches. Nat Rev Genet 8: 450–461. - PubMed
    1. Antonov AV. 2011. BioProfiling.de: analytical web portal for high-throughput cell biology. Nucleic Acids Res 39: W323–W327. - PMC - PubMed
    1. Antonov AV, Knight RA, Melino G, Barlev NA, Tsvetkov PO. 2013. MIRUMIR: an online tool to test microRNAs as biomarkers to predict survival in cancer using multiple clinical data sets. Cell Death Differ 20: 367. - PMC - PubMed
    1. Baran-Gale J, Fannin EE, Kurtz CL, Sethupathy P. 2013. β-Cell 5′-shifted isomiRs are candidate regulatory hubs in type 2 diabetes. PLoS One 8: e73240. - PMC - PubMed
    1. Bhat-Nakshatri P, Wang G, Collins NR, Thomson MJ, Geistlinger TR, Carroll JS, Brown M, Hammond S, Srour EF, Liu Y, et al. 2009. Estradiol-regulated microRNAs control estradiol response in breast cancer cells. Nucleic Acids Res 37: 4850–4861. - PMC - PubMed

Publication types