. 2016 Aug 30;113(35):9816-21.
doi: 10.1073/pnas.1611189113. Epub 2016 Aug 18.

Clathrin light chains' role in selective endocytosis influences antibody isotype switching

Affiliations

Clathrin light chains' role in selective endocytosis influences antibody isotype switching

Shuang Wu et al. Proc Natl Acad Sci U S A. .

Abstract

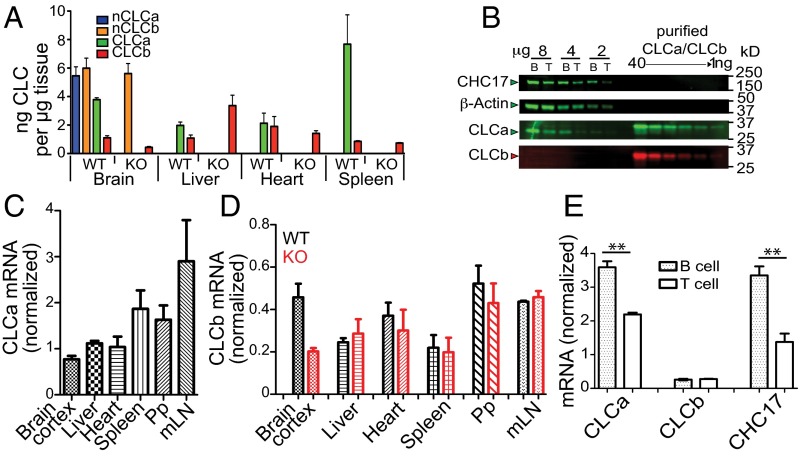
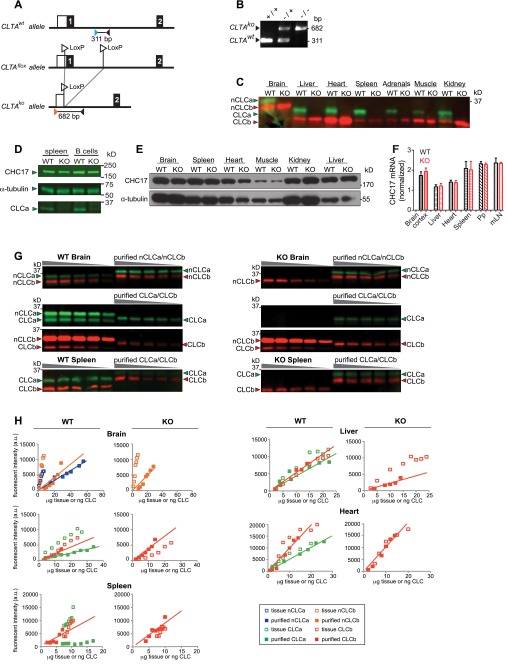
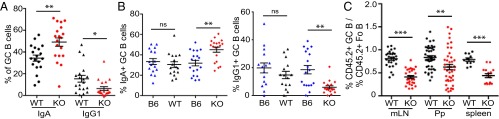
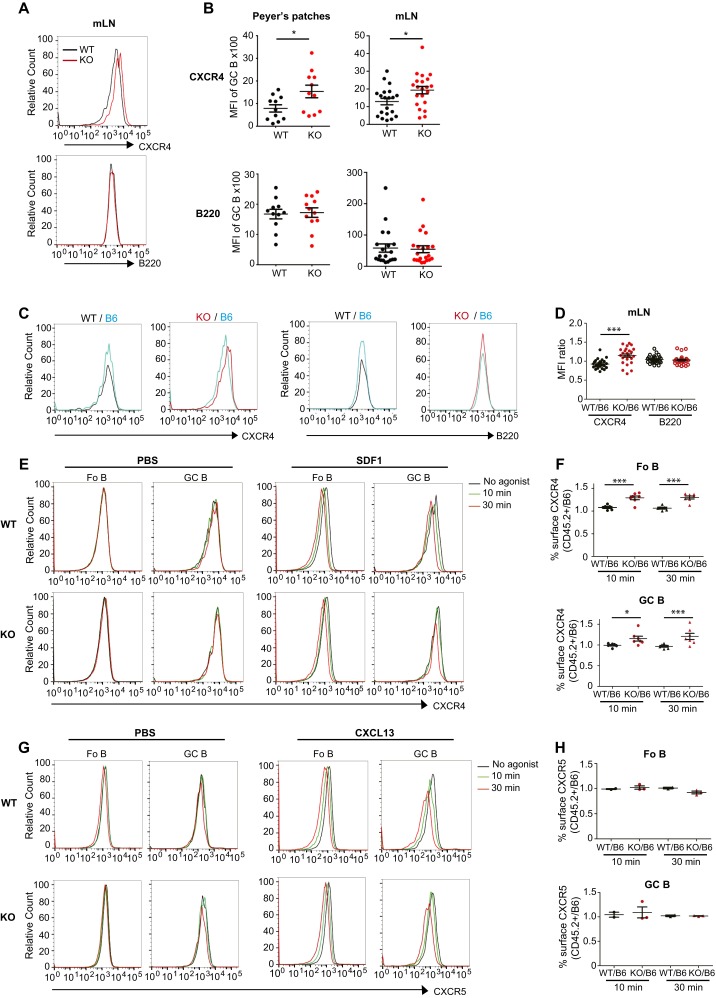
Clathrin, a cytosolic protein composed of heavy and light chain subunits, assembles into a vesicle coat, controlling receptor-mediated endocytosis. To establish clathrin light chain (CLC) function in vivo, we engineered mice lacking CLCa, the major CLC isoform in B lymphocytes, generating animals with CLC-deficient B cells. In CLCa-null mice, the germinal centers have fewer B cells, and they are enriched for IgA-producing cells. This enhanced switch to IgA production in the absence of CLCa was attributable to increased transforming growth factor β receptor 2 (TGFβR2) signaling resulting from defective endocytosis. Internalization of C-X-C chemokine receptor 4 (CXCR4), but not CXCR5, was affected in CLCa-null B cells, and CLC depletion from cell lines affected endocytosis of the δ-opioid receptor, but not the β2-adrenergic receptor, defining a role for CLCs in the uptake of a subset of signaling receptors. This instance of clathrin subunit deletion in vertebrates demonstrates that CLCs contribute to clathrin's role in vivo by influencing cargo selectivity, a function previously assigned exclusively to adaptor molecules.

Keywords: G protein-coupled receptors; TGFβ; antibody isotype switch; clathrin light chain; endocytosis.


Conflict of interest statement

The authors declare no conflict of interest.

Figures

Fig. 1.
Fig. 1.
CLC isoform expression in tissues from WT and CLCa-null mice. (A) Concentrations of CLC isoforms in indicated tissues from WT and CLCa-null (KO) mice (mean ± SEM, n = 3) determined by quantitative immunoblotting (Fig. S1 G and H). nCLCa and nCLCb are neuronal splice variants. (B) B and T lymphocytes isolated from WT murine spleens were lysed and analyzed by immunoblotting for expression of proteins indicated on the left. CLCa (green) and CLCb (red) signals were compared with dilutions of purified human CLCs (total protein per lane indicated above). Migration position of molecular mass markers [kilodaltons (kDa)] is indicated. (C) CLCa mRNA levels in indicated tissues from WT mice, normalized to mRNA levels for hypoxanthine guanine phosphoribosyl transferase 1 (HPRT1) (mean ± SEM, n = 3). mLN, mesenteric lymph node; Pp, Peyer’s patches. (D) CLCb mRNA levels in indicated tissues from WT and KO mice, normalized to mRNA levels for HPRT1 (mean ± SEM of n = 3, except n = 2 for brain cortex). (E) CLCa, CLCb, and CHC17 mRNA levels in B and T cells isolated from WT spleens, normalized to HPRT1 (mean ± SEM of n = 3, **P < 0.01; P values, unpaired t test).
Fig. S1.
Fig. S1.
Genetic deletion of CLCa in mice and quantification of CLC isoforms in murine tissues. (A) CLTAflox genetic construct for targeted deletion of CLTA by ACTB-Cre–mediated deletion of exon 1 flanked by LoxP sites (CLTAko). Exons are numbered and are indicated by black boxes. A white box indicates the 5′ untranslated region. Primers are designated by orange, blue, and black triangles. Black lines below each allele denote PCR products generated from the CLTA+ (311 bp) and CLTAko (682 bp) alleles. (B) PCR analysis of genomic DNA from WT (+/+, CLTA+/+), heterozygous (−/+, CLTAko/+), and homozygous knockout (KO) (−/−, CLTAko/ko) mice. (C) Indicated tissues from homozygous CLCa WT and KO (CLTAko/ko) littermates were homogenized and analyzed by immunoblotting for CLCa and CLCb using isoform-specific antibodies with CLCa in green and CLCb in red. nCLCa and nCLCb are the neuron-specific splice variants. Migration position of molecular mass of marker [kilodaltons (kDa)] is indicated on the right. (D) Total splenocytes and B cells isolated from spleens of WT or CLCa-null (KO) mice were lysed and analyzed by immunoblotting for proteins indicated by arrowheads. Migration positions of molecular mass of markers [kilodaltons (kDa)] is indicated on the right. (E) Indicated tissues from homozygous WT and KO littermates were homogenized and immunoblotted for CHC17 and α-tubulin. For each tissue analyzed, equal protein amounts of homogenate from WT or KO mice were compared. (F) Level of CHC17 mRNA measured by quantitative PCR analysis of the indicated tissues (mLN, mesenteric lymph node; Pp, Peyer’s patches) from WT and KO mice. Expression level was normalized to mRNA encoding hypoxanthine guanine phosphoribosyl transferase 1 (mean ± SEM of n = 3, except n = 2 for brain cortex). (G) Representative immunoblots for quantification of CLC isoforms in homogenates of brain tissue and spleen cells from WT and KO mice, detected using isoform-specific antibodies with CLCa in green and CLCb in red. nCLCa and nCLCb are the neuron-specific splice variants. Tissue samples were serially diluted and compared with serial dilutions of purified recombinantly produced CLCs to calibrate the blotting signal. The His-tag on the recombinant CLCs slows their migration compared with the untagged equivalents in the homogenates. Migration position of molecular mass markers [kilodaltons (kDa)] is indicated on the left. (H) Representative plots of fluorescence signals generated from isoform-specific immunoblots of the indicated tissues (no lines) or purified proteins (lines drawn for slope calculation). The concentrations reported in Fig. 1A were established from n = 3 of these analyses for each tissue.
Fig. 2.
Fig. 2.
CLCa-null mice have an elevated frequency of IgA-expressing B cells and a reduced proportion of germinal center (GC) B cells. (A) Frequency of IgA- and IgG1-expressing GC B cells in Peyer's patches (Pp) of WT and CLCa-null (KO) littermates (mean ± SEM, n = 19, *P < 0.05, **P < 0.01; P values, unpaired t test). (B) Frequency of IgA- and IgG1-expressing GC B cells derived from C57BL/6 (B6) donor or KO and WT littermate donors in Pp of mixed chimeric mice transplanted with 50% WT B6 plus 50% KO or WT littermate bone marrow (mean ± SEM, n > 15 from more than four pairs of matched KO and WT donors; **P < 0.01, ns, not significant; P values, one-way ANOVA). (C) Percentage of donor (WT or KO CD45.2+) cells in the GC B compartment compared with their percentage in the corresponding follicular (Fo B) compartment in mixed bone marrow chimeras [mean ± SEM; n > 27 for mesenteric lymph node (mLN), n > 42 for Pp (33), n > 11 for spleen, **P < 0.01, ***P < 0.001; P values, unpaired t test].
Fig. S2.
Fig. S2.
Flow cytometry gating strategy for analysis of follicular and germinal center B cells. (A) Lymphocytes isolated from Peyer’s patches of WT and CLCa-null (KO) littermates were immunolabeled for the markers indicated. B220-positive cells were first gated on CD95high and IgDlow expression and then gated on GL7high expression to identify germinal center B cells (GC B). Follicular B cells (Fo B) were identified by CD95low and IgDhigh expression. (B) Representative flow cytometric analysis of the frequency of IgA- and IgG1-expressing GC B cells (gated as in A) in Peyer's patches of WT and KO littermates, detected by staining for each antibody isotype. (C) Mixed bone marrow chimeras (WT/B6 and KO/B6) were generated by injection of cells from WT or KO mice (CD45.2+) mixed in a 1:1 ratio with bone marrow cells from C57BL/6 (B6) mice (CD45.1+ CD45.2+) into irradiated recipient B6 mice (CD45.1+). GC and Fo B-cell populations from Peyer’s patches of chimeric animals were identified based on the gating scheme shown in A, and a representative analysis of the percentage of cells derived from each donor, assessed by labeling for CD45.1 and CD45.2 surface markers, is shown. (D) Representative flow cytometric analysis of the frequency of IgA- and IgG1-producing GC B cells in Peyer's patches shown for each donor population in the WT/B6 (Top pair) or KO/B6 (Bottom pair) mixed chimeras. For BD, numbers indicate the percentage of cells in the respective quadrant or gate.
Fig. 3.
Fig. 3.
CLCa regulates TGFβR2 internalization and signaling. (A) Mean fluorescence intensity (MFI) of TGFβR2 surface labeling of follicular (Fo) and germinal center (GC) B cells from Peyer’s patches (Pp) and total B cells from spleen of WT and CLCa-null (KO) littermates (n > 11 for Pp and n = 5 for spleen, *P < 0.05, **P < 0.01; P values, unpaired t test). (B) Ratio of the MFI of WT or KO donor cells (CD45.2+) to the MFI of B6 donor cells (CD45.1+CD45.2+) for surface labeling of TGFβR2 for Fo B and GC B from WT/B6 and KO/B6 chimeras (mean ± SEM of n = 10 from at least three pairs of different donors for mixed chimera mice,**P < 0.01, ***P < 0.001; P values, unpaired t test). (C) TGFβR1 and TGFβR2 mRNA levels in spleen B cells of WT and KO littermates, normalized to mRNA levels for hypoxanthine guanine phosphoribosyl transferase 1 (mean ± SEM of n = 3). (D) Lysates (equal protein loading) of B cells from WT and KO littermates were analyzed by immunoblotting for TGFβR2 and other proteins indicated by arrowheads on the left. Migration position of molecular mass markers [kilodaltons (kDa)] is indicated. (E) HEK293T cells were transiently transfected with TGFβR2-IRES-GFP and siRNA targeting CHC17 (blue), CLCa and CLCb (red, CLCab), or scrambled siRNA (control). Percent TGFβR2 internalization at 37 °C over time was quantified after labeling with primary antibody at 4 °C and using a secondary antibody to detect residual surface receptor relative to cells maintained at 4 °C (mean ± SEM of n = 5 independent experiments, ***P < 0.001; P values, two-way ANOVA followed by Bonferroni post test). (F) Internalization of endogenous transferrin receptor (TfR) at 37 °C over time analyzed by flow cytometry for cells treated as in E (mean ± SEM of n = 5 independent experiments, ***P < 0.001; P values, two-way ANOVA followed by Bonferroni post test). (G) Levels of pSmad2/3 and Smad2/3 in lysates of spleen or B cells from WT and KO littermates quantified by immunoblotting, normalized to CHC17 levels relative to total protein loaded (representative blots in Fig. S3 E and F) (n = 5 for total splenocytes and n = 2 for purified spleen B cells, *P < 0.05; P values, one-way ANOVA).
Fig. S3.
Fig. S3.
Expression of TGFβR2 and B220 detected by flow cytometry and analysis of TGFβR2 signaling. (A) Representative flow cytometry analysis of surface expression of TGFβR2 and B220 on germinal center (GC) and follicular (Fo) B cells from Peyer's patches (left) and total B cells from spleen (right) of WT and CLCa-null (KO) littermates (gating as in Fig. S2A). The x axes represent fluorescence intensities, and y axes are relative cell counts (normalized to the maximum cell count in each experiment). (B) Quantification of B220 surface fluorescent labeling from Peyer’s patches (left) and spleen (right) of WT and KO littermates. Data are presented as geometric mean fluorescent intensity (MFI) (n > 11 for Peyer’s patches and n = 7 for spleen. (C) Representative flow cytometry analysis of surface levels of TGFβR2 and B220 on GC B and Fo B cells in Peyer's patches from WT/B6 and KO/B6 chimera mice (produced as in Fig. S2C), separated by donor genotype (blue, B6; black, WT; red, KO; tinted peak, background staining). The x axes depict fluorescence intensities, and y axes depict cell count normalized to the maximum count. (D) The ratio of the MFI of WT or KO donor cells (CD45.2+) to the MFI of B6 donor cells (CD45.1+CD45.2+) for staining of B220 is shown for GC and Fo B cells (mean ± SEM of n = 10 from at least three pairs of different donors for WT/B6 and KO/B6 chimeras. (E and F) Total splenocytes and purified spleen B cells from WT and KO littermates were lysed and analyzed by immunoblotting for CHC17, CLCa, phosphorylated Smad2/3 (pSmad2/3) in E and total Smad2/3 in F. Representative blots are shown. Migration position of molecular mass markers is indicated [kilodaltons (kDa)].
Fig. 4.
Fig. 4.
CLCa-null B cells have increased CXCR4 surface levels and impaired ligand-induced CXCR4 internalization. (A) Ratios of the mean fluorescence intensity (MFI) of CXCR4 and B220 on WT or CLCa-null (KO) donor cells (CD45.2+) to MFIs on C57BL/6 (B6) (CD45.1+CD45.2+) donor cells for germinal center (GC) B cells from lymphoid tissues indicated from WT/B6 and KO/B6 chimeras (mean ± SEM; n = 42 for Peyer’s patches, n > 11 for spleen, from at least three pairs of different donors for mixed chimera mice, **P < 0.01, ***P < 0.001; P values, unpaired t test). (B) MFI ratios for CXCR5 and B220 on WT or KO donor follicular (Fo B) or GC B cells (CD45.2+) relative to B6 donor B-cell populations (CD45.1+CD45.2+) from mesenteric lymph nodes (mLNs) (mean ± SEM; n > 11). (C) Percent CXCR4 internalized at 37 °C over time after addition of SDF1 (relative to surface CXCR4 on control cells similarly treated with PBS) for Fo B and GC B cells from mLNs of WT or KO mice (mean ± SEM of n = 5 WT and n = 6 KO from two independent experiments, *P < 0.05; P values, two-way ANOVA with Bonferroni post tests). (D) Percent CXCR5 internalized at 37 °C over time after addition of CXCL13 (relative to surface CXCR5 on control cells similarly treated with PBS) for Fo B and GC B cells from mLNs of WT or KO mice (mean ± SEM of n = 5 WT and n = 5 KO mice, from two independent experiments).
Fig. S4.
Fig. S4.
Assessment of CXCR4 and CXCR5 surface levels and internalization by flow cytometry. (A) Representative flow cytometry analysis of surface levels of CXCR4 or B220 on germinal center (GC) B cells from mesenteric lymph nodes (mLNs) of WT and CLCa-null (KO) littermates. (B) Mean fluorescence intensities (MFIs) of CXCR4 and B220 surface labeling of GC B cells from Peyer’s patches and mLN from multiple animals as in A (n > 11 for Peyer’s patches, n > 20 for mLN; *P < 0.05; P values, unpaired t test, KO compared with WT mice). (C) Representative flow cytometry analysis of surface levels of CXCR4 or B220 on GC B cells from Peyer’s patches in WT/B6 and KO/B6 chimeras, separated by donor genotype (blue, B6; black, WT; red, KO). (D) Ratios of the mean fluorescence intensity (MFI) of CXCR4 on WT or CLCa-null (KO) donor cells (CD45.2+) to CXCR4 on C57BL/6 (B6) (CD45.1+CD45.2+) donor cells for germinal center (GC) B cells from mLNs of WT/B6 and KO/B6 chimeras (mean ± SEM; n > 24, from at least three pairs of different donors for mixed chimera mice, ***P < 0.001; P values, unpaired, t test). (E) B cells isolated from mLNs of WT and KO littermates were treated with PBS for 30 min at 37 °C (no agonist) or 100 ng/mL SDF1 stromal cell-derived factor 1 (SDF1) for 10 or 30 min at 37 °C and then immediately chilled, and CXCR4 surface levels on GC and follicular (Fo) B cells were assessed by flow cytometry. One representative experiment is shown. The x axes represent fluorescence intensities, and y axes represent cell count normalized to the maximum count. (F) B cells isolated from WT/B6 or KO/B6 chimeras were treated with 100 ng/mL stromal cell-derived factor 1 (SDF1) for 10 or 30 min at 37 °C and then immediately chilled, and CXCR4 surface levels on GC and Fo B cells were assessed by flow cytometry. Ratio of MFIs of surface CXCR4 on WT or KO donor cells (CD45.2+) to surface CXCR4 on B6 donor cells (CD45.1+CD45.2+) from each chimera is shown for the indicated time points (mean ± SEM of n = 6 WT and n = 7 KO mice from four independent experiments, *P < 0.05, ***P < 0.001; P values, two-way ANOVA with Bonferroni post tests). (G) B cells isolated from the mLNs of WT and KO littermates were treated with PBS for 30 min at 37 °C (no agonist) or 1 μg/mL CXCL13 for 10 or 30 min at 37 °C, after which they were immediately chilled, and CXCR5 surface levels on GC and Fo B cells were assessed by flow cytometry. One representative experiment is shown. The x axes indicate fluorescence intensities, and y axes represent relative cell counts normalized to the maximum count. (H) B cells isolated from WT/B6 or KO/B6 chimeras were treated with CXCL13 for 10 or 30 min at 37 °C, after which they were immediately chilled, and CXCR5 surface levels on GC and Fo B cells were assessed by flow cytometry. Ratio of MFIs of surface CXCR5 on WT or KO donor cells (CD45.2+) to surface CXCR5 on B6 donor cells (CD45.1+CD45.2+) from each chimera is shown for the indicated time points (mean ± SEM of n = 2 and n= 3 KO mice from two independent experiments).
Fig. 5.
Fig. 5.
CLC depletion impairs δ-opioid receptor internalization but does not affect β2-adrenergic receptor uptake. (A) Percent FLAG-tagged δ-opioid receptor (FLAG-DOR) or (B) transferrin receptor (TfR) internalized at 37 °C over time by stable transfectants expressing FLAG-DOR, treated with indicated siRNA targeting CHC17 (blue), CLCa and CLCb (red, CLCab), or scrambled siRNA (black, control) (mean ± SEM of n = 4 independent experiments, **P < 0.01, ***P < 0.001; P values, two-way ANOVA followed by Bonferroni post test). (C) Percent FLAG-tagged β2-adrenergic receptor (FLAG-β2AR) or (D) TfR internalized at 37 °C over time by stable transfectants expressing FLAG-β2AR, treated with siRNA indicated as in A and B (mean ± SEM of n = 3 independent experiments, **P < 0.01, ****P < 0.0001; P values, two-way ANOVA followed by Bonferroni post test). FLAG-tagged receptor uptake was measured on cells treated with agonist (DPDPE for FLAG-DOR and isopreteronol for FLAG-β2AR) relative to cells treated with PBS, and TfR uptake was relative to untreated cells labeled with primary antibody maintained at 4 °C.
Fig. S5.
Fig. S5.
siRNA treatment of HEK293 stable transfectants expressing FLAG-tagged G protein-coupled receptors and representative flow cytometry data for receptor internalization assays. (A and B) HEK293 cells that stably expressed (A) FLAG-tagged β2-adrenergic receptor (FLAG-β2AR) or (B) FLAG-tagged δ-opioid receptor (FLAG-DOR) were treated with the siRNA targeting CHC17 or CLCa and CLCb (CLCab) or scrambled siRNA (Control) for 72 h, and then cell lysates were analyzed by immunoblotting for levels of the indicated proteins on the left. Migration position of molecular mass markers is indicated at the right [kilodaltons (kDa)]. (C and E) Representative flow cytometry analysis of receptor levels detected with anti-FLAG antibody on HEK293 cells stably expressing FLAG-tagged δ-opioid receptor (FLAG-DOR) or FLAG-tagged β2-adrenergic receptor (FLAG-β2AR) at indicated times after treatment at 37 °C with agonists (DPDPE for FLAG-DOR cells or isoproterenol for FLAG-β2AR cells). Black, time 0; green, 5 min; red, 20 min. Before exposure to agonist, cells were pretreated for 72 h with control siRNA or siRNA targeting CHC17 or CLCab, as indicated above each plot. The x axes indicate fluorescence intensities, and y axes represent relative cell counts normalized to the maximum count. (D and F) Representative flow cytometry analysis of endogenous transferrin receptor (TfR) surface levels on the siRNA-treated stable transfectants analyzed, respectively, in C and E (not agonist-treated), labeled with primary antibody to TfR at 4 °C at time 0, detected with secondary antibody at the indicated times after incubation at 37 °C. The x axes indicate fluorescence intensities, and y axes represent relative cell counts normalized to the maximum count.

Similar articles

Cited by

References

    1. Brodsky FM. Diversity of clathrin function: New tricks for an old protein. Annu Rev Cell Dev Biol. 2012;28:309–336. - PubMed
    1. Majeed SR, et al. Clathrin light chains are required for the gyrating-clathrin recycling pathway and thereby promote cell migration. Nat Commun. 2014;5:3891. - PMC - PubMed
    1. Huang F, Khvorova A, Marshall W, Sorkin A. Analysis of clathrin-mediated endocytosis of epidermal growth factor receptor by RNA interference. J Biol Chem. 2004;279(16):16657–16661. - PubMed
    1. Poupon V, et al. Clathrin light chains function in mannose phosphate receptor trafficking via regulation of actin assembly. Proc Natl Acad Sci USA. 2008;105(1):168–173. - PMC - PubMed
    1. Ferreira F, et al. Endocytosis of G protein-coupled receptors is regulated by clathrin light chain phosphorylation. Curr Biol. 2012;22(15):1361–1370. - PubMed

Publication types

MeSH terms

Substances