. 2016 Aug 19;353(6301):827-30.
doi: 10.1126/science.aad6970.

Cardiometabolic risk loci share downstream cis- and trans-gene regulation across tissues and diseases

Affiliations

Cardiometabolic risk loci share downstream cis- and trans-gene regulation across tissues and diseases

Oscar Franzén et al. Science. .

Abstract

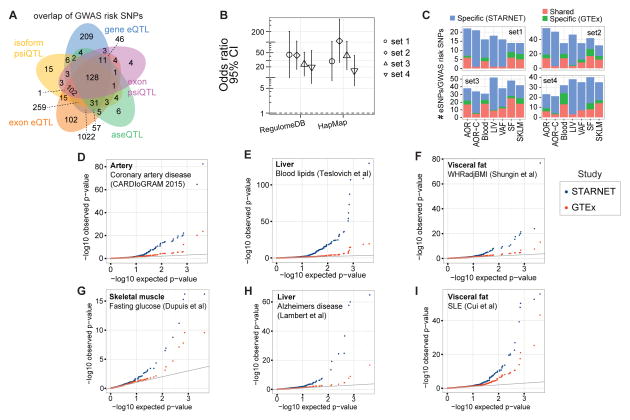
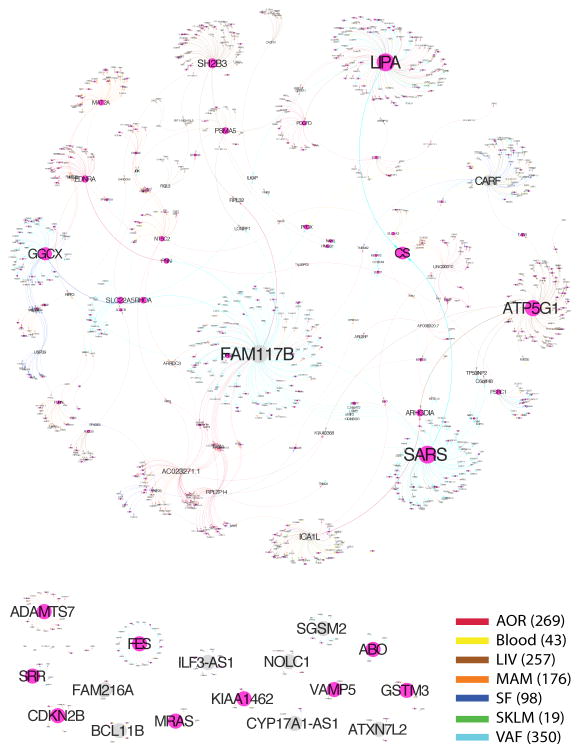
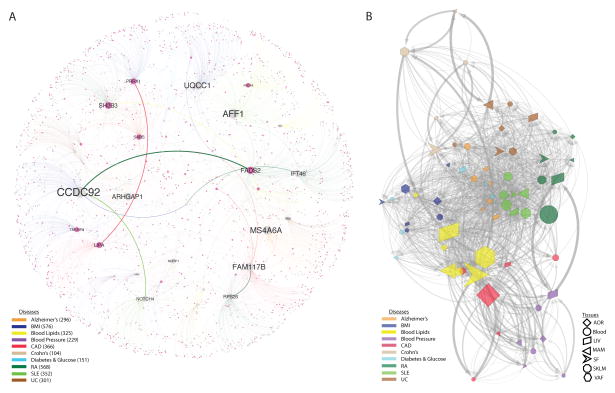
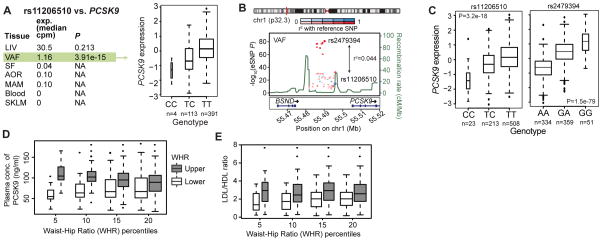
Genome-wide association studies (GWAS) have identified hundreds of cardiometabolic disease (CMD) risk loci. However, they contribute little to genetic variance, and most downstream gene-regulatory mechanisms are unknown. We genotyped and RNA-sequenced vascular and metabolic tissues from 600 coronary artery disease patients in the Stockholm-Tartu Atherosclerosis Reverse Networks Engineering Task study (STARNET). Gene expression traits associated with CMD risk single-nucleotide polymorphism (SNPs) identified by GWAS were more extensively found in STARNET than in tissue- and disease-unspecific gene-tissue expression studies, indicating sharing of downstream cis-/trans-gene regulation across tissues and CMDs. In contrast, the regulatory effects of other GWAS risk SNPs were tissue-specific; abdominal fat emerged as an important gene-regulatory site for blood lipids, such as for the low-density lipoprotein cholesterol and coronary artery disease risk gene PCSK9 STARNET provides insights into gene-regulatory mechanisms for CMD risk loci, facilitating their translation into opportunities for diagnosis, therapy, and prevention.


Figures

Fig. 1
Fig. 1. QTLs and disease-associated risk SNPs identified by GWAS
(A) Venn diagram showing 2,047/3,326 disease-associated risk SNPs from the NHGRI GWAS catalog overlapping with at least one form of STARNET e/psi/aseQTLs. (B) Odds ratios that STARNET eQTLs coincide with CAD-associated risk SNPs (Set 1, CARDIoGRAM-C4D, n=53; Set 2, CARDIoGRAM extended, n=150) (3), blood lipids (Set 3, n=35) (5), and metabolic traits (Set 4, n=132) (6, 8, 10, 12) versus blood eQTLs from RegulomeDB and HapMap. The y-axis shows odds ratios. Error bars, 95% confidence intervals. (C) Stacked bar plots comparing tissue-specific eQTLs from STARNET and GTEx (18) coinciding with disease-associated risk SNPs in the same Sets 1–4 as in (B). (D–I). Q-Q plots showing associations of tissue-specific STARNET (blue) and GTEx (18) (red) cis-eQTLs of disease-associated risk SNPs identified by GWAS for CAD (3) (D), blood lipids (5) (E), waist-hip ratio (12) (F), fasting glucose (6) (G), AD (24) (H), and SLE (14) (I).
Fig. 2
Fig. 2. A cis/trans gene-regulatory network of CAD risk SNPs
A main gene-regulatory network of cis-and trans-genes associated with 21/46 index SNPs for risk loci identified for CAD by meta-analysis in the CARDIoGRAM GWAS of CAD (3) inferred using a causal inference test (26).
Fig. 3
Fig. 3. Cis and trans gene regulation across CMDs and Alzheimer’s disease
(A) A pan-disease risk SNP cis/trans-gene regulatory network. Thirty-six top key disease drivers, including 33 cis-genes for risk SNPs identified for CMDs including CAD and AD by GWAS (–16, 24) were identified as having >100 downstream genes in any disease-specific network or belonging to the top 5 key drivers in the main regulatory gene network for each disease (table S11). Node (gene) and edge color indicate disease belonging. Edge thickness represents how frequent an edge is the shortest path between all pairs of network nodes. Node size reflects the number of downstream nodes in the network. RA, rheumatoid arthritis; SLE, systemic lupus erythematosus; UC, ulcerative colitis. (B) cis and trans gene regulation across disease/tissue pairs. Nodes represent unique disease-tissue pairs. Edges occur when a cis-gene in one node have downstream trans-genes present also in another node. Edge thickness defined as in (A). Node size reflects its centrality in the network: The position of the nodes in the network (i.e., layout) was derived from an edge weighted spring layout algorithm. The “weight” is defined as the number of trans genes that have a connection from the upstream node’s cis genes, normalized by the total number of trans genes between two connecting nodes — resulting in that highly connected nodes are positioned in the center of the network.
Fig. 4
Fig. 4. PCSK9 regulation in VAF, not LIV, increases risk for elevated LDL/HDL ratio
(A) PCSK9 was expressed in STARNET LIV and VAF but only associated with the CAD risk SNP rs11206510 in VAF (FDR<0.001). Box plot of allelic PCSK9 expression of the CAD risk SNP rs11206510 showing dosage effect of the T allele (P=3.91e-15; FDR=4e-04). (B) Regional plot of the PCSK9 locus. rs2479394, linked to plasma LDL levels by GWAS (5), acts independently of rs11206510 as the lead eQTL of PCSK9 expression in VAF. rs2479394 was not an eQTL of PCSK9 in STARNET LIV. (C) Box plots of allelic PCSK9 expression in VAF of rs11206510 and rs2479394 in a gene-tissue expression study of morbidly obese patients (fig. S29) (28). Box plots of PCSK9 levels (D) and ratios of LDL/HDL (E) in plasma isolated from the STARNET patients within the upper and lower 5th–20th percentile of waist-hip ratio (WHR) (PCSK9; 5th, P=8.0e-11; 10th, P=1.9e-11; 15th, P=5.9e-05; 20th, P=0.004: LDL/HDL ratio; 5th, P=0,007; 10th, P=0.001; 15th P=0.0005; 20th, P=0.0009.

References

    1. Hansson GK. Inflammation, atherosclerosis, and coronary artery disease. N Engl J Med. 2005;352:1685–1695. - PubMed
    1. Shulman GI. Ectopic fat in insulin resistance, dyslipidemia, and cardiometabolic disease. N Engl J Med. 2014;371:2237–2238. §. - PubMed
    1. Nikpay M, et al. A comprehensive 1,000 Genomes-based genome-wide association meta-analysis of coronary artery disease. Nat Genet. 2015;47:1121–1130. - PMC - PubMed
    1. Ehret GB, et al. Genetic variants in novel pathways influence blood pressure and cardiovascular disease risk. Nature. 2011;478:103–109. - PMC - PubMed
    1. Teslovich TM, et al. Biological, clinical and population relevance of 95 loci for blood lipids. Nature. 2010;466:707–713. - PMC - PubMed

Publication types

MeSH terms