

Elevated blood plasma levels of epinephrine, norepinephrine, tyrosine hydroxylase, TGFβ1, and TNFα associated with high-altitude pulmonary edema in an Indian population
- PMID: 27540296
- PMCID: PMC4982497
- DOI: 10.2147/TCRM.S111030
Elevated blood plasma levels of epinephrine, norepinephrine, tyrosine hydroxylase, TGFβ1, and TNFα associated with high-altitude pulmonary edema in an Indian population
Abstract
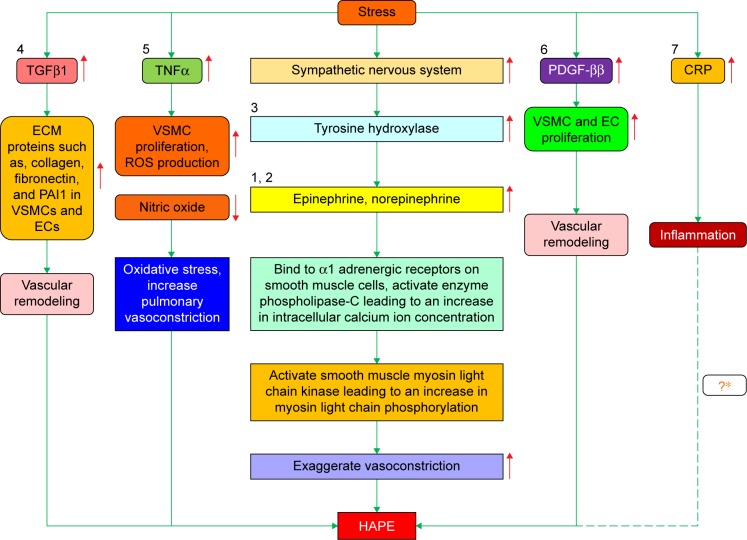
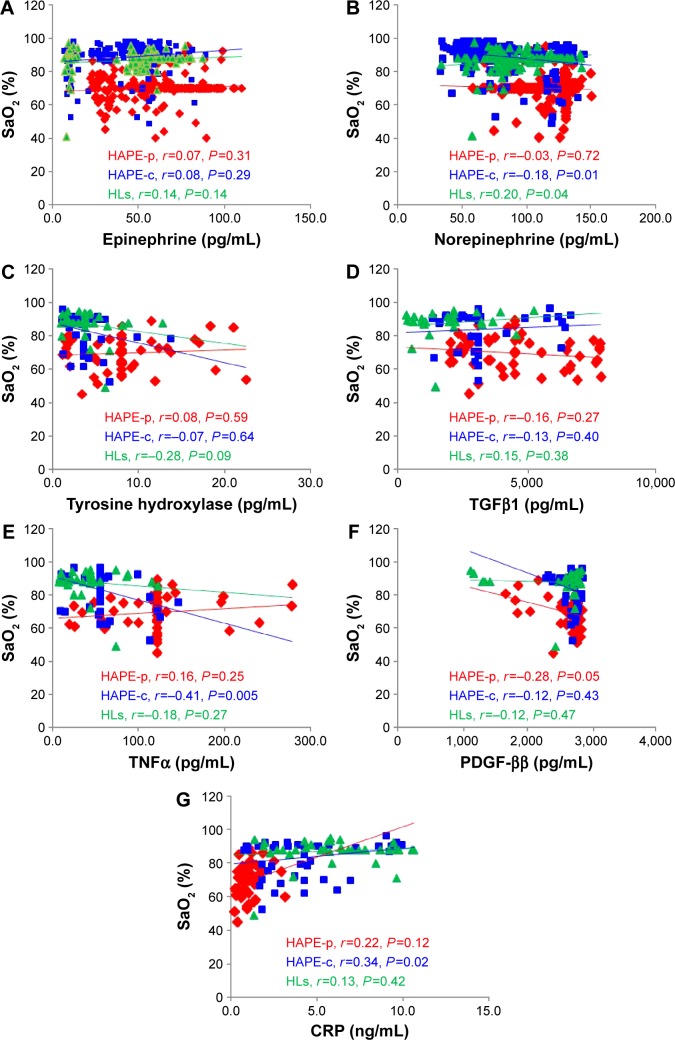
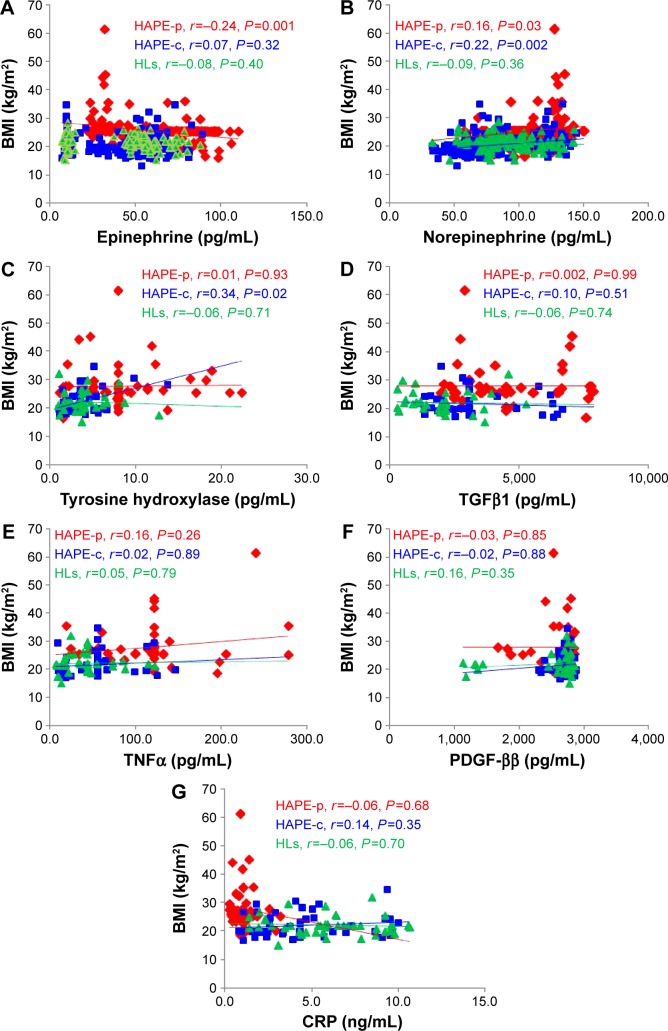
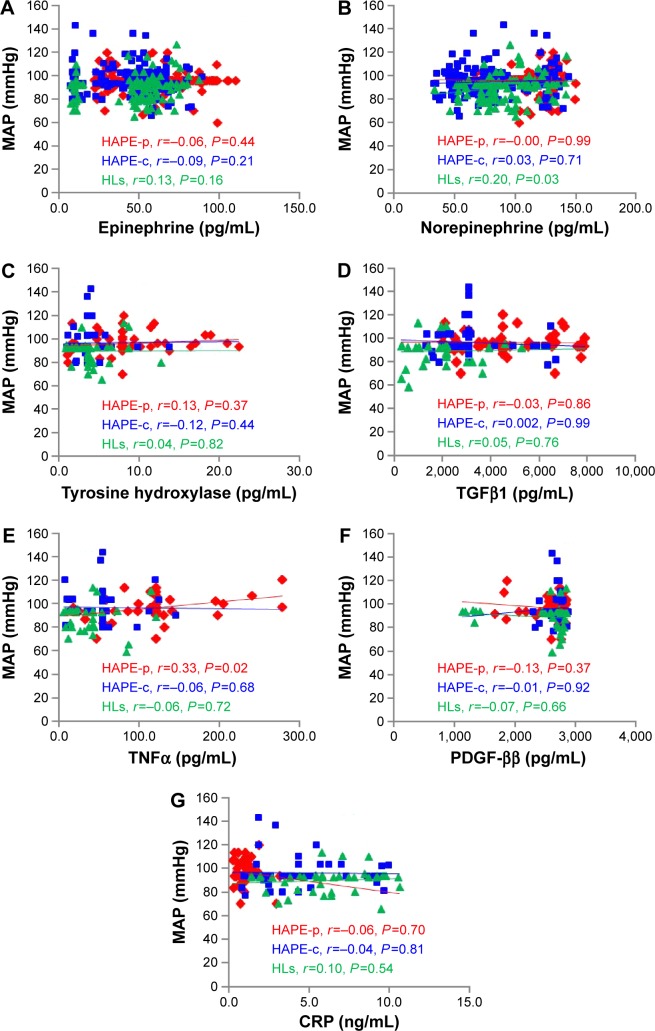
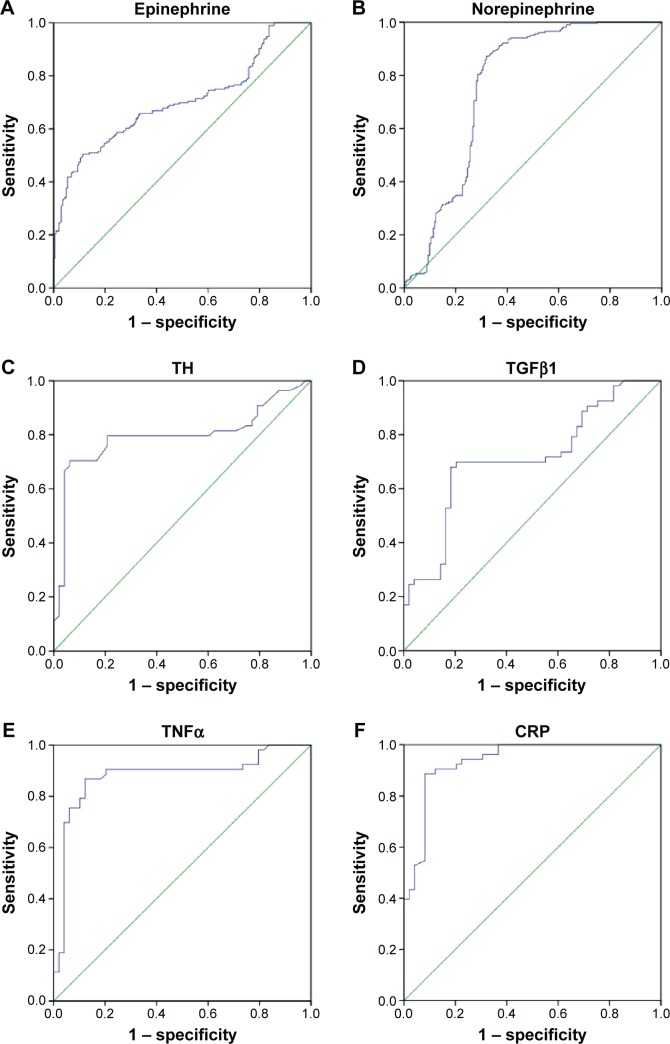
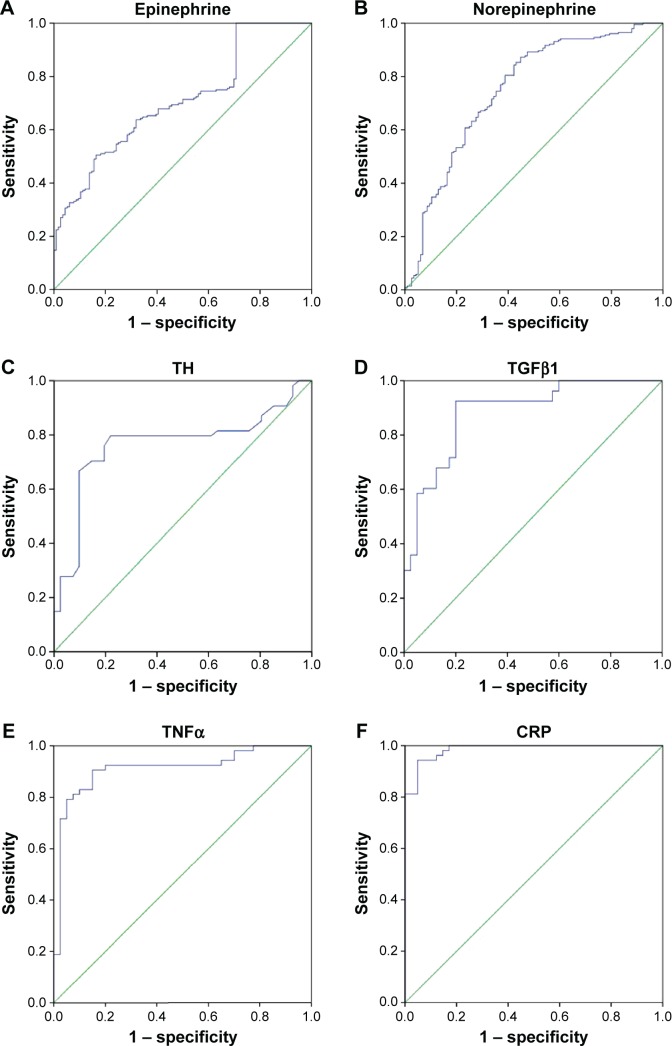
Biomarkers are essential to unravel the locked pathophysiology of any disease. This study investigated the role of biomarkers and their interactions with each other and with the clinical parameters to study the physiology of high-altitude pulmonary edema (HAPE) in HAPE-patients (HAPE-p) against adapted highlanders (HLs) and healthy sojourners, HAPE-controls (HAPE-c). For this, seven circulatory biomarkers, namely, epinephrine, norepinephrine, tyrosine hydroxylase, transforming growth factor beta 1, tumor necrosis factor alpha (TNFα), platelet-derived growth factor beta beta, and C-reactive protein (CRP), were measured in blood plasma of the three study groups. All the subjects were recruited at ~3,500 m, and clinical features such as arterial oxygen saturation (SaO2), body mass index, and mean arterial pressure were measured. Increased levels of epinephrine, norepinephrine, tyrosine hydroxylase, transforming growth factor-beta 1, and TNFα were observed in HAPE-p against the healthy groups, HAPE-c, and HLs (P<0.0001). CRP levels were decreased in HAPE-p against HAPE-c and HLs (P<0.0001). There was no significant difference or very marginal difference in the levels of these biomarkers in HAPE-c and HLs (P>0.01). Correlation analysis revealed a negative correlation between epinephrine and norepinephrine (P=4.6E-06) in HAPE-p and positive correlation in HAPE-c (P=0.004) and HLs (P=9.78E-07). A positive correlation was observed between TNFα and CRP (P=0.004) in HAPE-p and a negative correlation in HAPE-c (P=4.6E-06). SaO2 correlated negatively with platelet-derived growth factor beta beta (HAPE-p; P=0.05), norepinephrine (P=0.01), and TNFα (P=0.005) and positively with CRP (HAPE-c; P=0.02) and norepinephrine (HLs; P=0.04). Body mass index correlated negatively with epinephrine (HAPE-p; P=0.001) and positively with norepinephrine and tyrosine hydroxylase in HAPE-c (P<0.05). Mean arterial pressure correlated positively with TNFα in HAPE-p and norepinephrine in HLs (P<0.05). Receiver operating characteristic curve analysis yielded a positive predictive value for these biomarkers with HAPE (area under the curve >0.70, P<0.05). The results clearly suggest that increased plasma levels of these circulatory biomarkers associated with HAPE.
Keywords: HAPE; adaptation; biomarkers; correlation; high-altitude; sympathetic nervous system.
Figures
Similar articles
-
Interactions among vascular-tone modulators contribute to high altitude pulmonary edema and augmented vasoreactivity in highlanders.PLoS One. 2012;7(9):e44049. doi: 10.1371/journal.pone.0044049. Epub 2012 Sep 11. PLoS One. 2012. PMID: 22984459 Free PMC article.
-
Differential methylation in EGLN1 associates with blood oxygen saturation and plasma protein levels in high-altitude pulmonary edema.Clin Epigenetics. 2022 Sep 30;14(1):123. doi: 10.1186/s13148-022-01338-z. Clin Epigenetics. 2022. PMID: 36180894 Free PMC article.
-
Elevated Vasodilatory Cyclases and Shorter Telomere Length Contribute to High-Altitude Pulmonary Edema.High Alt Med Biol. 2018 Mar;19(1):60-68. doi: 10.1089/ham.2017.0136. Epub 2018 Feb 14. High Alt Med Biol. 2018. PMID: 29443612
-
[Pathophysiology, prevention and therapy of altitude pulmonary edema].Schweiz Med Wochenschr. 1992 Aug 4;122(31-32):1151-8. Schweiz Med Wochenschr. 1992. PMID: 1496342 Review. German.
-
[High-altitude pulmonary edema in Japan].Nihon Kyobu Shikkan Gakkai Zasshi. 1995 Dec;33 Suppl:1-6. Nihon Kyobu Shikkan Gakkai Zasshi. 1995. PMID: 8752474 Review. Japanese.
Cited by
-
Is the Relationship between Depression and C Reactive Protein Level Moderated by Social Support in Elderly?-Korean Social Life, Health, and Aging Project (KSHAP).Psychiatry Investig. 2018 Jan;15(1):24-33. doi: 10.4306/pi.2018.15.1.24. Epub 2018 Jan 16. Psychiatry Investig. 2018. PMID: 29422922 Free PMC article.
-
The Telomere-Telomerase System Is Detrimental to Health at High-Altitude.Int J Environ Res Public Health. 2023 Jan 20;20(3):1935. doi: 10.3390/ijerph20031935. Int J Environ Res Public Health. 2023. PMID: 36767300 Free PMC article.
References
-
- Basnyat B, Murdoch DR. High-altitude illness. Lancet. 2003;361(9373):1967–1974. - PubMed
-
- Gallagher SA, Hackett PH. High-altitude illness. Emerg Med Clin North Am. 2004;22(2):329–355. - PubMed
-
- Pandey P, Pasha MAQ. Oxidative stress at high altitude: genotype-phenotype correlations. Adv Genomics Genet. 2014;4:29–43.
-
- Biomarkers Definitions Working Group Biomarkers and surrogate endpoints: preferred definitions and conceptual framework. Clin Pharmacol Ther. 2001;69(3):89–95. - PubMed
LinkOut - more resources
Full Text Sources
Other Literature Sources
Research Materials
Miscellaneous
