

The Effect of Mir-451 Upregulation on Erythroid Lineage Differentiation of Murine Embryonic Stem Cells
- PMID: 27540521
- PMCID: PMC4988415
- DOI: 10.22074/cellj.2016.4311
The Effect of Mir-451 Upregulation on Erythroid Lineage Differentiation of Murine Embryonic Stem Cells
Abstract
Objective: MicroRNAs (miRNAs) are small endogenous non-coding regulatory RNAs that control mRNAs post-transcriptionally. Several mouse stem cells miRNAs are cloned differentially regulated in different hematopoietic lineages, suggesting their possible role in hematopoietic lineage differentiation. Recent studies have shown that specific miRNAs such as Mir-451 have key roles in erythropoiesis.
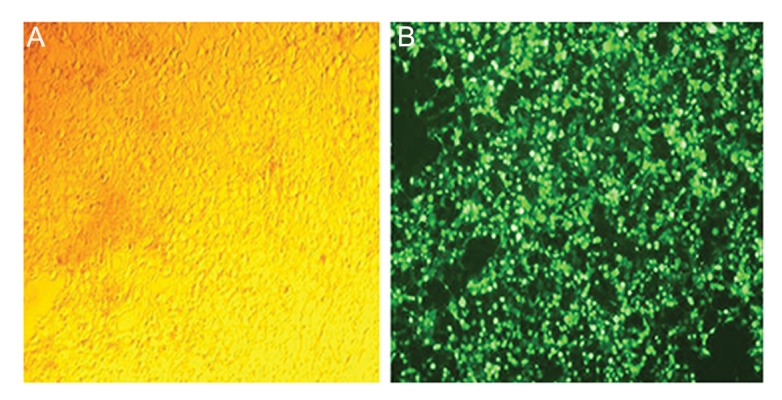
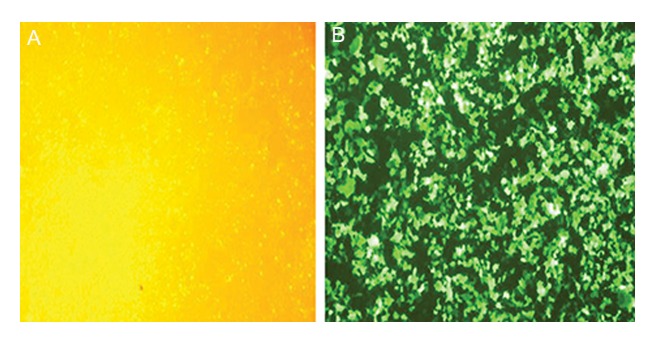
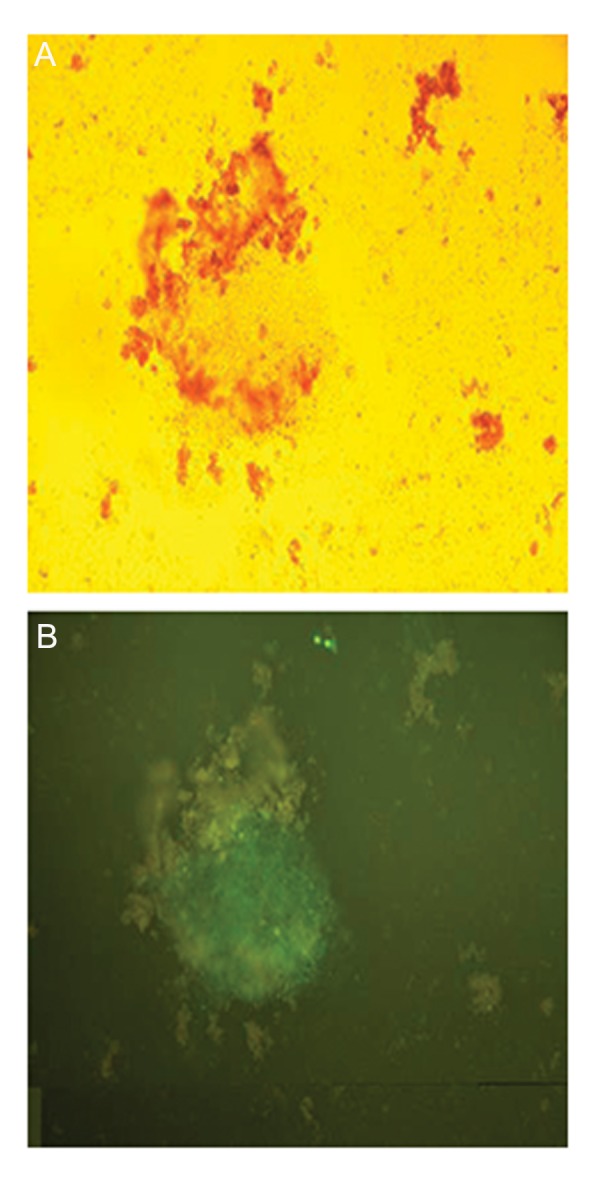
Materials and methods: In this experimental study, murine embryonic stem cells (mESCs) were infected with lentiviruses containing pCDH-Mir-451. Erythroid differentiation was assessed based on the expression level of transcriptional factors (Gata-1, Klf-1, Epor) and hemoglobin chains (α, β, γ , ε and ζ) genes using quantitative reverse transcriptase-polymerase chain reaction (qRT-PCR) and presence of erythroid surface antigens (TER-119 and CD235a) using flow cytometery. Colony-forming unit (CFU) assay was also on days 14thand 21thafter transduction.
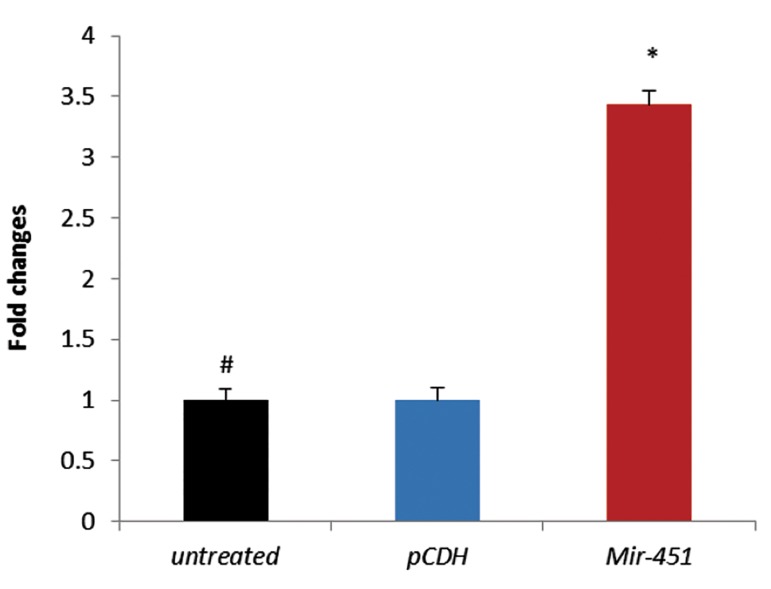
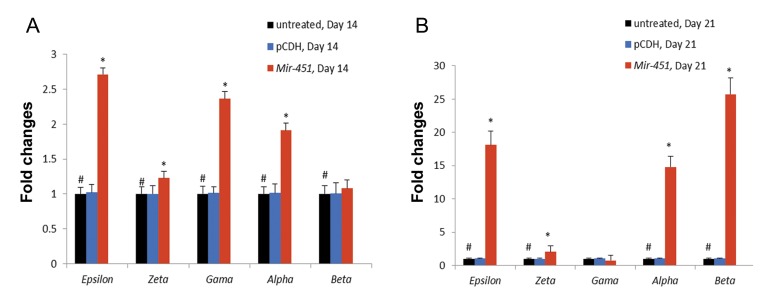
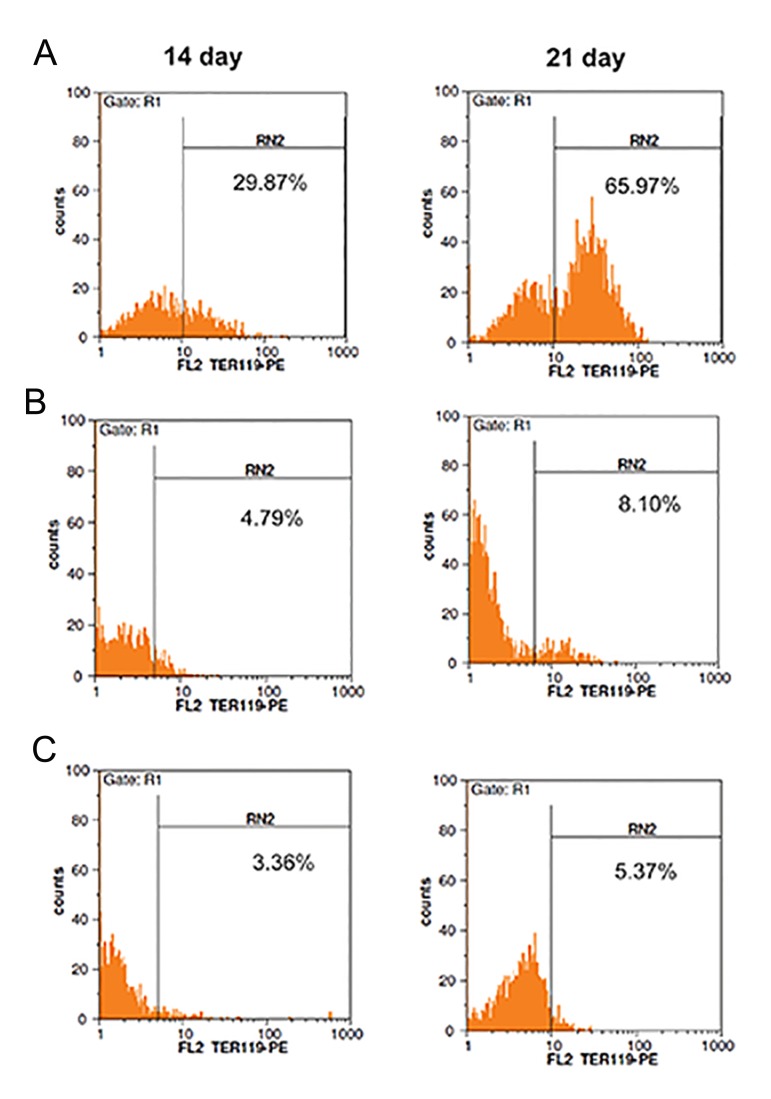
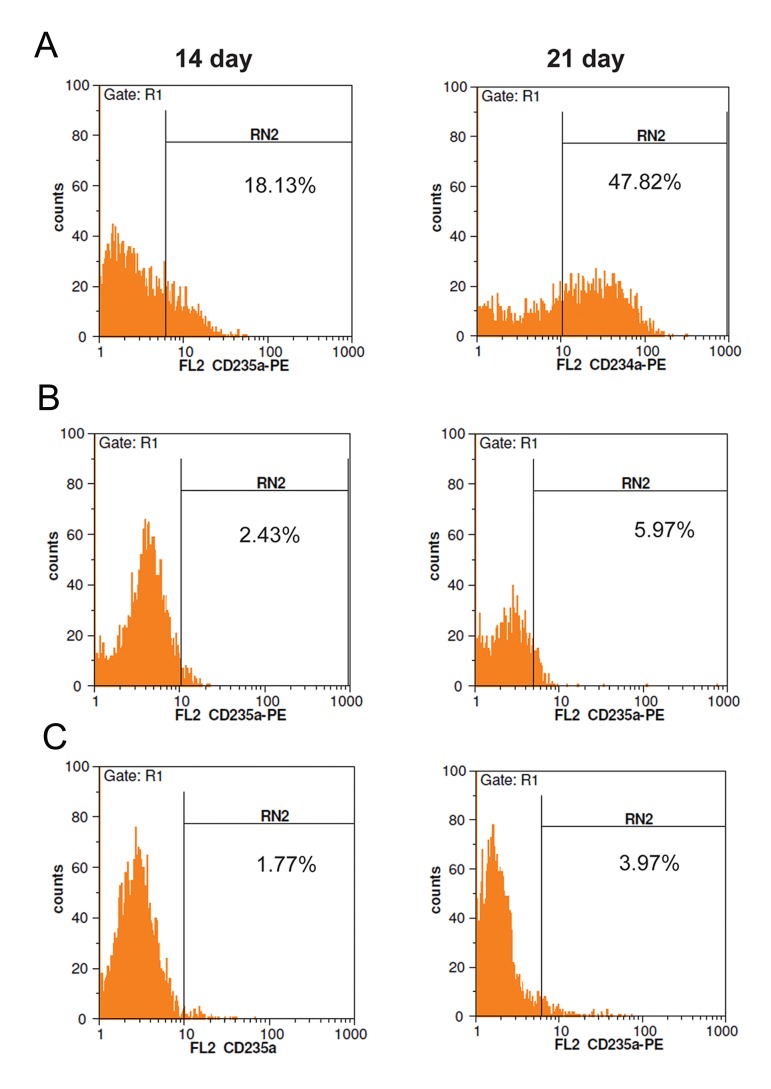
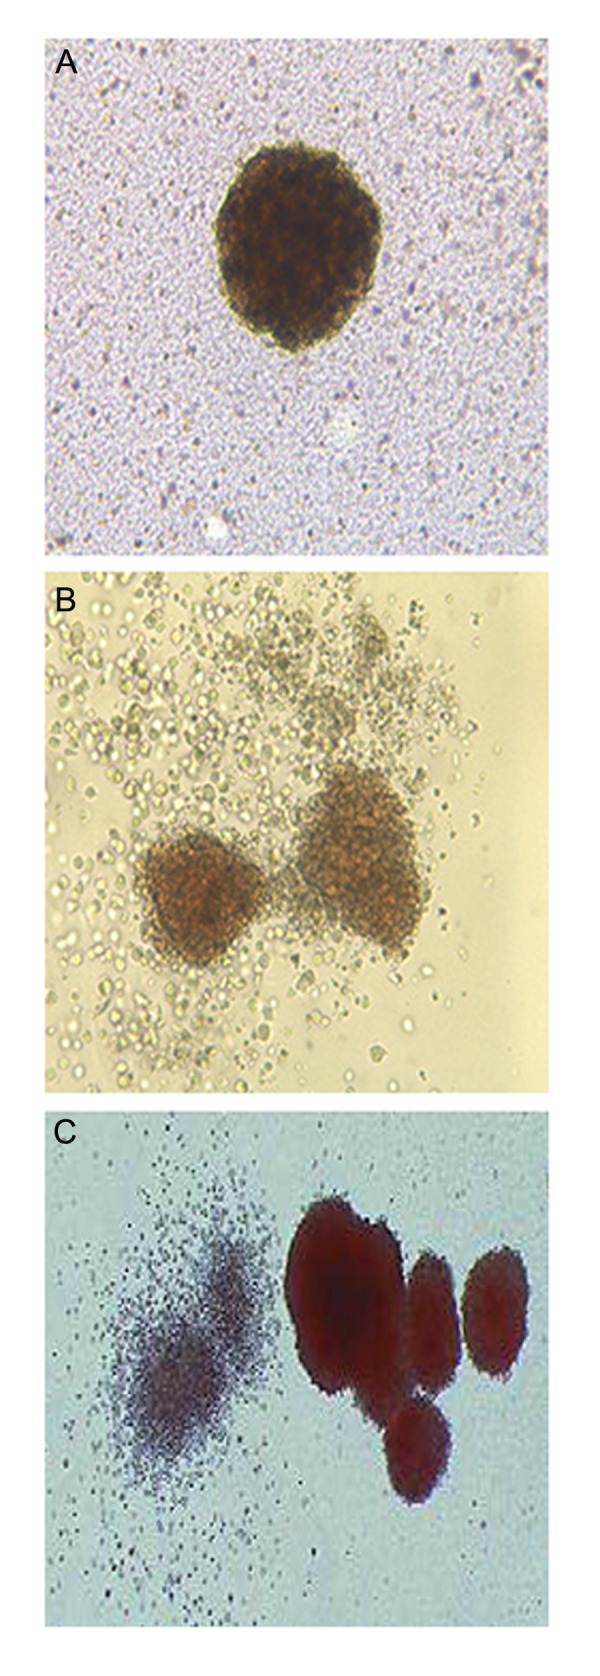
Results: Mature Mir-451 expression level increased by 3.434-fold relative to the untreated mESCs on day 4 after transduction (P<0.001). Mir-451 up-regulation correlated with the induction of transcriptional factor (Gata-1, Klf-1, Epor) and hemoglobin chain (α, β, γ, ε and ζ) genes in mESCs (P<0.001) and also showed a strong correlation with presence of CD235a and Ter- 119 markers in these cells (13.084and 13.327-fold increse, respectively) (P<0.05). Moreover, mESCs treated with pCDH-Mir-451 showed a significant raise in CFU-erythroid (CFU-E) colonies (5.2-fold) compared with untreated control group (P<0.05).
Conclusion: Our results showed that Mir-451 up-regulation strongly induces erythroid differentiation and maturation of mESCs. Overexpression of Mir-451 may have the potential to produce artificial red blood cells (RBCs) without the presence of any stimulatory cytokines.
Keywords: Erythropoiesis; Globin Chains; MicroRNAs; Mir-451; mESCs.
Figures
Similar articles
-
Simultaneous regulation of miR-451 and miR-191 led to erythroid fate decision of mouse embryonic stem cell.Iran J Basic Med Sci. 2019 Apr;22(4):432-438. doi: 10.22038/ijbms.2019.27919.6795. Iran J Basic Med Sci. 2019. PMID: 31168349 Free PMC article.
-
miR-451 Up-regulation, Induce Erythroid Differentiation of CD133+cells Independent of Cytokine Cocktails.Iran J Basic Med Sci. 2013 Jun;16(6):756-63. Iran J Basic Med Sci. 2013. PMID: 23997901 Free PMC article.
-
miRNAs: a new method for erythroid differentiation of hematopoietic stem cells without the presence of growth factors.Appl Biochem Biotechnol. 2014 Feb;172(4):2055-69. doi: 10.1007/s12010-013-0633-0. Epub 2013 Dec 11. Appl Biochem Biotechnol. 2014. PMID: 24326679
-
Regulation of the MIR155 host gene in physiological and pathological processes.Gene. 2013 Dec 10;532(1):1-12. doi: 10.1016/j.gene.2012.12.009. Epub 2012 Dec 14. Gene. 2013. PMID: 23246696 Review.
-
Erythropoiesis: model systems, molecular regulators, and developmental programs.IUBMB Life. 2009 Aug;61(8):800-30. doi: 10.1002/iub.226. IUBMB Life. 2009. PMID: 19621348 Review.
Cited by
-
Targeting Genetic Modifiers of HBG Gene Expression in Sickle Cell Disease: The miRNA Option.Mol Diagn Ther. 2022 Sep;26(5):497-509. doi: 10.1007/s40291-022-00589-z. Epub 2022 May 12. Mol Diagn Ther. 2022. PMID: 35553407 Free PMC article. Review.
-
Genetic Background of Polycythemia Vera.Genes (Basel). 2022 Apr 2;13(4):637. doi: 10.3390/genes13040637. Genes (Basel). 2022. PMID: 35456443 Free PMC article. Review.
-
Krüppel-Like Factor 1: A Pivotal Gene Regulator in Erythropoiesis.Cells. 2022 Sep 29;11(19):3069. doi: 10.3390/cells11193069. Cells. 2022. PMID: 36231031 Free PMC article. Review.
-
Simultaneous regulation of miR-451 and miR-191 led to erythroid fate decision of mouse embryonic stem cell.Iran J Basic Med Sci. 2019 Apr;22(4):432-438. doi: 10.22038/ijbms.2019.27919.6795. Iran J Basic Med Sci. 2019. PMID: 31168349 Free PMC article.
-
Sarcopenia associates with SNAP-25 SNPs and a miRNAs profile which is modulated by structured rehabilitation treatment.J Transl Med. 2021 Jul 21;19(1):315. doi: 10.1186/s12967-021-02989-x. J Transl Med. 2021. PMID: 34289870 Free PMC article.
References
-
- Thomson JA, Itskovitz-Eldor J, Shapiro SS, Waknitz MA, Swiergiel JJ, Marshall VS, et al. Embryonic stem cell lines derived from human blastocysts. Science. 1998;282(5391):1145–1147. - PubMed
-
- Keller G. Embryonic stem cell differentiation: emergence of a new era in biology and medicine. Genes Dev. 2005;19(10):1129–1155. - PubMed
-
- Smith AG. Embryo-derived stem cells: of mice and men. Annu Rev Cell Dev Biol. 2001;17:435–462. - PubMed
-
- Houbaviy HB, Murray MF, Sharp PA. Embryonic stem cellspecific MicroRNAs. Dev Cell. 2003;5(2):351–358. - PubMed
LinkOut - more resources
Full Text Sources