. 2016 Aug 19;12(8):e1005799.
doi: 10.1371/journal.ppat.1005799. eCollection 2016 Aug.

Compartmentalization of Total and Virus-Specific Tissue-Resident Memory CD8+ T Cells in Human Lymphoid Organs

Affiliations

Compartmentalization of Total and Virus-Specific Tissue-Resident Memory CD8+ T Cells in Human Lymphoid Organs

Heng Giap Woon et al. PLoS Pathog. .

Abstract

Disruption of T cell memory during severe immune suppression results in reactivation of chronic viral infections, such as Epstein Barr virus (EBV) and Cytomegalovirus (CMV). How different subsets of memory T cells contribute to the protective immunity against these viruses remains poorly defined. In this study we examined the compartmentalization of virus-specific, tissue resident memory CD8+ T cells in human lymphoid organs. This revealed two distinct populations of memory CD8+ T cells, that were CD69+CD103+ and CD69+CD103-, and were retained within the spleen and tonsils in the absence of recent T cell stimulation. These two types of memory cells were distinct not only in their phenotype and transcriptional profile, but also in their anatomical localization within tonsils and spleen. The EBV-specific, but not CMV-specific, CD8+ memory T cells preferentially accumulated in the tonsils and acquired a phenotype that ensured their retention at the epithelial sites where EBV replicates. In vitro studies revealed that the cytokine IL-15 can potentiate the retention of circulating effector memory CD8+ T cells by down-regulating the expression of sphingosine-1-phosphate receptor, required for T cell exit from tissues, and its transcriptional activator, Kruppel-like factor 2 (KLF2). Within the tonsils the expression of IL-15 was detected in regions where CD8+ T cells localized, further supporting a role for this cytokine in T cell retention. Together this study provides evidence for the compartmentalization of distinct types of resident memory T cells that could contribute to the long-term protection against persisting viral infections.


Conflict of interest statement

The authors have declared that no competing interests exist.

Figures
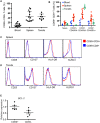
Fig 1
Fig 1. CD69 is expressed on CD8+ T cells in the absence of recent T cell activation.
The phenotype of CD8+ T cells isolated from peripheral blood, spleen and tonsils were examined by flow cytometry. (A) The mean (± SD; n = 13 for blood and spleen and n = 7 for tonsils) percent of CD69+CD8+ T cells in these compartments. (B) CD69 expression on naïve (CCR7+CD45RA+), central memory (TCM, CCR7+CD45RA), effector memory (TEM, CCR7CD45RA) and TEMRA (CCR7CD45RA+) CD8+ T cells from blood (blue), spleen (red) and tonsils (green). Individual dots represent different donor samples. (C and D) Representative flow cytometry histogram plots show the expression levels of activation markers CD25, CD137, HLA-DR and KLRG1 between the CD69+CD8+ T cells (red) and CD69CD8+ T cells (blue) in the spleen (C) and tonsils (D). Data is representative of 5 independent experiments. (E) Graph shows the relative expression levels of BCL2 between CD69+ TEM CD8+ T cells and CD69TEM CD8+ T cells from human spleen (n = 5). P = 0.0625 by one-way ANOVA.
Fig 2
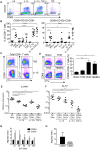
Fig 2. Two subsets of CD8+ T cells are retained within human lymphoid tissues.
The co-expression of CD69 and CD103 by CD8+ T cells isolated from spleen and tonsils were determined by flow cytometry. (A and B) Representative flow cytometry plots (left) and graphs (right; mean ± SEM; n = 10) show the proportion of CD69+CD8+ T cells expressing CD103 in human spleen (A) and tonsils (B). (C—E) Representative flow cytometry plots showing the expression levels of CCR7, CD45RA and CD11a between CD69CD103(blue), CD69+CD103(red) and CD69+CD103+ (green) CD8+ T cell subsets from the spleen (C) and tonsils (D) and the expression of PD-1, TIM3 and BTLA in tonsils (E). Data is representative of 3–5 independent experiments. (F) Relative expression of KLF2 and S1PR1 in purified CD8+ T subsets from the spleen (left panels) and tonsils (right panels). Individual dots represent different donor samples (n = 8 for spleen and n = 3 for tonsils). Statistical analysis was performed using one-way ANOVA and Tukey test. P<0.05 is noted with * and P<0.0005 is noted with ***.
Fig 3
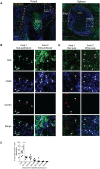
Fig 3. CD69+CD103+CD8+ T cells localize near the epithelial barrier in tonsils.
The locations of CD69+CD8+ T cell subsets were determined by immunohistochemistry. (A) Immunofluorescence microscopy images of human tonsils show the localization of CD8 (green), CD69 (blue) and CD103 (red). Scale bar represents 100 μm. (B) Higher magnification of areas 1 & 2 show the localization of CD103+CD69+CD8+ and CD103CD69+CD8+ T cells within the tonsils. (C) White arrowheads point to CD103+CD69+CD8+ T cells in areas 1 and CD103CD69+CD8+ T cells in area 2. (C) Quantitative analysis of the distance of CD103+CD3+CD8+ T cells from the epithelium shows majority localizing near the epithelial surface (P = 0.0022 by two-tailed Mann Whitney U-test). (D) Immunofluorescence microscopy of human spleen sections shows the localization of CD8 (green), CD69 (blue) and CD103 (red). Scale bar represents 100 μm. Higher magnification of areas 1 and 2 show the distribution of CD103+CD69+CD8+ and CD103CD69+CD8+ T cells. White arrowheads in area 1 show the CD103+CD69+CD8+ T cells and in area 2 show the CD103CD69+CD8+ T cells.
Fig 4
Fig 4. IL-15 and TGF-β co-operate to extinguish expression of KLF2 and S1PR1.
(A) Representative flow cytometry plots show the expression of CD69 and CD103 by CD8+ T cells following 7 day culture under different conditions: unstimulated (US), IL-15 or IL-15 + TGF-β and polyclonal stimulation (TAE). (B) Plot shows the proportion of CD69+CD103- (left panel) and CD69+CD103+ (right panel) CD8+ T cells following 7 day culture with different cytokines. Data are represented as the mean and SEM of 5–11 donors. (C) Representative flow cytometry plots show the expression of CD69, CD137 and dilution of cell trace violet (CTV) dye following stimulation of circulating CD8+ T cells for 7 days with TAE beads (upper panels) or IL-15 (lower panels). (D) Representative flow cytometry plot and graph show the expression of CD69 and the dilution of cell trace violet dye following stimulation of purified circulating naïve (n = 4), TCM (n = 2), TEM (n = 8) and TEMRA (n = 5) CD8+ T cells for 7 days with IL-15. (E-F) Plots show the relative expression of S1PR1 (E) and KLF2 (F) in CD69+ or CD69CD8+ T cells following culture for 7 days with no stimulation or stimulation with IL-15 with and without TGF-β. Purified circulating CD8+ T cells were cultured for 7 days and the resulting CD69+ and CD69populations were purified by cell sorting. The expression levels of KLF2 and S1pr1 were quantified by RT-PCR. Individual dots represent different samples and the data is represented as the mean ± SEM. Statistical analysis was performed using one-way ANOVA and Tukey test. P<0.05 is noted with * and P<0.005 is noted with **. (G-H) The ability of IL-15 induced CD69+CD8+ T cells to migrate to S1P and CCL5 (20 nM) was tested in trans-well migration assays. Cultured cells were sorted as stated above (for F) and their ability to migrate towards different concentrations of S1P (G) or CCL5 (20 nM) (H) was determined. Data represent the mean and SEM of three independent experiments using three different donors. Statistical analysis was performed using two-way ANOVA and the p value was < 0.05.
Fig 5
Fig 5. Constitutive expression of IL-15 within tonsils.
Immunofluorescence microscopy of frozen section of the tonsils show the presence of IL-15 expressing cells in the T cell areas and the epithelial lining of the tissue. Sections were stained with anti-IL-15 (red), anti-CD8 (green) and anti-IgM (blue). Yellow dashed line marks the epithelial barrier surface and the white dashed-lines show B cell follicles (B). ‘T” indicates the extra-follicular regions where T cells localize.
Fig 6
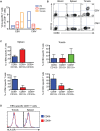
Fig 6. Selective retention of EBV-specific CD8+ T cells in tissues.
Virus-specific cells were determined by staining single cell suspensions with soluble peptide-MHC complexes (dextramers). (A) The graphs show the normal range and the line at mean value for each virus-specific population in blood (blue), spleen (red) and tonsils (orange). (B) Representative flow cytometry plots show the dual expression of CD69 and CD103 on EBV and CMV-specific CD8+ T cells in blood, spleen and tonsils. (C) Graphs show the proportions of CD69CD103, CD69+CD103and CD69+CD103+ EBV-specific and CMV-specific CD8+ T cells from spleen and tonsils. Data is presented as the mean ± SEM of n = 5 (for EBV specific cells in tonsils and CMV-specific cells in spleen), n = 6 (EBV-specific cells in spleen) and n = 3 (CMV-specific cells in tonsils) different samples. (D) Representative flow cytometry overlayed histogram plots show no difference in the expression of HLA-DR between CD69(blue) and CD69+ (red) EBV-specific CD8+ T cells in the tonsils (left) and spleen (right).

Similar articles

Cited by

References

    1. Carbone FR. Tissue-Resident Memory T Cells and Fixed Immune Surveillance in Nonlymphoid Organs. J Immunol. 2015;195: 17–22. 10.4049/jimmunol.1500515 - DOI - PubMed
    1. Schenkel JM, Masopust D. Tissue-Resident Memory T Cells. Immunity. Elsevier Inc.; 2014;41: 886–897. - PMC - PubMed
    1. Shin H, Iwasaki A. Tissue-resident memory T cells. Immunol Rev. 2013;255: 165–81. 10.1111/imr.12087 - DOI - PMC - PubMed
    1. Bevan MJ. Memory T cells as an occupying force. Eur J Immunol. 2011;41: 1192–5. 10.1002/eji.201041377 - DOI - PMC - PubMed
    1. Clark RA. Resident memory T cells in human health and disease. Sci Transl Med. United States; 2015;7: 269rv1. - PMC - PubMed

Publication types

MeSH terms