. 2016 Nov;12(11):2145-2166.
doi: 10.1080/15548627.2016.1217369. Epub 2016 Aug 19.

Ehrlichia secretes Etf-1 to induce autophagy and capture nutrients for its growth through RAB5 and class III phosphatidylinositol 3-kinase

Affiliations

Ehrlichia secretes Etf-1 to induce autophagy and capture nutrients for its growth through RAB5 and class III phosphatidylinositol 3-kinase

Mingqun Lin et al. Autophagy. 2016 Nov.

Abstract

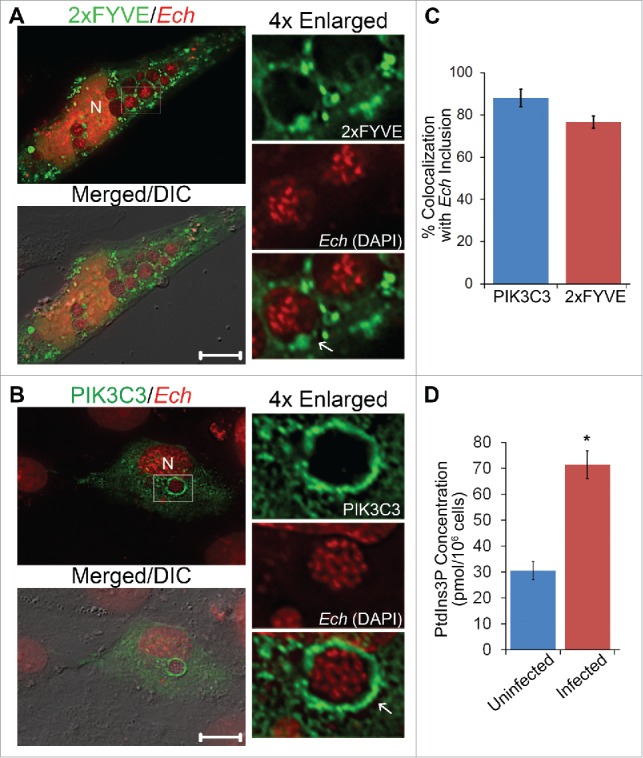
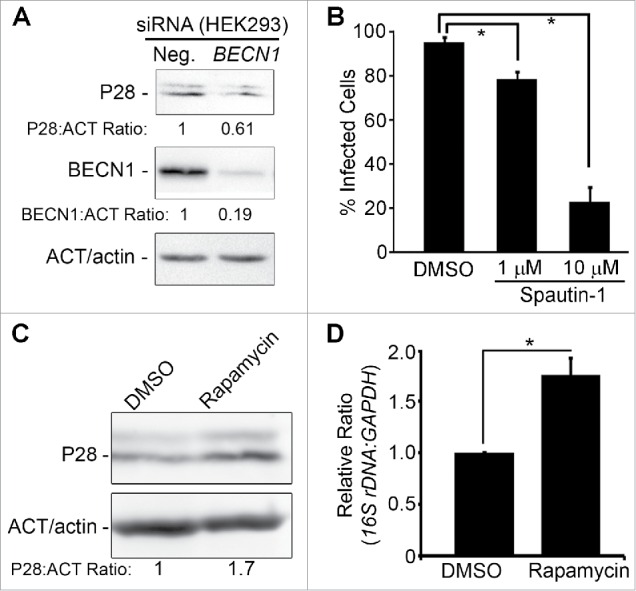
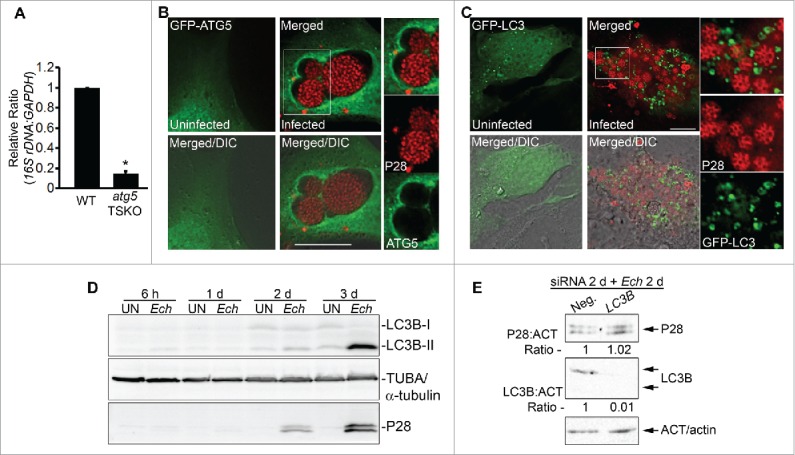
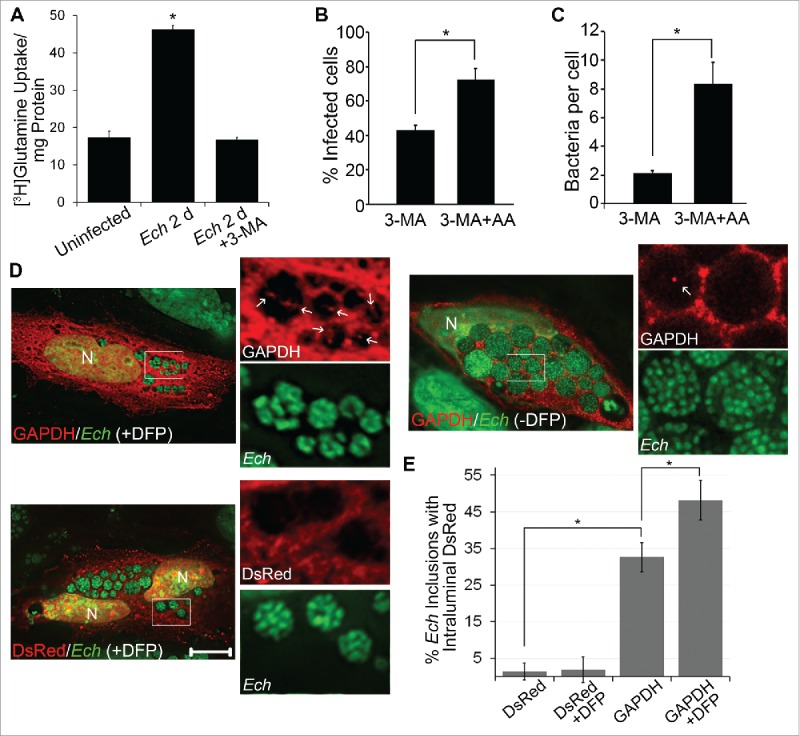
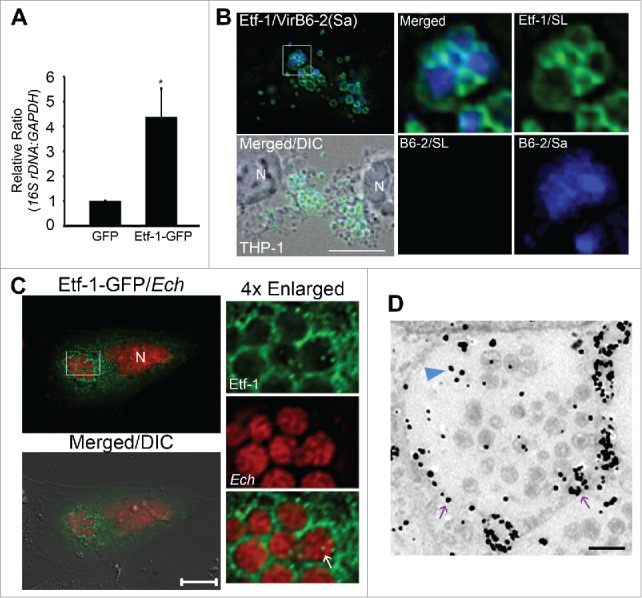
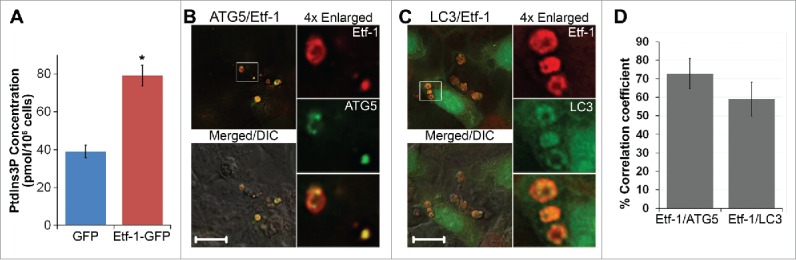
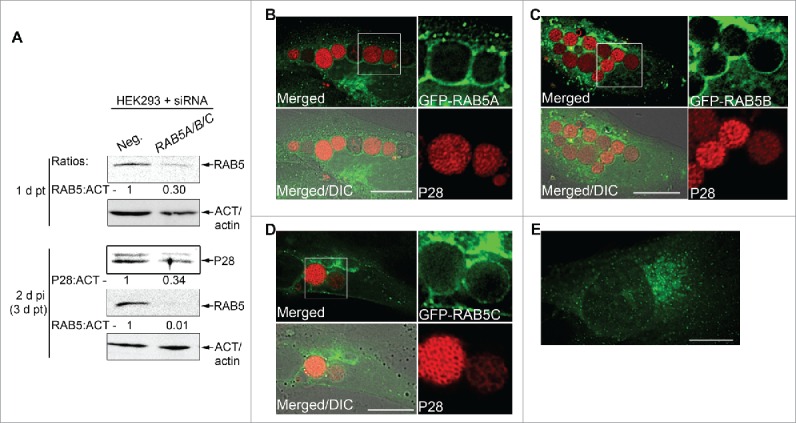
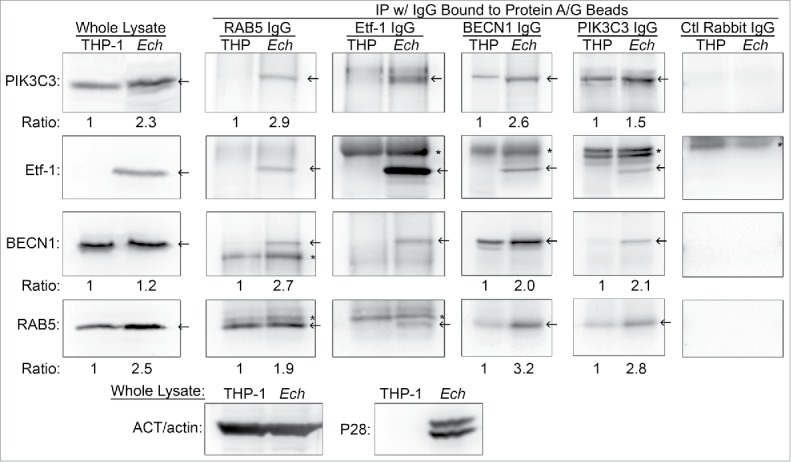
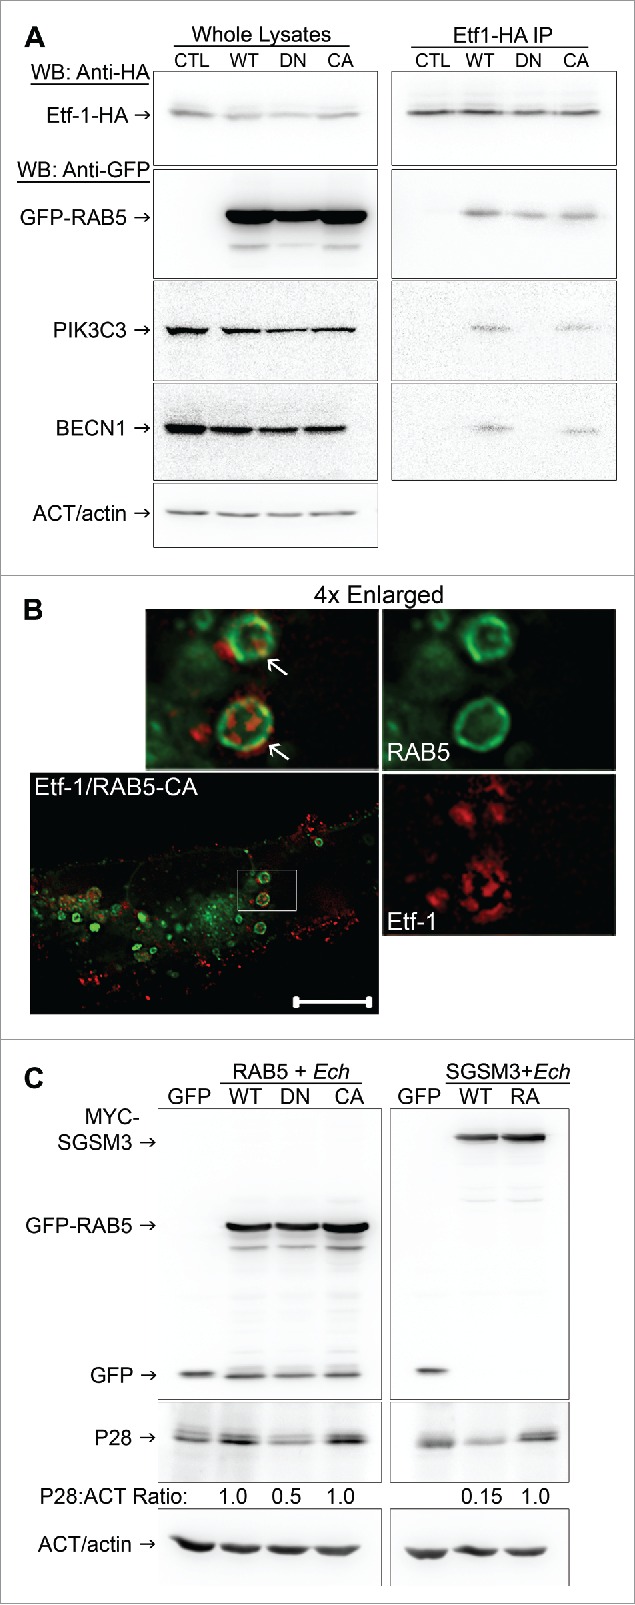
Ehrlichia chaffeensis is an obligatory intracellular bacterium that causes a potentially fatal emerging zoonosis, human monocytic ehrlichiosis. E. chaffeensis has a limited capacity for biosynthesis and metabolism and thus depends mostly on host-synthesized nutrients for growth. Although the host cell cytoplasm is rich with these nutrients, as E. chaffeensis is confined within the early endosome-like membrane-bound compartment, only host nutrients that enter the compartment can be used by this bacterium. How this occurs is unknown. We found that ehrlichial replication depended on autophagy induction involving class III phosphatidylinositol 3-kinase (PtdIns3K) activity, BECN1 (Beclin 1), and ATG5 (autophagy-related 5). Ehrlichia acquired host cell preincorporated amino acids in a class III PtdIns3K-dependent manner and ehrlichial growth was enhanced by treatment with rapamycin, an autophagy inducer. Moreover, ATG5 and RAB5A/B/C were routed to ehrlichial inclusions. RAB5A/B/C siRNA knockdown, or overexpression of a RAB5-specific GTPase-activating protein or dominant-negative RAB5A inhibited ehrlichial infection, indicating the critical role of GTP-bound RAB5 during infection. Both native and ectopically expressed ehrlichial type IV secretion effector protein, Etf-1, bound RAB5 and the autophagy-initiating class III PtdIns3K complex, PIK3C3/VPS34, and BECN1, and homed to ehrlichial inclusions. Ectopically expressed Etf-1 activated class III PtdIns3K as in E. chaffeensis infection and induced autophagosome formation, cleared an aggregation-prone mutant huntingtin protein in a class III PtdIns3K-dependent manner, and enhanced ehrlichial proliferation. These data support the notion that E. chaffeensis secretes Etf-1 to induce autophagy to repurpose the host cytoplasm and capture nutrients for its growth through RAB5 and class III PtdIns3K, while avoiding autolysosomal killing.

Keywords: ATG5; BECN1; Ehrlichia chaffeensis; Etf-1; LC3; RAB5; autophagy; class III PtdIns3K; endosome; infection; type IV secretion effector.


Figures

Figure 1.
Figure 1.
E. chaffeensis inclusion membrane is enriched with PtdIns3P and class III PtdIns3K. (A and B) E. chaffeensis (Ech)-infected RF/6A cells were transfected with plasmids encoding 2×FYVE-GFP or FLAG-PIK3C3/VPS34. At 15 h p.t. (2 d p.i.), cells were fixed and stained with DAPI to indicate E. chaffeensis (pseudocolored in red). PIK3C3 was labeled with mouse anti-FLAG. Merged/DIC, fluorescence image merged with differential interference contrast (DIC) image. Each boxed area is enlarged 4-fold on the right. N, nucleus; scale bars: 10 μm. (C) The percent colocalization of E. chaffeensis inclusions with PIK3C3 or 2×FYVE was determined by counting 10 to 20 inclusions per cell in 5 to 10 cells per experiment from 3 independent experiments. (D) PtdIns3P levels are increased in E. chaffeensis-infected THP-1 cells. Uninfected or E. chaffeensis-infected THP-1 cells (2 × 10⁶ cells) at 1 d p.i. were collected, and PtdIns3P lipids were purified and the amount determined by competitive ELISA. Assays were carried out in triplicate. Data are presented as the mean ± standard deviation. * Significantly different by the Student t test (P < 0.05).
Figure 2.
Figure 2.
Growth of E. chaffeensis is reversibly inhibited by the class III PtdIns3K inhibitor 3-MA. (A) 3-MA does not inhibit internalization of E. chaffeensis. The percentage of intracellular bacteria vs. total cell-associated bacteria was determined in THP-1 cells incubated with 3-MA or RPMI 1640 medium control (RPMI) at 2 h p.i. by scoring 100 E. chaffeensis bacteria in each group after 2 rounds of immunofluorescence labeling. Data are presented as the mean ± standard deviation of triplicate samples (not significantly different by the Student t test, P > 0.05). (B and C) 3-MA added at 1 h or 1 d p.i. inhibits E. chaffeensis infection. 3-MA was added to THP-1 cells at a final concentration of 2 mM, and infection was assessed at 3 d p.i. by Diff-Quik staining to determine the percentage of infected cells (B) and the number of bacteria per cell (C). Data are presented as the mean ± standard deviation of triplicate assays. *, Significantly different by the Tukey HSD test (P < 0.05). (D) 3-MA reversibly inhibits E. chaffeensis replication in THP-1 cells. i to iii, E. chaffeensis in THP-1 cells without 3-MA treatment at 23, 29, and 81 h p.i., respectively. iv to vi, E. chaffeensis in THP-1 cells treated with 10 mM 3-MA at 23 h p.i. for 6 h (iv) and incubated an additional 52 h with (vi) or without (v) 3-MA. Arrows indicate E. chaffeensis as shown by Diff-Quik staining. (E) Cells in panel (D) (iv) were immunostained with anti-P28. White arrows indicate large vacuoles containing condensed bacteria. Merged/DIC, fluorescence image merged with differential interference contrast (DIC) image. Deconvolution microscopy. Scale bar: 10 μm.
Figure 3.
Figure 3.
E. chaffeensis infection requires BECN1 and is enhanced by rapamycin. (A) Depletion of BECN1 suppresses E. chaffeensis infection. HEK293 cells were transfected with BECN1 siRNA or control scrambled siRNA (Neg.) for 40 h and then infected with E. chaffeensis for 36 h. Western blotting was performed using anti-P28, ACT/actin, and BECN1. The values under the bands show the relative ratio of band intensities vs. ACT/actin, with the ratios of those from control siRNA set as 1. (B) Spautin-1 inhibits E. chaffeensis growth. E. chaffeensis–infected THP-1 cells were treated at 1 d p.i. with DMSO solvent control or with 1 μM or 10 μM spautin-1 and incubated for an additional 2 d. Infection was assessed at 3 d p.i. by Diff-Quik staining to determine the percent of infected cells. *, Significantly different by the Tukey HSD test (P < 0.05). (C and D) Rapamycin enhances E. chaffeensis infection in THP-1 cells. (C) Western blot analysis with anti-P28. ACT/actin was used as a loading control. The values under the bands show the relative ratio of band intensities normalized against ACT/actin, with the ratio of DMSO (control) set as 1. (D) qPCR of E. chaffeensis 16S rDNA normalized to human GAPDH DNA. *, Significantly different (P < 0.05) by the Student t test.
Figure 4.
Figure 4.
E. chaffeensis infection requires ATG5, and ATG5 but not LC3 localizes to E. chaffeensis inclusions. (A) E. chaffeensis load in macrophages derived from bone marrow of wild-type (WT) and atg5flox/flox-Lyz2-Cre mutant (atg5 TSKO) mice at 7 d p.i. qPCR of E. chaffeensis 16S rDNA was normalized to mouse Gapdh. *, Significantly different (P < 0.05) by the Student t test. (B) ATG5 traffics to E. chaffeensis inclusions. E. chaffeensis-infected cells were transfected at 1 d p.i. and were immunostained with anti-P28 (P28; red) at 17 h p.t. (41 h p.i.). Uninfected RF/6A cells were examined at 17 h p.t. (C) Diffused localization of GFP-LC3 was observed in uninfected RF/6A cells, but puncta were apparent in infected cells. GFP-LC3-transfected RF/6A cells were infected with E. chaffeensis at 1 d p.t. and immunostained with anti-P28 (P28; AF555) at 3 d p.i. and 4 d p.t. (B and C) Each boxed area is enlarged on the right. Merged, merged image; Merged/DIC, fluorescence image merged with DIC image. Scale bars: 10 μm. (D) Conversion of LC3-I to LC3-II occurs at a late stage of infection. HL-60 cells infected with E. chaffeensis (Ech), along with control uninfected cells (UN), were harvested at 6 h, 1 d, 2 d, and 3 d p.i for western blot analysis using rabbit anti-LC3B, rabbit anti-P28, and mouse anti-tubulin. (E) E. chaffeensis infection does not require LC3. RF/6A cells were transfected with LC3B siRNA or control scrambled siRNA (Neg.) for 2 d and incubated with E. chaffeensis for 2 d. Western blotting was performed using anti-P28, anti-ACT/actin, and anti-LC3B. The values under the bands show the relative ratio of band intensities normalized against ACT/actin, with the ratios of those from control siRNA set as 1.
Figure 5.
Figure 5.
Host preincorporated amino acids are taken up by E. chaffeensis (Ech) in a host class III PtdIns3K-dependent manner. (A) THP-1 cells were prelabeled with [3H]glutamine for 1 d and then infected with E. chaffeensis for 2 d in the absence of [3H]glutamine. Infected cells were treated with 2 mM 3-MA or solvent control for an additional 6 h. E. chaffeensis was purified from infected cells, and the [3H]glutamine incorporated in E. chaffeensis was determined by liquid scintillation counter and normalized to the total protein amount. Data are presented as the mean ± standard deviation of triplicate samples. *, Significantly different (P< 0.05) by the Student t test. (B and C) E. chaffeensis growth inhibition by 3-MA is partially rescued upon supplementation with essential amino acids. E. chaffeensis-infected cells were treated at 1 d p.i. with 3-MA or 3-MA and amino acids (3-MA + AA) for 2 d. The percentage of infected cells (B) and number of bacteria (C) were scored in each group. *, Significantly different (P < 0.05) by the Student t test. (D) DsRed-GAPDH (white arrows) was detected within E. chaffeensis-containing inclusions more with 0.1 μM DFP treatment for 2 h than without treatment before fixation by deconvolution microscopy. DAPI was pseudocolored in green. N, nucleus. Bar: 10 μm. (E) Percentage of inclusions that contain DsRed-GAPDH or DsRed with or without DFP treatment was determined by counting 10 to 20 inclusions per cell in 10 to 20 cells per experiment from 3 independent experiments. *, Significantly different (P < 0.01) by the Student t test.
Figure 6.
Figure 6.
Etf-1 promotes E. chaffeensis infection and traffics to E. chaffeensis inclusions. (A) HEK293 cells transfected with Etf-1-GFP or with GFP alone (control) were infected with E. chaffeensis at 1 d p.t. qPCR was performed at 2 d p.i. The 16S rDNA/GAPDH ratio for GFP-transfected HEK293 cells was set as 1. Data are presented as the mean ± standard deviation of triplicate assays. *, Significantly different (P < 0.05) by the Student t test. (B) Native Etf-1 localizes on the cytoplasmic side of E. chaffeensis inclusions. N, nucleus. The plasma membrane of infected THP-1 cells was selectively permeabilized with SLO and labeled with anti-Etf-1 (Etf-1/SL) and anti-VirB6-2 (B6-2/SL). After the first round of staining, all cell membranes were permeabilized with saponin (Sa), and the cells were stained again with anti-VirB6 (B6-2/Sa). Secondary antibodies with distinct fluorochromes were used for VirB6-2 labeling before (red) and after (blue) saponin treatment. (C) E. chaffeensis (Ech) inclusions are enveloped by Etf-1-GFP. E. chaffeensis-infected RF/6A cells were transfected with Etf-1-GFP at 1 d p.i., and treated with 0.1 μM DFP for 2 h prior to fixation at 16 h p.t. (40 p.i.). DAPI was used to stain DNA in host cell nuclei and E. chaffeensis DNA and pseudocolored in red. N, nucleus. Merged/DIC, fluorescence image merged with DIC image. Boxed area was enlarged 4-fold on the right. The white arrow indicated the presence of Etf-1-GFP inside E. chaffeensis-containing inclusions. Scale bars: 10 μm. (D) Immunogold labeling of Etf-1-GFP in E. chaffeensis-infected RF/6A cells. Silver-enhanced anti-GFP immunogold labeling of Etf-1-GFP detected on the inclusion membrane (purple arrows) or inside the inclusions (blue arrowhead). Scale bar: 2 μm.
Figure 7.
Figure 7.
Etf-1 activates PtdIns3K and colocalizes with ATG5 and LC3. (A) RF/6A cells were transfected with Etf-1-GFP or GFP control plasmids, and the PtdIns3P amount was determined by competitive ELISA at 2 d p.t. Data are presented as the mean ± standard deviation of triplicate assays. *, Significantly different by the Tukey HSD test (P < 0.05). (B and C) Etf-1 colocalizes with ATG5 and LC3. HEK293 cells cotransfected with GFP-ATG5 and Etf-1-DsRed (B) or GFP-LC3 and Etf-1-DsRed (C) were treated at 1 d p.t. with 10 nM BAF for 16 h prior to fixation. Merged/DIC, fluorescence image merged with DIC image. Scale bars: 10 μm. (D) The percentage colocalization of Etf-1 with ATG5 or LC3 was analyzed using Pearson correlation coefficients with ImageJ software. Results were average values of 10 to 20 cells per group ± standard deviation from 3 independent experiments.
Figure 8.
Figure 8.
NPEPPS-GFP colocalizes with Etf-1 in cotransfected cells, traffics to E. chaffeensis inclusions, and reduces aggregation of Q103-HTT. (A and B) NPEPPS/PSA-GFP colocalizes with Etf-1 in cotransfected cells and surrounds E. chaffeensis inclusions. (A) DH82 cells were sequentially transfected first with Etf-1 and 1 d later with NPEPPS-GFP. At 1 d p.t. with NPEPPS-GFP, cells were immunostained with anti-Etf-1 (AF555). White arrows indicate the colocalization between the 2 proteins. (B) E. chaffeensis-infected RF/6A cells were transfected with NPEPPS-GFP at 1 d p.i. and stained with DAPI at 1 d p.t. (2 d p.i.). Merged/DIC, fluorescence image merged with DIC image. The boxed area is enlarged on the right. Scale bars: 15 μm. (C) PAQ-22 inhibits E. chaffeensis replication in THP-1 cells. E. chaffeensis-infected THP-1 cells were incubated with 0.1% DMSO (control) or 10 or 100 μM PAQ-22. qPCR of E. chaffeensis 16S rDNA normalized to human GAPDH. *, Significantly different by the Tukey HSD test (P< 0.05). (D to F) Etf-1 reduces aggregation of Q103-GFP. (D) RF/6A cells transfected with Q103-GFP alone or cotransfected with Q103-GFP and DsRed control; exposure time, 0.001 sec. RF/6A cells cotransfected with Q103-GFP and Etf-1 were immunostained with anti-Etf-1 (red); exposure time, 0.6 sec. Scale bars: 15 μm. (E) Percentage of RF/6A cells with Q103-GFP aggregation in cells cotransfected with Q103-GFP and vector control or Etf-1. *, Significantly different by the Tukey HSD test (P < 0.05). (F) Relative amount of Q103-GFP in RF/6A cells with or without Etf-1. Western blot analysis was performed using anti-GFP and - ACT/actin IgG, and band intensities were normalized against ACT/actin.
Figure 9.
Figure 9.
E. chaffeensis infection requires RAB5, and GFP-RAB5 traffics to the E. chaffeensis inclusion membrane. (A) E. chaffeensis infection requires RAB5. RF/6A cells were transfected with control scrambled siRNA (Neg.) or RAB5A/B/C siRNAs for 1 d, and then infected with E. chaffeensis for 2 d. Western blotting was performed using anti-P28, -ACT/actin, or -RAB5 IgG. The values under the bands show the relative ratio of band intensities normalized against ACT/actin, with the ratios of those from control siRNA set as 1. (B to D) E. chaffeensis-infected RF/6A cells at 1 d p.i. were transfected with GFP-RAB5A, GFP-RAB5B, or GFP-RAB5C. At 15 h p.t. (39 h p.i.), cells were subjected to immunofluorescence labeling with rabbit anti-P28 (AF555). Merged, merged images; Merged/DIC, fluorescence image merged with DIC image. Each boxed area is enlarged on the right. (E) Control uninfected RF/6A cells transfected with GFP-RAB5A. Scale bars: 15 μm.
Figure 10.
Figure 10.
Etf-1 interacts with the RAB5-class III PtdIns3K complex. Co-immunoprecipitation of native Etf-1 with endogenous RAB5, BECN1, and PIK3C3/VPS34. Uninfected (THP) or E. chaffeensis-infected (Ech) THP-1 cells at 2 d p.i. were lysed in modified lysis buffer and immunoprecipitated (IP) with rabbit anti-Etf-1, BECN1, or PIK3C3, or mouse anti-RAB5 IgG cross-linked to protein A/G-magnetic beads for 2 h. Bound proteins were eluted and subjected to western blotting. Arrows indicate the target proteins. *, IgG heavy or light chains. The number under the figure is the density ratio relative to ACT/actin, with uninfected cells set as 1. The absence of a number indicates an infinite ratio (i.e., the protein was absent in the control). Images were representative of 3 experiments with similar results.
Figure 11.
Figure 11.
RAB5-GTP is required for E. chaffeensis infection. (A) HEK293 cells were cotransfected with plasmids expressing Etf-1-HA and GFP (CTL) or GFP-RAB5A (WT, DN, or CA mutant). At 2 d p.t., samples were lysed and immunoprecipitated with mouse anti-HA cross-linked on protein G-sepharose beads for 2 h. Images were representative of 3 experiments with similar results. (B) RF/6A cells cotransfected with Etf-1-DsRed and GFP-RAB5A-CA for 2 d. White arrows indicate the colocalization between the 2 proteins. The boxed area was enlarged 4-fold. Scale bar: 10 μm. (C) HEK293 cells were transfected with GFP, GFP-RAB5 (WT, DN, or CA mutant), SGSM3/RABGAP5 (WT), or SGSM3R165A mutant (RA) and then infected with E. chaffeensis at 1 d p.t. for 2 d. Samples were examined by western blotting, and the ratios of P28: ACT/actin were quantified and compared with those of RAB5 WT or SGSM3R165A groups, which were arbitrarily set as 1. Images were representative of 3 experiments with similar results.

Similar articles

Cited by

References

    1. Dawson JE, Anderson BE, Fishbein DB, Sanchez JL, Goldsmith CS, Wilson KH, Duntley CW. Isolation and characterization of an Ehrlichia sp. from a patient diagnosed with human ehrlichiosis. J Clin Microbiol 1991; 29:2741–5; PMID:1757540 - PMC - PubMed
    1. Anderson BE, Dawson JE, Jones DC, Wilson KH. Ehrlichia chaffeensis, a new species associated with human ehrlichiosis. J Clin Microbiol 1991; 29:2838–42; PMID:1757557 - PMC - PubMed
    1. Maeda K, Markowitz N, Hawley RC, Ristic M, Cox D, McDade JE. Human infection with Ehrlichia canis, a leukocytic rickettsia. N Engl J Med 1987; 316:853–6; PMID:3029590; http://dx.doi.org/10.1056/NEJM198704023161406 - DOI - PubMed
    1. Paddock CD, Childs JE. Ehrlichia chaffeensis: a prototypical emerging pathogen. Clin Microbiol Rev 2003; 16:37–64; PMID:12525424; http://dx.doi.org/10.1128/CMR.16.1.37-64.2003 - DOI - PMC - PubMed
    1. Walker DH, Ismail N, Olano JP, McBride JW, Yu XJ, Feng HM. Ehrlichia chaffeensis: a prevalent, life-threatening, emerging pathogen. Trans Am Clin Climatol Assoc 2004; 115:375–82; discussion 82-4; PMID:17060980 - PMC - PubMed

Publication types

MeSH terms