

Computational drugs repositioning identifies inhibitors of oncogenic PI3K/AKT/P70S6K-dependent pathways among FDA-approved compounds
- PMID: 27542212
- PMCID: PMC5312272
- DOI: 10.18632/oncotarget.11318
Computational drugs repositioning identifies inhibitors of oncogenic PI3K/AKT/P70S6K-dependent pathways among FDA-approved compounds
Abstract
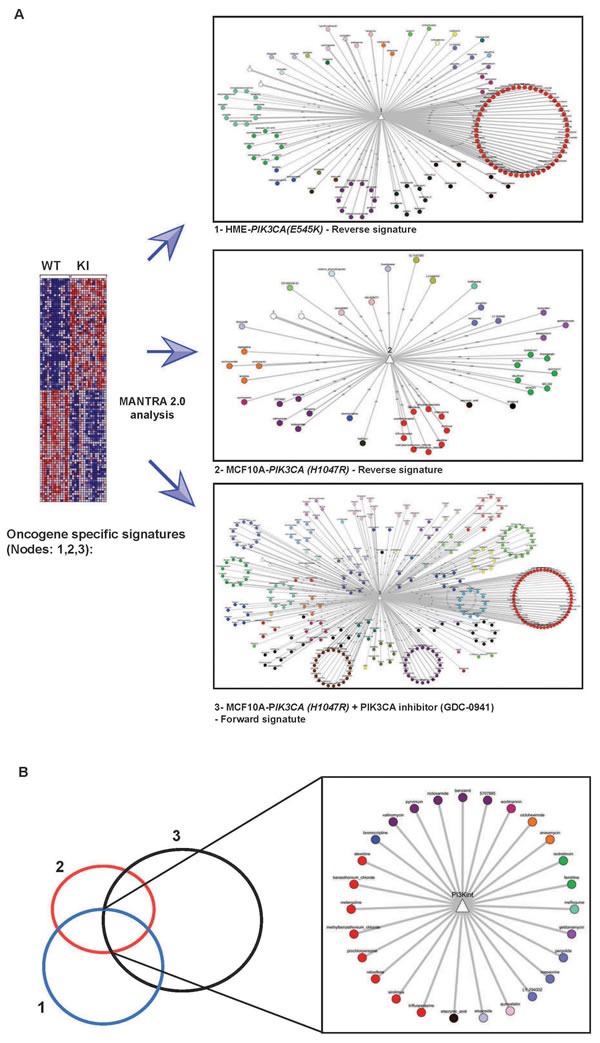
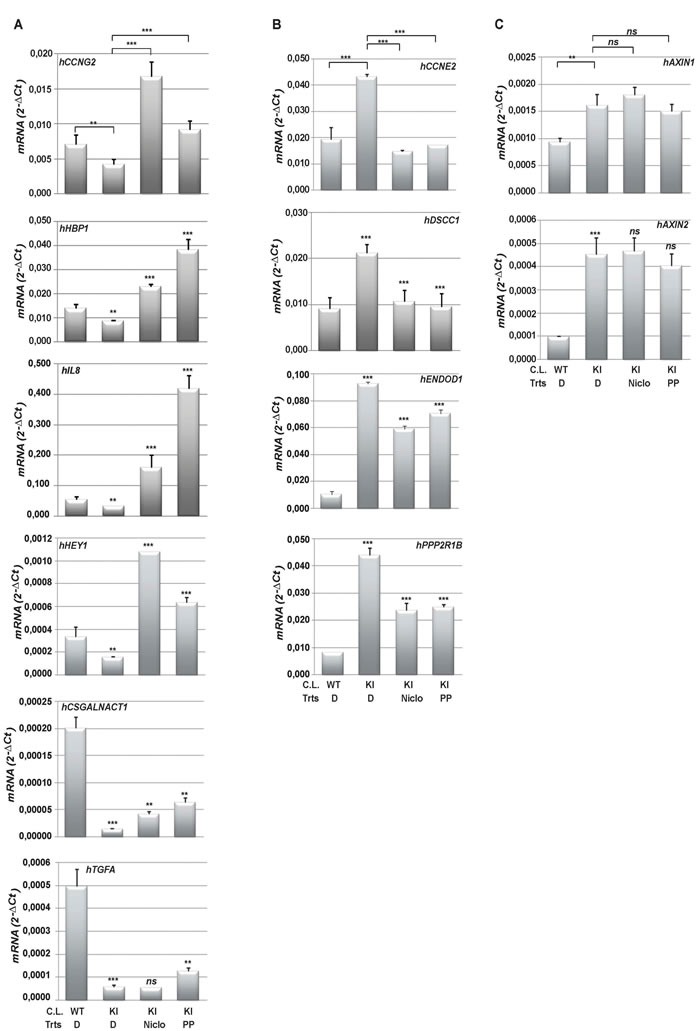
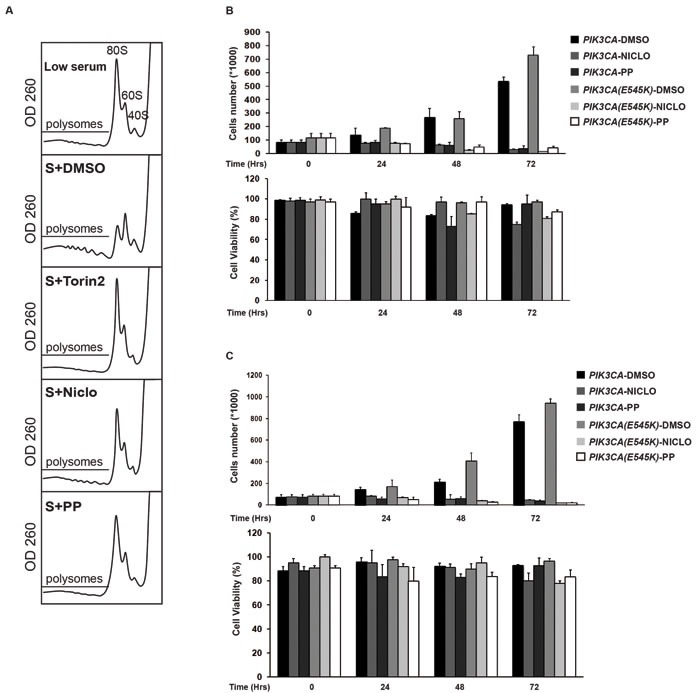
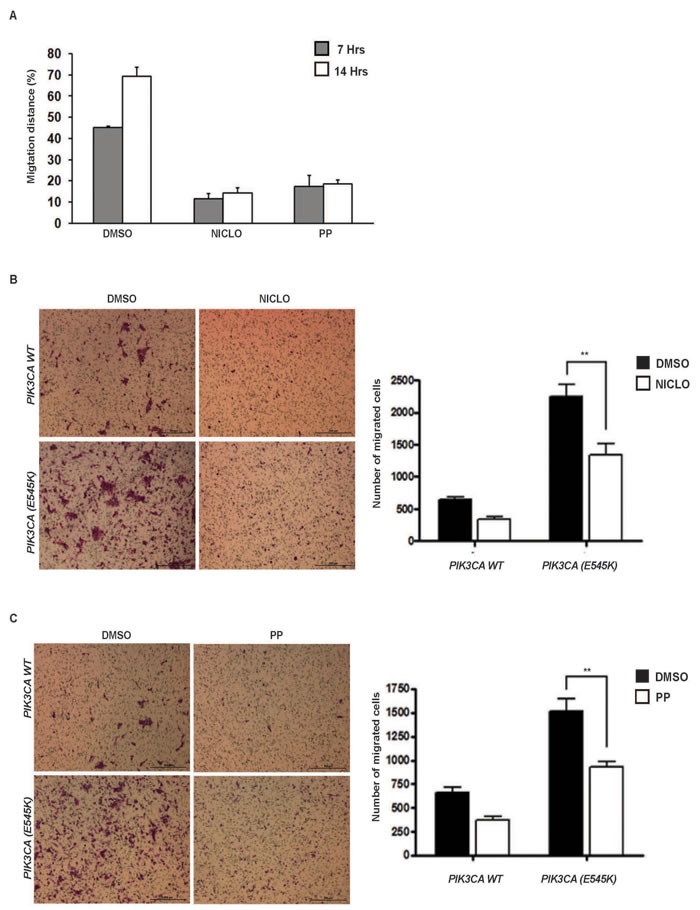
The discovery of inhibitors for oncogenic signalling pathways remains a key focus in modern oncology, based on personalized and targeted therapeutics. Computational drug repurposing via the analysis of FDA-approved drug network is becoming a very effective approach to identify therapeutic opportunities in cancer and other human diseases. Given that gene expression signatures can be associated with specific oncogenic mutations, we tested whether a "reverse" oncogene-specific signature might assist in the computational repositioning of inhibitors of oncogenic pathways. As a proof of principle, we focused on oncogenic PI3K-dependent signalling, a molecular pathway frequently driving cancer progression as well as raising resistance to anticancer-targeted therapies. We show that implementation of "reverse" oncogenic PI3K-dependent transcriptional signatures combined with interrogation of drug networks identified inhibitors of PI3K-dependent signalling among FDA-approved compounds. This led to repositioning of Niclosamide (Niclo) and Pyrvinium Pamoate (PP), two anthelmintic drugs, as inhibitors of oncogenic PI3K-dependent signalling. Niclo inhibited phosphorylation of P70S6K, while PP inhibited phosphorylation of AKT and P70S6K, which are downstream targets of PI3K. Anthelmintics inhibited oncogenic PI3K-dependent gene expression and showed a cytostatic effect in vitro and in mouse mammary gland. Lastly, PP inhibited the growth of breast cancer cells harbouring PI3K mutations. Our data indicate that drug repositioning by network analysis of oncogene-specific transcriptional signatures is an efficient strategy for identifying oncogenic pathway inhibitors among FDA-approved compounds. We propose that PP and Niclo should be further investigated as potential therapeutics for the treatment of tumors or diseases carrying the constitutive activation of the PI3K/P70S6K signalling axis.
Keywords: FDA-approved drugs; PI3K-dependent pathways; drugs network; gene expression signatures; oncogenes.
Conflict of interest statement
Authors declare no conflict of interest.
Figures


Similar articles
-
Targeting Aberrant p70S6K Activation for Estrogen Receptor-Negative Breast Cancer Prevention.Cancer Prev Res (Phila). 2017 Nov;10(11):641-650. doi: 10.1158/1940-6207.CAPR-17-0106. Epub 2017 Sep 6. Cancer Prev Res (Phila). 2017. PMID: 28877935 Free PMC article.
-
Pathway-based identification of biomarkers for targeted therapeutics: personalized oncology with PI3K pathway inhibitors.Sci Transl Med. 2010 Aug 4;2(43):43ra55. doi: 10.1126/scitranslmed.3001065. Sci Transl Med. 2010. PMID: 20686178
-
Dual inhibition of PI3K and mTOR mitigates compensatory AKT activation and improves tamoxifen response in breast cancer.Mol Cancer Res. 2013 Oct;11(10):1269-78. doi: 10.1158/1541-7786.MCR-13-0212. Epub 2013 Jun 27. Mol Cancer Res. 2013. PMID: 23814023
-
The novel role of pyrvinium in cancer therapy.J Cell Physiol. 2018 Apr;233(4):2871-2881. doi: 10.1002/jcp.26006. Epub 2017 Jun 20. J Cell Physiol. 2018. PMID: 28500633 Review.
-
PI3K/AKT/mTOR pathway inhibitors: the ideal combination partners for breast cancer therapies?Expert Rev Anticancer Ther. 2015 Jan;15(1):51-68. doi: 10.1586/14737140.2015.961429. Epub 2014 Oct 11. Expert Rev Anticancer Ther. 2015. PMID: 25306975 Review.
Cited by
-
Targeting Stem Cells and Dysplastic Features With Dual MEK/ERK and STAT3 Suppression in Gastric Carcinogenesis.Gastroenterology. 2024 Jan;166(1):117-131. doi: 10.1053/j.gastro.2023.09.040. Epub 2023 Oct 4. Gastroenterology. 2024. PMID: 37802423 Free PMC article.
-
Targeting the CK1α/CBX4 axis for metastasis in osteosarcoma.Nat Commun. 2020 Feb 28;11(1):1141. doi: 10.1038/s41467-020-14870-4. Nat Commun. 2020. PMID: 32111827 Free PMC article.
-
Drug Repositioning and Subgroup Discovery for Precision Medicine Implementation in Triple Negative Breast Cancer.Cancers (Basel). 2021 Dec 14;13(24):6278. doi: 10.3390/cancers13246278. Cancers (Basel). 2021. PMID: 34944904 Free PMC article.
-
Pyrvinium pamoate inhibits cell proliferation through ROS-mediated AKT-dependent signaling pathway in colorectal cancer.Med Oncol. 2021 Feb 8;38(2):21. doi: 10.1007/s12032-021-01472-3. Med Oncol. 2021. PMID: 33554313 Free PMC article.
-
Computational drug prediction in hepatoblastoma by integrating pan-cancer transcriptomics with pharmacological response.Hepatology. 2024 Jul 1;80(1):55-68. doi: 10.1097/HEP.0000000000000601. Epub 2023 Sep 20. Hepatology. 2024. PMID: 37729391 Free PMC article.
References
-
- Holohan C, Van Schaeybroeck S, Longley DB, Johnston PG. Cancer drug resistance: an evolving paradigm. Nat Rev Cancer. 2013;13:714–726. - PubMed
-
- Garraway LA, Janne PA. Circumventing cancer drug resistance in the era of personalized medicine. Cancer Discov. 2012;2:214–226. - PubMed
-
- Bild AH, Yao G, Chang JT, Wang Q, Potti A, Chasse D, Joshi MB, Harpole D, Lancaster JM, Berchuck A, Olson JA, Jr, Marks JR, Dressman HK, West M, Nevins JR. Oncogenic pathway signatures in human cancers as a guide to targeted therapies. Nature. 2006;439:353–357. - PubMed
-
- Huang E, Ishida S, Pittman J, Dressman H, Bild A, Kloos M, D'Amico M, Pestell RG, West M, Nevins JR. Gene expression phenotypic models that predict the activity of oncogenic pathways. Nat Genet. 2003;34:226–230. - PubMed
-
- Furge KA, Tan MH, Dykema K, Kort E, Stadler W, Yao X, Zhou M, Teh BT. Identification of deregulated oncogenic pathways in renal cell carcinoma: an integrated oncogenomic approach based on gene expression profiling. Oncogene. 2007;26:1346–1350. - PubMed
MeSH terms
Substances
LinkOut - more resources
Full Text Sources
Other Literature Sources
Medical
Research Materials
Miscellaneous
