. 2016 Sep 27;7(39):62836-62861.
doi: 10.18632/oncotarget.11229.

A steroid like phytochemical Antcin M is an anti-aging reagent that eliminates hyperglycemia-accelerated premature senescence in dermal fibroblasts by direct activation of Nrf2 and SIRT-1

Affiliations

A steroid like phytochemical Antcin M is an anti-aging reagent that eliminates hyperglycemia-accelerated premature senescence in dermal fibroblasts by direct activation of Nrf2 and SIRT-1

Kumar K J Senthil et al. Oncotarget. .

Abstract

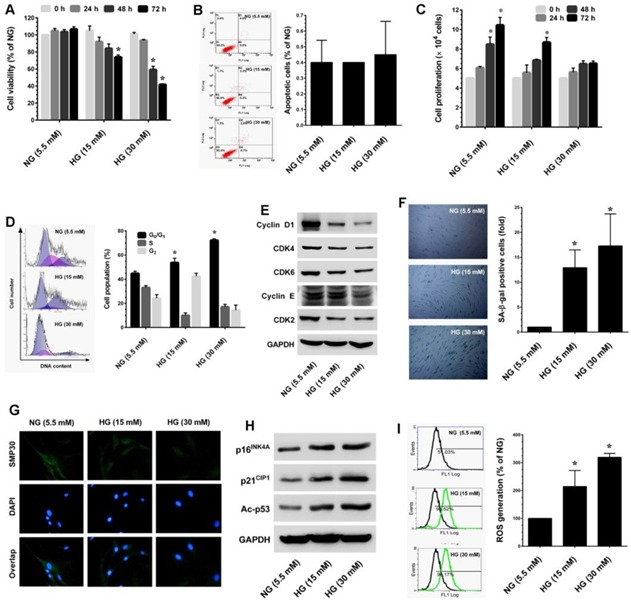
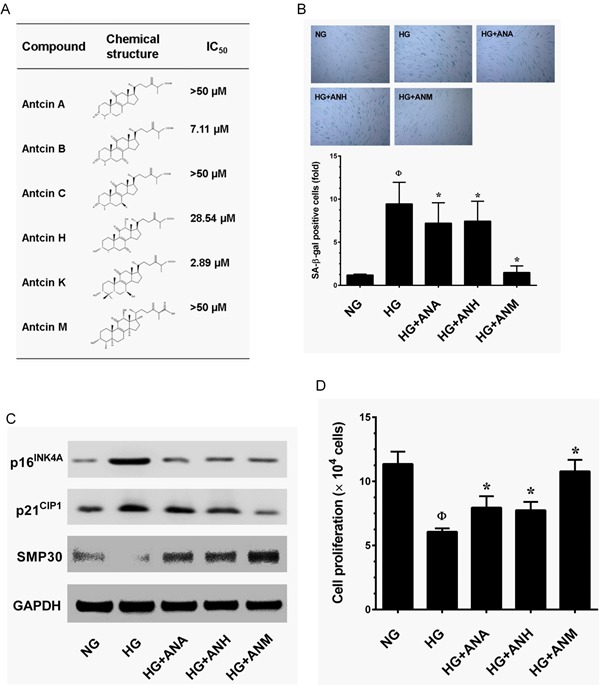
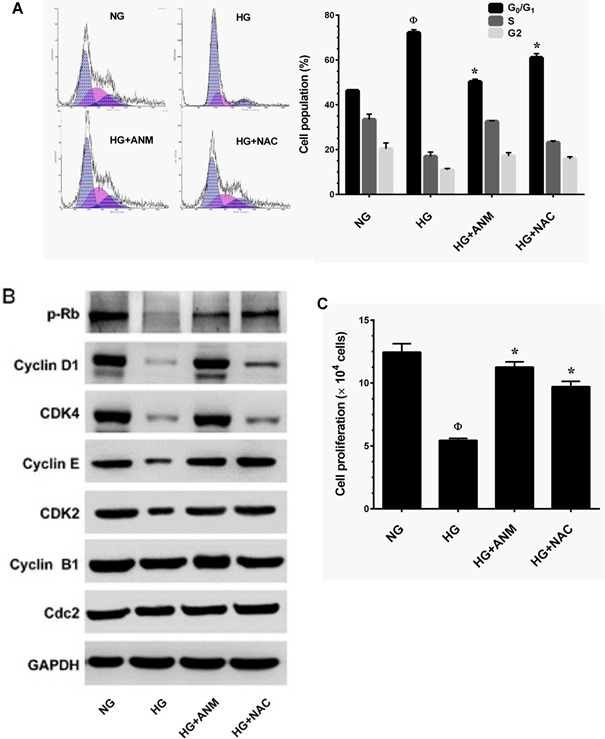
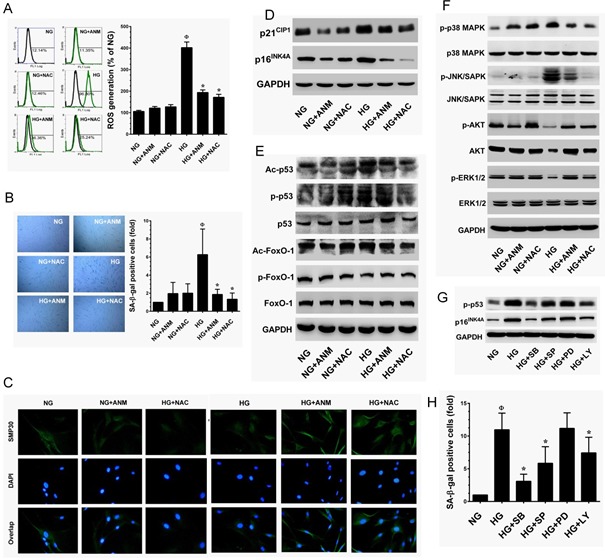
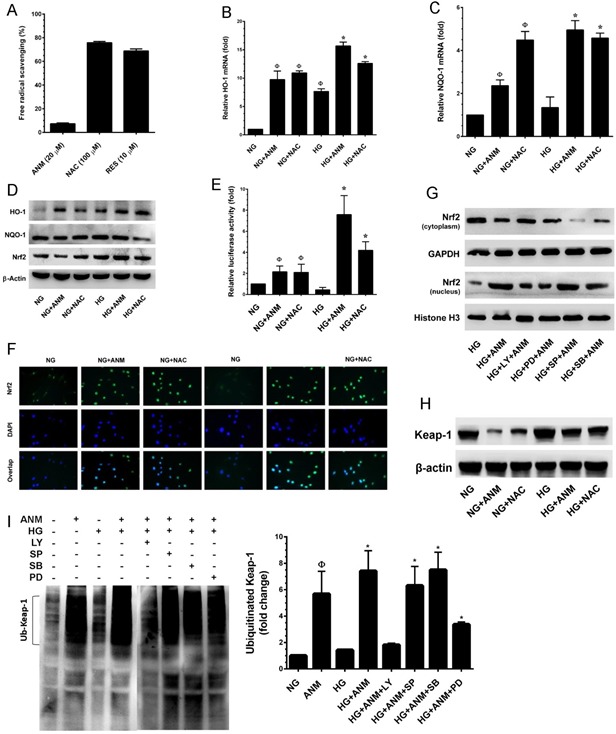
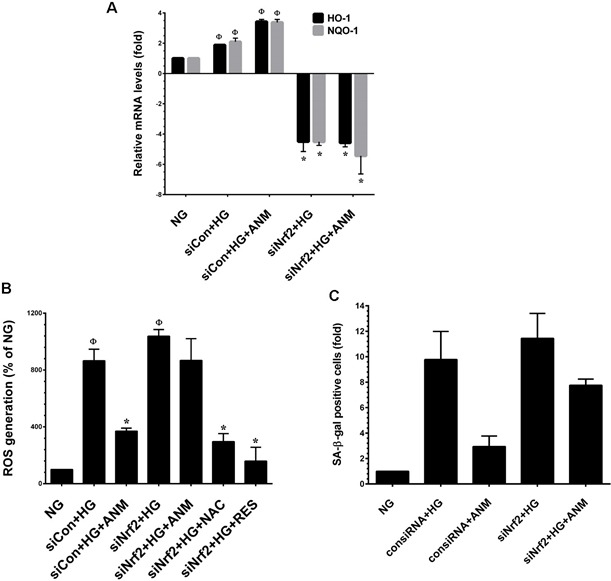
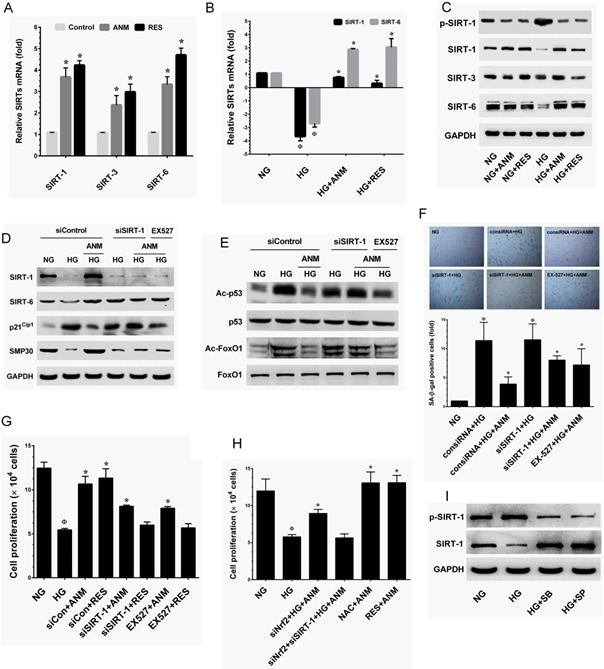
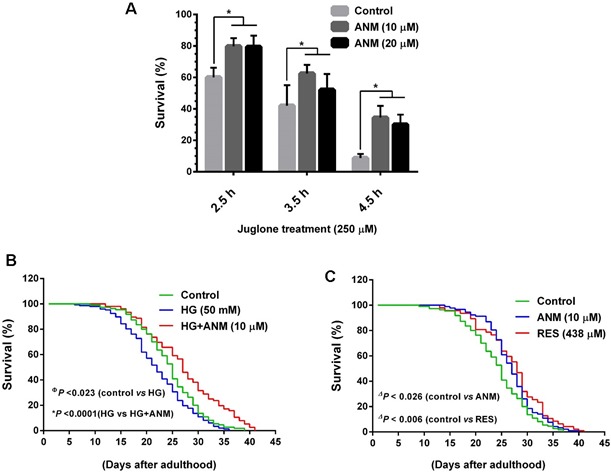
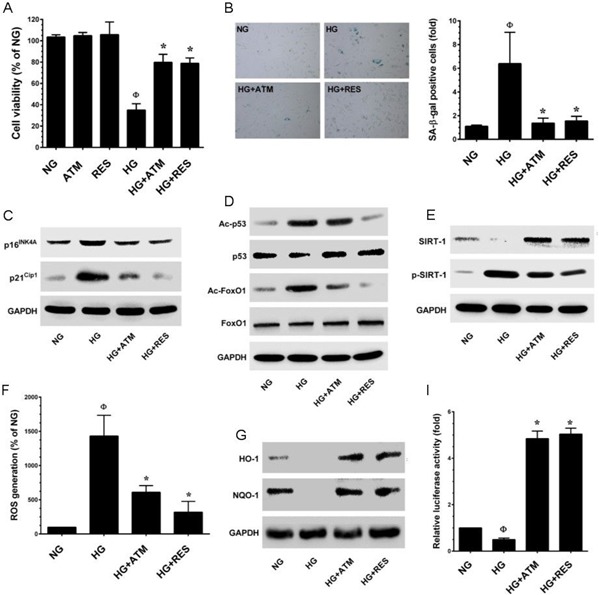
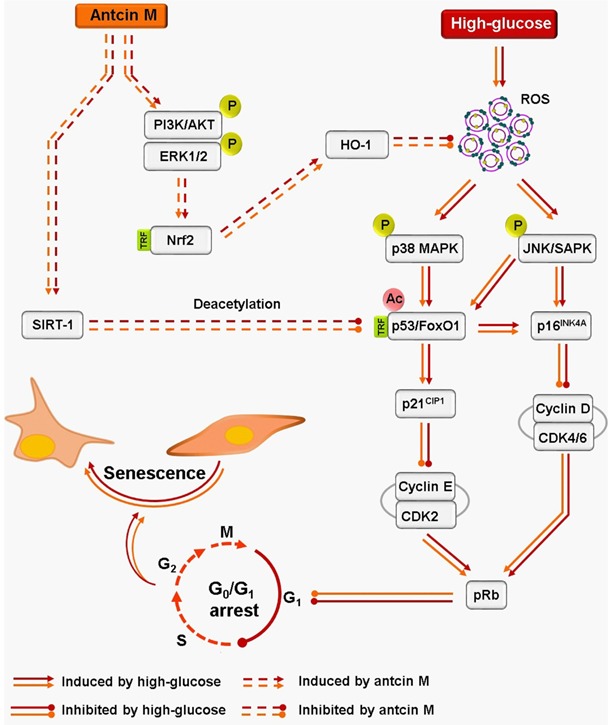
The present study revealed the anti-aging properties of antcin M (ANM) and elucidated the molecular mechanism underlying the effects. We found that exposure of human normal dermal fibroblasts (HNDFs) to high-glucose (HG, 30 mM) for 3 days, accelerated G0/G1 phase arrest and senescence. Indeed, co-treatment with ANM (10 µM) significantly attenuated HG-induced growth arrest and promoted cell proliferation. Further molecular analysis revealed that ANM blocked the HG-induced reduction in G1-S transition regulatory proteins such as cyclin D, cyclin E, CDK4, CDK6, CDK2 and protein retinoblastoma (pRb). In addition, treatment with ANM eliminated HG-induced reactive oxygen species (ROS) through the induction of anti-oxidant genes, HO-1 and NQO-1 via transcriptional activation of Nrf2. Moreover, treatment with ANM abolished HG-induced SIPS as evidenced by reduced senescence-associated β-galactosidase (SA-β-gal) activity. This effect was further confirmed by reduction in senescence-associated marker proteins including, p21CIP1, p16INK4A, and p53/FoxO1 acetylation. Also, the HG-induced decline in aging-related marker protein SMP30 was rescued by ANM. Furthermore, treatment with ANM increased SIRT-1 expression, and prevented SIRT-1 depletion. This protection was consistent with inhibition of SIRT-1 phosphorylation at Ser47 followed by blocking its upstream kinases, p38 MAPK and JNK/SAPK. Further analysis revealed that ANM partially protected HG-induced senescence in SIRT-1 silenced cells. A similar effect was also observed in Nrf2 silenced cells. However, a complete loss of protection was observed in both Nrf2 and SIRT-1 knockdown cells suggesting that both induction of Nrf2-mediated anti-oxidant defense and SIRT-1-mediated deacetylation activity contribute to the anti-aging properties of ANM in vitro. Result of in vivo studies shows that ANM-treated C. elegens exhibits an increased survival rate during HG-induced oxidative stress insult. Furthermore, ANM significantly extended the life span of C. elegans. Taken together, our results suggest the potential application of ANM in age-related diseases or as a preventive reagent against aging process.

Keywords: Antcin M; Gerotarget; SIRT-1; antrodia salmonea; hyperglycemia; stress-induced premature senescence.


Conflict of interest statement

CONFLICTS OF INTEREST

The authors have declared that no competing interests exist.

Figures

Figure 1
Figure 1. High-glucose (HG) accelarates stess-induced premature senescence in dermal fiboblasts
A. HNDFs were incubated with increasing concentrations of HG (15 and 30 mM) for 24-72 h. Cell viability was measured by MTT assay. The percentage of viable cells was compared with normal glucose (NG, 5.5 mM). B. Apoptosis was determined by Annexin-V/PI staining. Percentages of apoptotic cells are shown in the histogram. C. To determine cell proliferation, HNDFs 5 × 10⁴ cells/well in a 6-well plate were incubated with HG for 72 h. Number of viable cells was quantified by the tryphan blue exclusion method using a hemocytometer. D. Cell-cycle distribution was measured by flow cytometer using propidium iodide (PI). Percentage of cell population are shown in the histogram. E. Immunoblotting was performed to determine the expression levels of cell-cycle regulatory proteins including cyclin D1, cyclin E, CDK4, CDK6 and CDK2. GAPDH served as an internal control. F. Cellular senescence was determined by senescence-associated β-galactosidase (SA-β-gal) assay as desceribed in Materials and Methods. The left panel shows representative figures and the right panel shows quantitative analysis of SA-β-gal positive cells per microscopic field. G. Immunofluroscence analysis shows expression and localization of SMP30 in HG-treated HNDFs. H. Western blot analysis shows the protein expression levels of p16INK4A, p21CIP1, and p53 acetylation in HG-induced HNDFs. GAPDH served as an internal control. I. The intracellular ROS level was dertermined by flow cytometry using DCH-DA flurogenic probe. Left panel shows representative figures and the right pane shows quantitative analysis of intracellular ROS in HG-treated HNDFs. Results are expressed as mean ± S.E.M of three indipendent expriments. Statistical significance was set at *P < 0.05 compared to NG vs. HG.
Figure 2
Figure 2. Effects of antcins on HG-induced senescence in HNDFs
A. Type of antcins subjected to screen for potential anti-aging agents for skin aging. Names and chemical structures of the antcins are shown in the left and centrer column, respectively. The cytotoxic effects of antcins against HNDFs. Briefly, HNDFs were incubated with increasing concentrations (1, 5, 10 and 20 μM) of antcins including antcin A, antcin B, antcin C, antcin H, anticn K and antcin M for 72 h and the cell viability was determined by MTT assay. The 50% inhibitory concentrations (IC50) of each compound against HNDFs are shown in right column. B. Cells were incubated with antcin A (10 μM), antcin H (10 μM) and antcin M (10 μM) in the presence of HG (30 mM) for 72 h. Cellular senescence was determined by SA-β-gal activity. The left panel shows representative figures and the right panel shows quantitative analysis of SA-β-gal positive cells per microscopic field. C. HNDFs were incubated with antcin A (10 μM), antcin H (10 μM) and antcin M (10 μM) in the presence of HG (30 mM) for 72 h. Senescence-associated marker proteins such as p16INK4A, p21CIP1 and SMP30 were determined by western blot analysis. D. To determine the effect of antcins on cell proliferation efficacy, HNDFs 5 × 10⁴ cells/well in 6-well plates were incubated with antcins in the presence of HG (30 mM) for 72 h. Number of viable cells were quantified by the tryphan blue exclusion method. Results are expressed as mean ± S.E.M of three indipendent expriments. Statistical significance was et at ФP < 0.05 compared to NG vs HG and *P < 0.05 compared to HG vs. samples.
Figure 3
Figure 3. Antcin M blocked HG-induced growth arrest in HNDFs
A. HNDFs were incubated with ANM (10 μM) or NAC (100 μM) in the presence of HG (30 mM) for 72 h. Cell-cycle distribution was measured by flow cytometer using PI. Percentage of cell population in each transition phase is shown in the histogram. B. Western blot analysis was performed to determine the expresion levels of cell-cycle regulatorty proteins including, pRb, cyclin D1, cyclin E, cyclin B1, CDK4, CDK6, CDK2 and Cdc2. GAPDH served as an internal control. C. To determine the effect of ANM or NAC on cell proliferation, HNDFs 5 × 10⁴ cells/well in a 6-well plates were incubated with ANM (10 μM) or NAC (100 μM) in the presence of HG (30 mM) for 72 h. Number of viable cells was quantified by the tryphan blue exclusion method. Results expressed as mean ± S.E.M of three indipendent expriments. Statisticl significance was et at Ф P < 0.05 compared to NG vs HG and *P < 0.05 compared to HG vs. samples.
Figure 4
Figure 4. Antcin M inhibits HG-induced senescence in HNDFs
A. ANM inhibits HG-induced intracellular ROS. HNDFs were incubated with ANM (10 μM) or NAC (100 μM) either in the presence or absence of HG (30 mM) for 24 h. The intracellular ROS level was determined by flow cytometry using DCH-DA flurogenic probe. The left panel shows representative figures and the right panel shows quantitative analysis of intracellular ROS in HG-treated HNDFs. B. ANM eliminates HG-induced senescenece. HNDFs were incubated with ANM (10 μM) or NAC (100 μM) in the presence or absence of HG (30 mM) for 72 h. Cellular senescence was determined by SA-β-gal assay. The left panel shows representative figures and right panel shows quantitative analysis of SA-β-gal positive cells per microscopic field. C. ANM provides SMP30 expression. HNDFs were incubated with ANM (10 μM) or NAC (100 μM) in the presence or absence of HG (30 mM) for 72 h. The protein expression of SMP30 was measured by immunofluroscence using SMP30 specific primary antibody and fluorescein isothiocyanate-conjugated secondary antibody (green). The cellular localization of SMP30 was photographed using a fluroscence microscope. DAPI (1 μM) was used to stain the nucleus. D.-G. To determine the effect of ANM on senescence-associated protein expression, HNDFs were incubated with ANM (10 μM) or NAC (100 μM) in the presence or absence of HG (30 mM) for 72 h. Immunoblotting analysis was used to determine the protein levels with corresponding specific antibodies. H. p38 MAPK, JNK/SAPK and AKT triggers HG-induced senescence. HNDFs were exposed to HG (30 mM) in the presence or absence of p38 MAPK, JNK/SAPK, ERK1/2 and AKT inhibitors SB203580 (SB, 30 μM), SP600125 (SP, 30 μM), PD98059 (PD, 30 μM) and LY294002 (LY, 30 μM) for 72 h. Cellular senescence was determined by SA-β-gal activity assay. Results expressed as mean ± S.E.M of three indipendent expriments. Statistical significance at Ф, P < 0.05 compared to NG vs. HG and *P < 0.05 compared to HG vs. samples.
Figure 5
Figure 5. Antcin M activates Nrf2-dependent anti-oxidant defense in HNDFs
A. To determine the free-radical scavenging effect of ANM, cell-free DPPH assay was performed. NAC and RES were used as positive controls. B., C. To quantify the mRNA expression levels of HO-1 and NQO-1, HNDFs were incubated with ANM (10 μM) or NAC (100 μM) in the presence or absence of HG (30 mM) for 12 h. Total RNA was extracted and subjected to Q-PCR analysis. Relative mRNA levels were normalized with β-actin mRNA. D. To determine the protein expression levels of HO-1, NQO-1 and Nrf2, HNDFs were incubated with ANM (10 μM) or NAC (100 μM) for 24 h. Total cell lysates were prepared and subjected to western blot analysis to monitor the expression levels of HO-1, NQO-1 and Nrf2. E. To determine the Nrf2 transcriptional activity, HNDFs were transiently transfected with ARE promoter construct using lipofectamine and incubated with ANM (10 μM) or NAC (100 μM) in the presence or absence of HG (30 mM) for 6 h. Cell lysates were mixed with luciferase reagents and quantified using an illuminometer. Relative ARE promoter activity was calculated by dividing the relative luciferace unit (RLU) of treated cells by RLU of untreated cells (NG). F. To determine the nuclear localization of Nrf2, HNDFs were incubated with ANM (10 μM) or NAC (100 μM) in the presence or absence or HG (30 mM) for 2 h. The protein expression and localization of Nrf2 was measured by immunofluorescence using Nrf2 specific primary antibody and fluorescein isothiocyanate-conjugated secondary antibody (green). The subcellular and nuclear localization of Nrf2 was photographed using a fluoroscence microscope. DAPI (1 μM) was used to stain the nucleus. G. HNDFs were pre-incubated with AKT, ERK1/2, JNK/SAPK and p38 MAPK inhbitors LY294002 (LY, 30 μM), PD98059 (PD, 30 μM), SP600125 (SP, 30 μM) and SB203580 (SB, 30 μM), respectively for 2 h and then incubated with ANM (10 μM) in the presence of HG (30 mM) 2 h. Cytoplasmic and nuclear fractions were prepared and subjected to western blot analysis. GAPDH and histone H3 served as internal controls for the cytoplasmic and nuclear fraction, respectively. H. The Keap-1 protein expression level was determined by western blotting. I. Effect of ANM on ubiquitination of Keap-1. Equivalent amount of proteins were immune-precipitated with Keap-1 antibody and visualized by western blotting with ubiquitin antibody. Histogram shows the percentage of ubiquinated Keap-1. Results expressed as mean ± S.E.M of three indipendent expriments. Statistical significance was set at ФP < 0.05 compared to NG vs. HG or ANM alone or NAC alone and *P < 0.05 compared to HG vs. samples.
Figure 6
Figure 6. Antcin M failed to protect HG-induced oxidative stress in Nrf2 silenced cells
A. HNDFs were transfected with specific siRNA against Nrf2 or control siRNA. After transfection for 24 h, cells were incubated with ANM (10 μM) in the presence of HG for 12 h. Total RNA was extracted and subjected to Q-PCR analysis to determine HO-1 and NQO-1 mRNA expression levels. B. HNDFs were transfected with specific siRNA against Nrf2 or control siRNA. After transfection for 24 h, cells were incubated with ANM (10 μM) or NAC (100 μM) or RES (5 μM) in the presence of HG for 24 h. Intracellular ROS was measured by DCFH-DA assay. C. HNDFs were transfected with specific siRNA against Nrf2 or control siRNA. After transfection for 24 h, cells were incubated with ANM (10 μM) in the presence of HG for 72 h. SA-β-gal activity was measured. Results expressed as mean ± S.E.M of three indipendent expriments. Statistical significance was set at Ф, P < 0.05 compared to NG vs. HG or ANM alone or NAC alone and *P < 0.05 compared to HG vs. samples.
Figure 7
Figure 7. Antcin M upregulates SIRT-1 in HNDFs
A. HNDFs were incubated with ANM (10 μM) or RES (5 μM) for 72 h. B. HNDFs were exposed to HG in the prsence or absence of ANM (10 μM) or RES (5 μM) for 72 h. Total RNA was extracted and subjected to Q-PCR analysis to monitor SIRT-1, SIRT-3 and SIRT-6 expression. Relative mRNA levels were normalized by β-actin mRNA. C. HNDFs were incubated with ANM (10 μM) or RES (5 μM) in the presence or absence of HG (30 mM) for 72 h. Total cell lysate was extracted and subjected to western blot analysis to monitor SIRT-1, SIRT-3, SIRT-6 protein levels. D., E. HNDFs were transfected with siRNA against SIRT-1 or control siRNA for 24 h or inhibited by SIRT-1 inhibitor EX527 (5 μM), and then treated with ANM (10 μM) or RES (5 μM) in the presence of HG for 72 h. The protein expression levels of SIRT-1, SIRT-6, p21CIP1, SMP30, p53, FoxO and acetylation of p53 and FoxO1 were determined by western blot analysis. F., G. Under the same conditions, cellular senescence and cell proliferation were measured by SA-β-gal activity assay and tryphan blue exclusion assay, respectively. H. HNDFs were transfected with siNrf2 or a combination of siNrf2 and siSIRT-1, and then incubated with ANM in the presence or absence of HG for 72 h. Cell proliferation was determined by tryphan blue exclussion assay. I. Cells were incubated with JNK/SAPK or p38 MAPK inhibitors SP600125 (SP, 30 μM) and SB203580 (SB, 30 μM) in the presence of HG for 72 h. The protein expression levels of phos-SIRT-1 and SIRT-1 were determined by western blotting. Results expressed as mean ± S.E.M of three indipendent expriments. Statistical significance at Ф, P < 0.05 compared to NG vs HG and *P < 0.05 compared to HG vs. samples.
Figure 8
Figure 8. Antcin M protects wild-type C. elegans from oxidative stress and extent life span
A. To determine oxidative stress resistence, age synchronized wild-type L1 larvae were pretreated with ANM (10 and 20 μM) or DMSO (0.1%) for 3 days. Oxidative stress was induced by incubation of pre-treated worms with 250 μM Juglone for 2.5, 3.5 and 4.5 h and then scored for viability. Results expressed as mean ± S.E.M of triplicate assays. Statistical significance at *P < 0.05 compared to control vs. sample treatment. B. Effect of ANM on the life span of C. elegans under hyperglycemic condition. Age synchronized L1 larvae were cultured in NGM plates wich contain HG (50 mM) with or with out ANM (10 μM) and worm were developed to adulthood. The survival rate was scored everyday and is expressed as a percentage of survival. C. Effect of ANM (10 μM) or RES (438 μM) on the life span extention of C. elegans under normal condition. Results expressed as mean ± S.E.M of three indipendent expriments. Statistical significance at ФP < 0.05 compared to control vs HG, *P < 0.05 compared to HG vs HG+sample and ΔP < 0.05 compared to control vs samples.
Figure 9
Figure 9. Antcin M prevents HG-induced senescence in HUVECs
A. HUVECs were incubated with ANM (10 μM) or RES (5 μM) in the presence or absence of HG (30 mM) for 48 h. Cell viability was dermined by MTT assay. Percentage of viable cells were normalized with control cells (NG). B. Cellular senescence was determined by SA-β-gal activity assay as descrided in Materials and Methods. C., D. Total cell lysate was extracted and senescence-associated marker proteins including p16INK4A, p21CIP1, total and acetylated p53 and FoxO1 were measured by western blot analysis. E. Protein expression levels of SIRT-1 and phos-SIRT-1 were monitored by immunoblotting. F. HUVECs were incubated with ANM (10 μM) or RES (5 μM) in the presence or absence of HG (30 mM) for 48 h. The intracellular ROS level was quantified by utilizing DCFH-DA assay. G. Western blot analysis was performed to determine the protein expression levels of HO-1 and NQO-1. H. HUVECs were transiently transfected with ARE promoter construct using lipofectamine and incubated with ANM (10 μM) or RES (5 μM) in the presence or absence of HG (30 mM) for 6 h. Cell lysates were mixed with luciferase reagents and quantified using an illuminometer. Relative ARE promoter activity was calculated by dividing the relative luciferace unit (RLU) of treated cells by RLU of untraeated cells (NG). Results expressed as mean ± SEM of three indipendent expriments. Statistical significance at ФP < 0.05 compared to NG vs. HG and *P < 0.05 compared to HG vs. samples.
Figure 10
Figure 10. Schematic representation of antcin M-mediated protection against HG-accelarated stress-induced premature senescence in HNDFs and HUVECs
Hyperglycemia induces intracellular ROS, which triggers p38 MAPK and JNK/SAMP activation. The activated p38 MAPK and JNK/SAPK promotes transcriptional activation of p53 and FoxO1 by acetylation. P53 and FoxO1-mediated up-regulation of p16INK4A and p21CIP1 distrubs cyclins and CDKs, which increase protein stability of pRB and allow to G0/G1 cell-cycle arrest and senescence. Conversely, activated p38 MAPK and JNK/SAPK reduce SIRT-1 level by phosphorylating Ser47, eventually losing deacetylation activity. However, treatment with antcin M activates Nrf2-dependent anti-oxidant genes such as HO-1 and NQO-1 followed by activation of PI3K/AKT and ER1/2 kinases, which facilitates ROS inhibition and upregulates SIRT-1 expression in HNDFs and HUVECs. Results expressed as mean ± SEM of three indipendent expriments. Statistical significance at ФP < 0.05 compared to NG vs. HG and *P < 0.05 compared to HG vs. samples.

Similar articles

Cited by

References

    1. Toussaint O, Medrano EE, von Zglinicki T. Cellular and molecular mechanisms of stress-induced premature senescence (SIPS) of human diploid fibroblasts and melanocytes. Exp Gerontol. 2000;35:927–45. - PubMed
    1. Levy L, Zeichner JA. Dermatologic manifestation of diabetes. J Diabetes. 2012;4:68–76. - PubMed
    1. Paron NG, Lambert PW. Cutaneous manifestations of diabetes mellitus. Prim Care. 2000;27:371–83. - PubMed
    1. Goldstein S, Niewiarowski S, Singal DP. Pathological implications of cell aging in vitro. Fed Proc. 1975;34:56–63. - PubMed
    1. Sibbitt WL, Jr, Mills RG, Bigler CF, Eaton RP, Griffey RH, Vander Jagt DL. Glucose inhibition of human fibroblast proliferation and response to growth factors is prevented by inhibitors of aldose reductase. Mech Ageing Develop. 1989;47:265–79. - PubMed

MeSH terms