. 2016 Oct 4;7(40):64987-65000.
doi: 10.18632/oncotarget.11333.

Targeting prohibitins induces apoptosis in acute myeloid leukemia cells

Affiliations

Targeting prohibitins induces apoptosis in acute myeloid leukemia cells

Helena Pomares et al. Oncotarget. .

Abstract

Fluorizoline is a new synthetic molecule that induces apoptosis by selectively targeting prohibitins (PHBs). In this study, the pro-apoptotic effect of fluorizoline was assessed in two cell lines and 21 primary samples from patients with debut of acute myeloid leukemia (AML). Fluorizoline induced apoptosis in AML cells at concentrations in the low micromolar range. All primary samples were sensitive to fluorizoline irrespectively of patients' clinical or genetic features. In addition, fluorizoline inhibited the clonogenic capacity and induced differentiation of AML cells. Fluorizoline increased the mRNA and protein levels of the pro-apoptotic BCL-2 family member NOXA both in cell lines and primary samples analyzed. These results suggest that targeting PHBs could be a new therapeutic strategy for AML.

Keywords: BCL-2 family members; acute myeloid leukemia; apoptosis; cancer; prohibitins.


Conflict of interest statement

CONFLICTS OF INTEREST

D.I.S., S.P., F.A., R.L. and J.G. patented the use of fluorinated thiazolines in the treatment of cancer. The remaining authors declare no conflicts of interest.

Figures
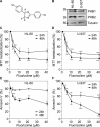
Figure 1
Figure 1. Cytotoxicity of fluorizoline in AML cell lines
(A) Chemical structure of fluorizoline. (B) Whole cell lysates from HL-60 and U-937 cell lines were obtained and total protein levels of PHB1 and PHB2 were analyzed by western blot. Tubulin was used for loading normalization. (C and E) HL-60 cells and (D and F) U-937 cells were incubated for 24 and 48 h with increasing doses of fluorizoline ranging from 2.5 to 40 μM. (C and D) MTT metabolization was measured by absorbance and is expressed as the mean ± SEM (n ≥ 3) of the percentage of the value of untreated cells. (E and F) Viability was measured by analysis of phosphatidylserine exposure and is expressed as the mean ± SEM (n ≥ 3) of the percentage of non-apoptotic (annexin V negative) cells. Two-tailed paired Student's t test significant p values are indicated: *p < 0.05; **p < 0.01; ***p < 0.001 treated versus untreated cells.
Figure 2
Figure 2. Cytotoxicity of fluorizoline in primary AML cells ex vivo
(A) Dose response of fluorizoline on primary AML cells. BMMNC or PBMNC from 21 newly diagnosed AML patients were incubated for 24 and 48 h with increasing doses of fluorizoline ranging from 1.25 to 20 μM. (B) Blasts from 21 AML patients were incubated for 24 h without or with 10 μM fluorizoline. White filled shapes represent 5 patient samples with LD50 values >20 μM. (C) Time course of fluorizoline-induced apoptosis in AML cells. Cells from 6 patients (#13, 14, 16, 18, 20 and 21) were incubated for different times ranging from 2 to 48 h with 10 μM fluorizoline (F) (except patient #21, whose sample was treated with 2.5 μM fluorizoline) or with equivalent concentrations of the vehicle DMSO (D). (D) BMMNC or PBMNC from 3 patients (#6, 10 and 11) incubated for 24 h with increasing doses of fluorizoline ranging from 1.25 to 10 μM. (A, B, C and D) Viability was measured by analysis of phosphatidylserine exposure and is expressed as the percentage of non-apoptotic (annexin V negative) cells (in B and D) or as the percentage of the viability (annexin V negative) of untreated cells (in A) or as the percentage of the viability of cells at 0 h (in C). Data are shown as the mean ± SEM (in A and C). Two-tailed paired Student's t test significant p values are indicated: *p ≤ 0.05; **p ≤ 0.01; ***p ≤ 0.001 treated versus untreated (in A) or DMSO-treated cells at each time point (in C).
Figure 3
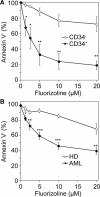
Figure 3. Ex vivo cytotoxicity of fluorizoline in AML cells and in healthy bone marrow and blood myeloid cells
(A) Dose response of the cytotoxic effect of fluorizoline on CD34+ and CD34 populations. BMMNC or PBMNC from 6 AML patients (#1, 2, 18, 19, 20 and 21) were incubated for 48 h with increasing doses of fluorizoline ranging from 1.25 to 20 μM. Viability was measured on CD34 and CD34+ populations. (B) Comparative dose response of the cytotoxic effect of fluorizoline on normal hematologic cells and AML cells. BMMNC from 8 healthy BM or PBSC from one G-CSF-mobilized healthy donor (HD), and BMMNC or PBMNC from 21 newly diagnosed AML patients (AML) were incubated for 24 h with increasing doses of fluorizoline ranging from 1.25 to 20 μM. In normal cells viability was measured on total buffy coat population. (A and B) Viability was measured by analysis of phosphatidylserine exposure and is expressed as the percentage of the viability (annexin V negative) of untreated cells. Data are shown as the mean ± SEM. Two-tailed unpaired Student's t test significant p values are indicated: *p ≤ 0.05; **p ≤ 0.01; ***p ≤ 0.001 CD34+ versus CD34 cells, or normal versus malignant cells.
Figure 4
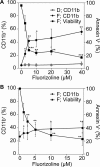
Figure 4. Effect of fluorizoline on the expression of the differentiation marker CD11b in AML cells
(A) U-937 cells were incubated for 48 h with increasing doses of fluorizoline (F) ranging from 2.5 to 40 μM or equivalent concentrations of the vehicle DMSO (D), and CD11b expression and viability were analyzed. (B) Blasts from AML patients (#6, 17, 18 and 22) were incubated for 48 h with increasing doses of fluorizoline (F) ranging from 1.25 to 20 μM, and CD11b expression and viability were analyzed. (A and B) CD11b expression was measured by flow cytometry and is expressed as the percentage of CD11b+ population. Viability was measured by analysis of phosphatidylserine exposure and is expressed as (A) the percentage of non-apoptotic (annexin V negative) cells and (B) the percentage of the viability (annexin V negative) of untreated cells. Data are shown as the mean ± SEM of (A) 3 independent experiments and (B) at least 2 AML patients (n = 2 at 24 h; n = 4 at 48 h). Patient #22 sample does not appear in Table 1 as viability data are not available at 24 h. Two-tailed paired Student's t test significant p values are indicated: *p < 0.05; **p < 0.01; ***p < 0.001 treated versus untreated cells.
Figure 5
Figure 5. Fluorizoline modulates the expression of BCL-2 family members in the U-937 AML cell line
(A) U-937 cells were untreated (U) or treated with 10 μM fluorizoline (F) for 8 h. BCL-2 family members mRNA levels were analyzed by RT-MLPA. Data show the mean ± SEM (n = 2) of the mRNA expression levels. (B) U-937 cells were untreated (U) or treated with equivalent concentrations of the vehicle DMSO (D) for 24 h and with 5 μM fluorizoline for 4, 8 and 24 h, as indicated. (C) U-937 cells were untreated (U) or pre-incubated with 20 μM caspase inhibitor Q-VD-OPh (Q) for 30 min and then treated with 5 μM fluorizoline (F) for 24 h. Cells were also incubated with equivalent concentrations of the vehicle DMSO (D) for 24 h. (B and C) Protein levels from whole cell lysates were analyzed by western blot. Tubulin was used as a loading control. These are representative images of at least three independent experiments. Viability was measured by analysis of phosphatidylserine exposure and is expressed as the percentage of non-apoptotic (annexin V negative) cells.
Figure 6
Figure 6. Induction of NOXA mRNA and protein levels upon fluorizoline treatment in primary AML samples
(A, B and C) BMMNC or PBMNC from patients #13, 14, 16, 18, 20 and 21 were incubated for different times ranging from 2 to 24 h with 10 μM fluorizoline (F or +) (except patient #21, whose sample was treated with 2.5 μM fluorizoline) or with equivalent concentrations of the vehicle DMSO (D or -). (A) After 8 h of treatment, RNA from cells was extracted and analyzed by RT-MLPA and the results for BCL-2 family members are shown as the mean ± SEM (n = 6) of the mRNA expression levels. Two-tailed paired Student's t test significant p values are indicated: *p ≤ 0.05, **p ≤ 0.01, ***p ≤ 0.001 treated versus untreated cells. (B) After the times stated at the figure, cells from patient #14 were collected. (C) After 8 h of treatment, cells from patients #13, 16, 18, 20 and 21 were collected. (D) Cells from patient #20 were pre-incubated with 20 μM caspase inhibitor Q-VD-OPh for 30 min and then treated with 10 μM fluorizoline for 24 h. (B, C and D) Cells were lysed and analyzed by western blot. Tubulin was used for loading normalization. Viability was measured by analysis of phosphatidylserine exposure and is expressed as the percentage of non-apoptotic (annexin V negative) cells. These are representative patient samples of at least three analyzed (n = 6 for B and C; n = 3 for D).

Similar articles

Cited by

References

    1. Döhner H, Weisdorf DJ, Bloomfield CD. Acute Myeloid Leukemia. N Engl J Med. 2015;373:1136–52. - PubMed
    1. Estey EH. Acute myeloid leukemia: 2014 update on risk-stratification and management. Am J Hematol. 2014;89:1063–81. - PubMed
    1. Dombret H, Gardin C. An update of current treatments for adult acute myeloid leukemia. Blood. 2016;127:53–61. - PMC - PubMed
    1. Reinisch A, Chan SM, Thomas D, Majeti R. Biology and Clinical Relevance of Acute Myeloid Leukemia Stem Cells. Semin Hematol. 2015;52:150–64. - PMC - PubMed
    1. Coombs CC, Tallman MS, Levine RL. Molecular therapy for acute myeloid leukaemia. Nat Rev Clin Oncol. 2015 doi: 10.1038/nrclinonc.2015.210. - DOI - PMC - PubMed

MeSH terms