. 2016 Sep 6;134(10):734-51.
doi: 10.1161/CIRCULATIONAHA.116.023926. Epub 2016 Aug 19.

MicroRNA-21 Lowers Blood Pressure in Spontaneous Hypertensive Rats by Upregulating Mitochondrial Translation

Affiliations

MicroRNA-21 Lowers Blood Pressure in Spontaneous Hypertensive Rats by Upregulating Mitochondrial Translation

Huaping Li et al. Circulation. .

Abstract

Background: Excessive reactive oxygen species generated in mitochondria has been implicated as a causal event in hypertensive cardiomyopathy. Multiple recent studies suggest that microRNAs (miRNAs) are able to translocate to mitochondria to modulate mitochondrial activities, but the medical significance of such a new miRNA function has remained unclear. Here, we characterized spontaneous hypertensive rats (SHRs) in comparison with Wistar rats, finding that micro RNA-21 (miR-21) was dramatically induced in SHRs relative to Wistar rats. We designed a series of experiments to determine whether miR-21 is involved in regulating reactive oxygen species generation in mitochondria, and if so, how induced miR-21 may either contribute to hypertensive cardiomyopathy or represent a compensatory response.

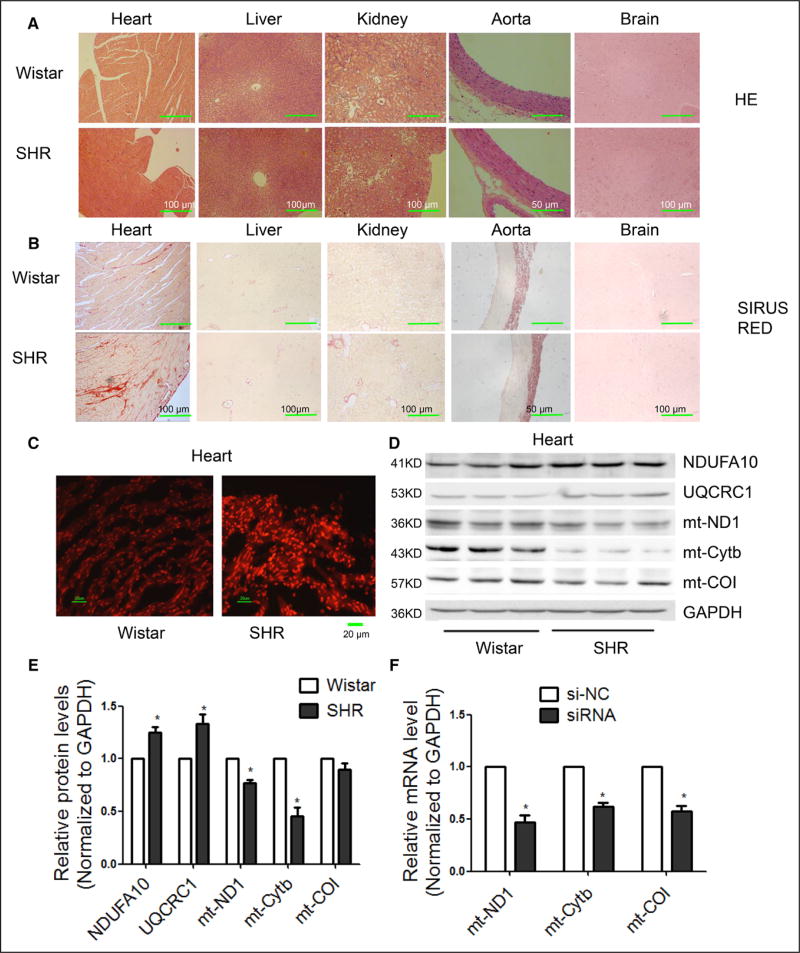
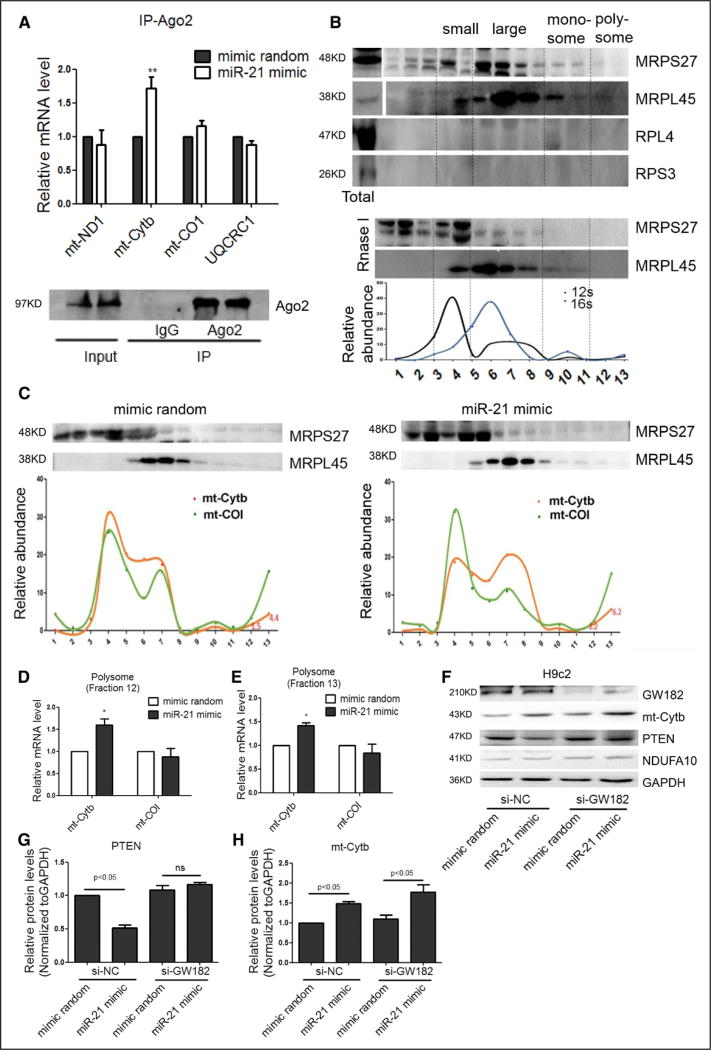
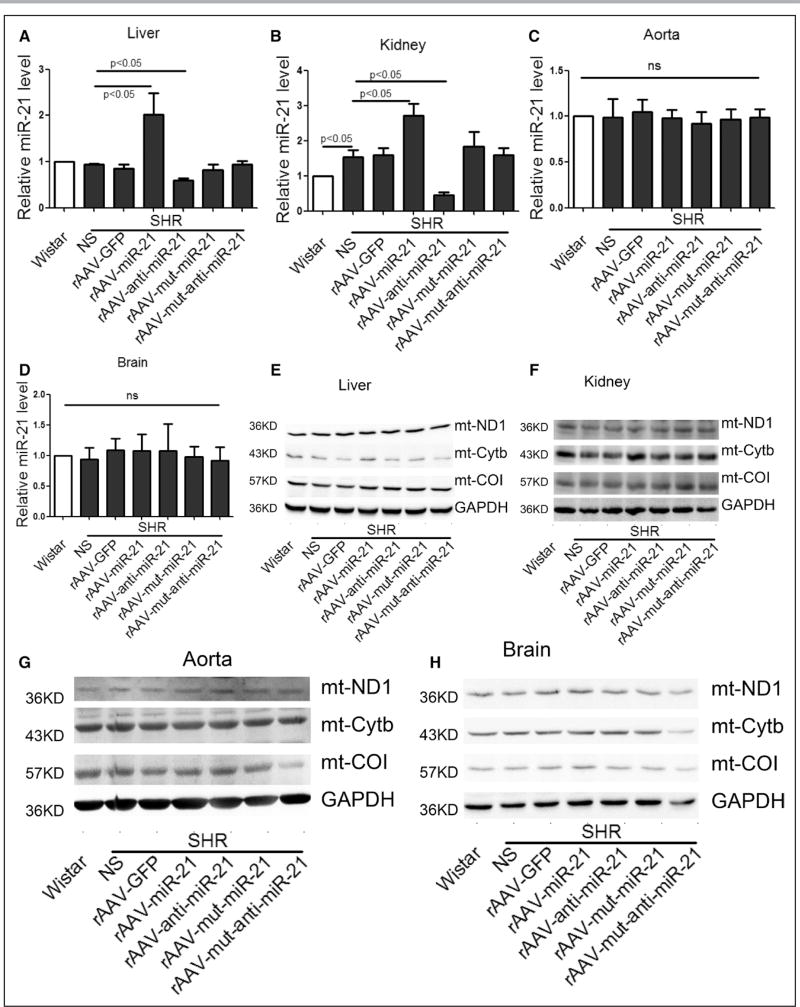
Methods: Western blotting was used to compare the expression of key nuclear genome (nDNA)-encoded and mitochondrial genome (mtDNA)-encoded genes involved in reactive oxygen species production in SHRs and Wistar rats. Bioinformatics was used to predict miRNA targets followed by biochemical validation using quantitative real-time polymerase chain reaction and Ago2 immunoprecipitation. The direct role of miRNA in mitochondria was determined by GW182 dependence, which is required for miRNA to function in the cytoplasm, but not in mitochondria. Recombinant adeno-associated virus (type 9) was used to deliver miRNA mimic to rats via tail vein, and blood pressure was monitored with a photoelectric tail-cuff system. Cardiac structure and functions were assessed by echocardiography and catheter manometer system.

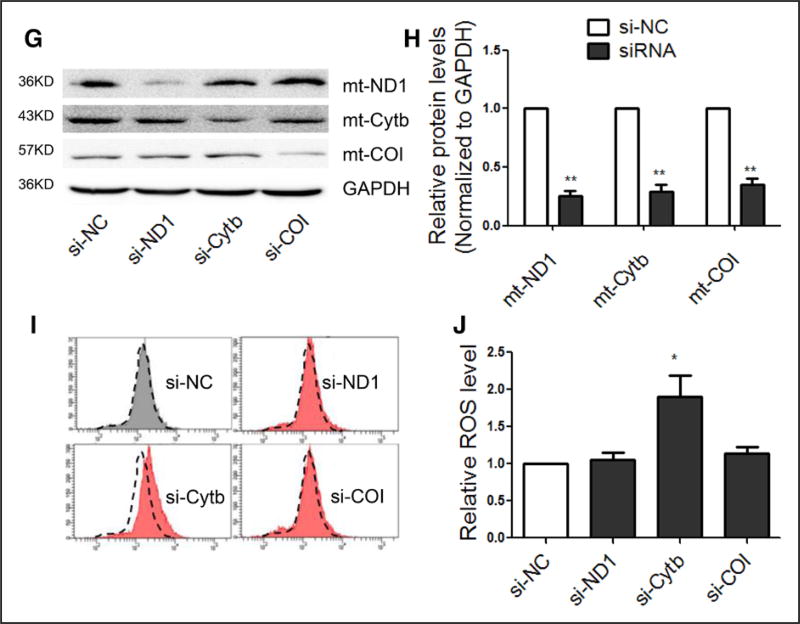
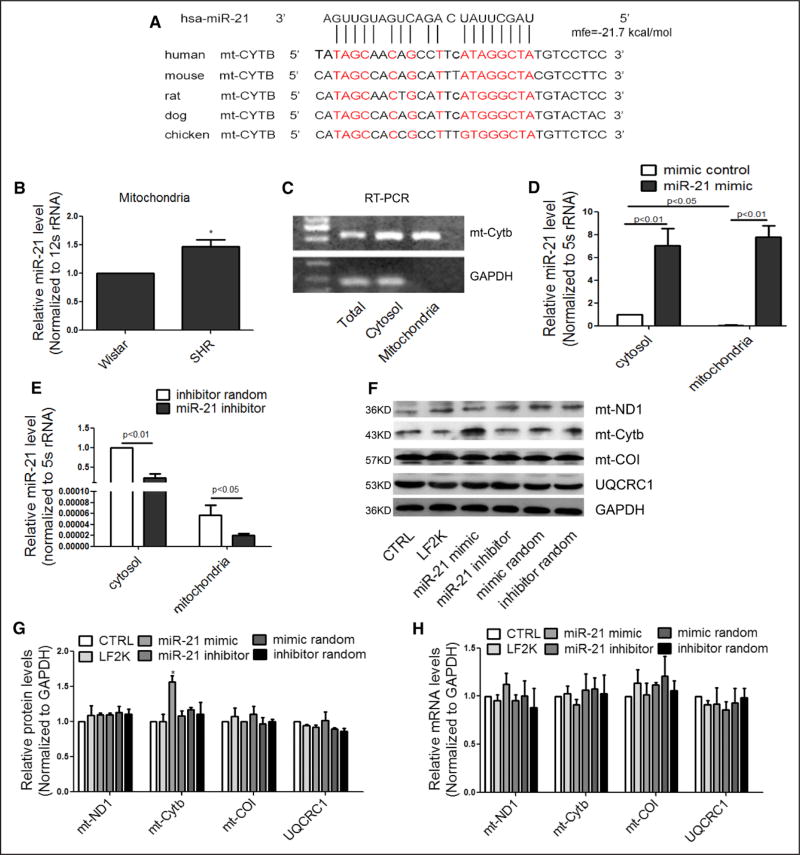
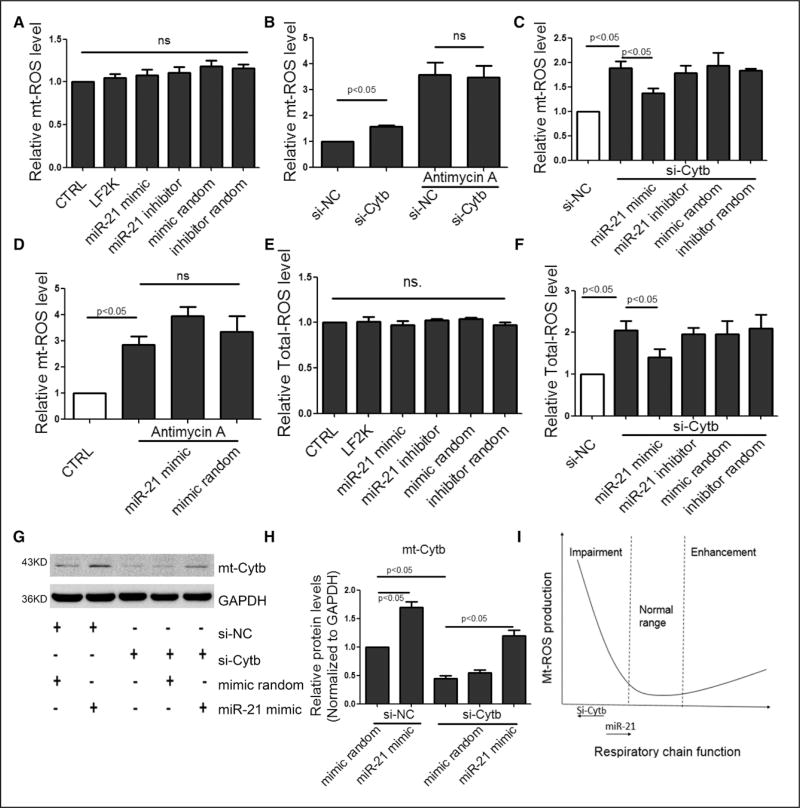
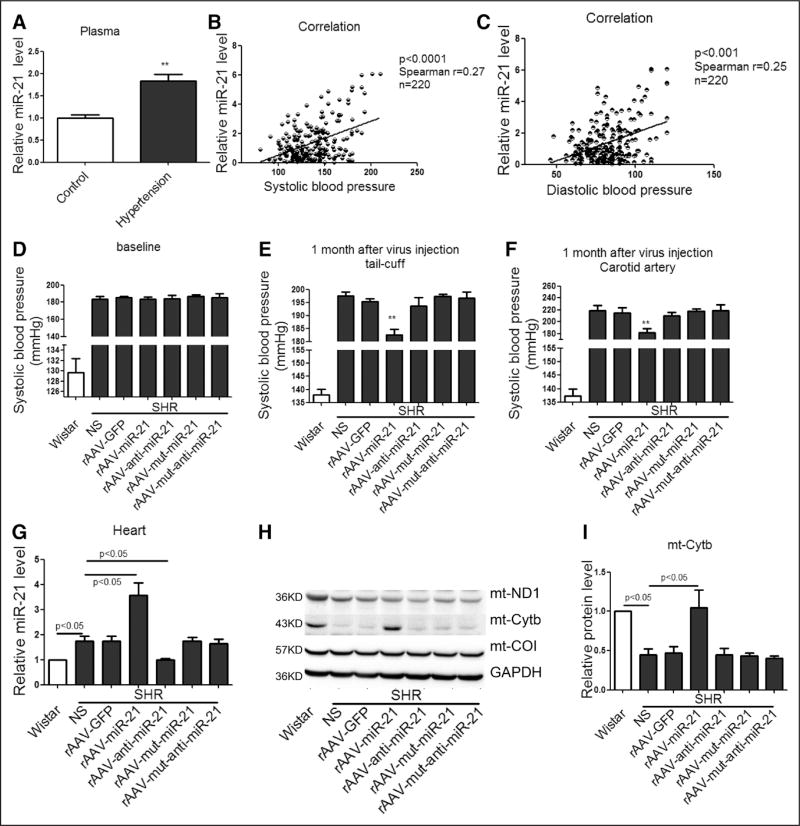
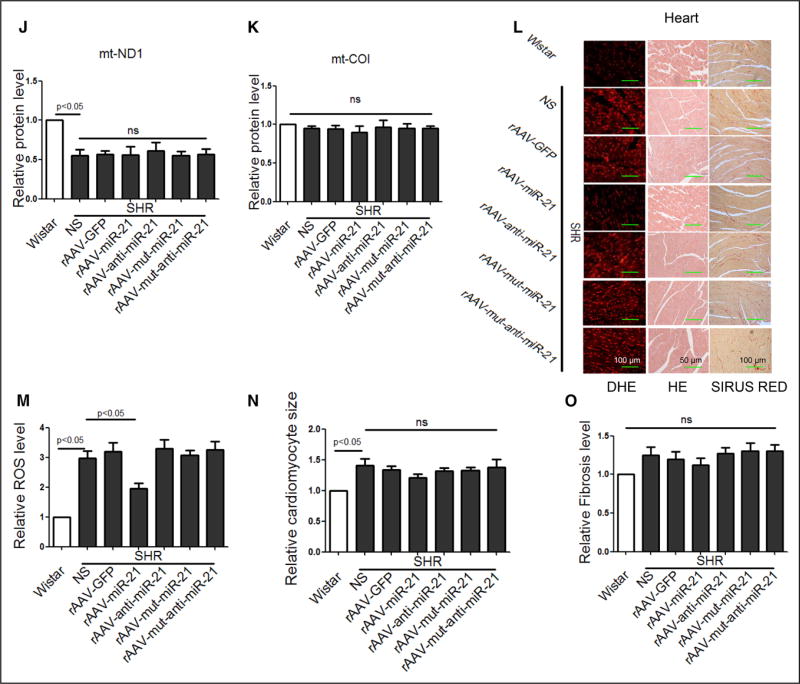
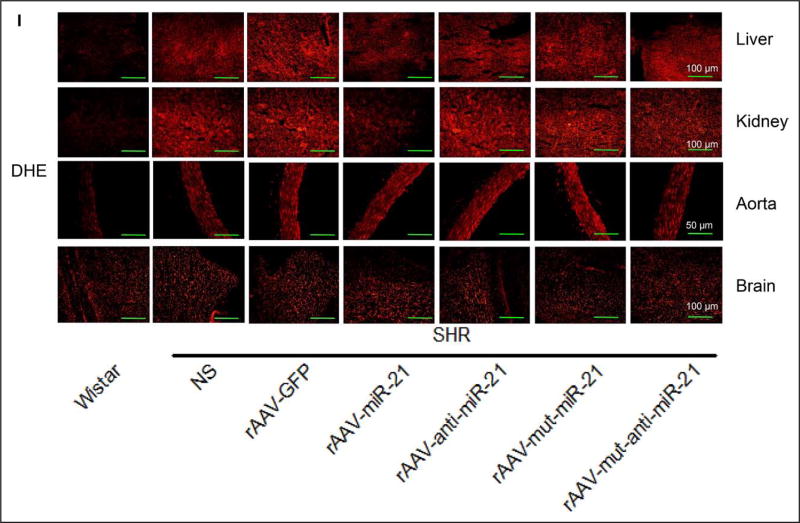
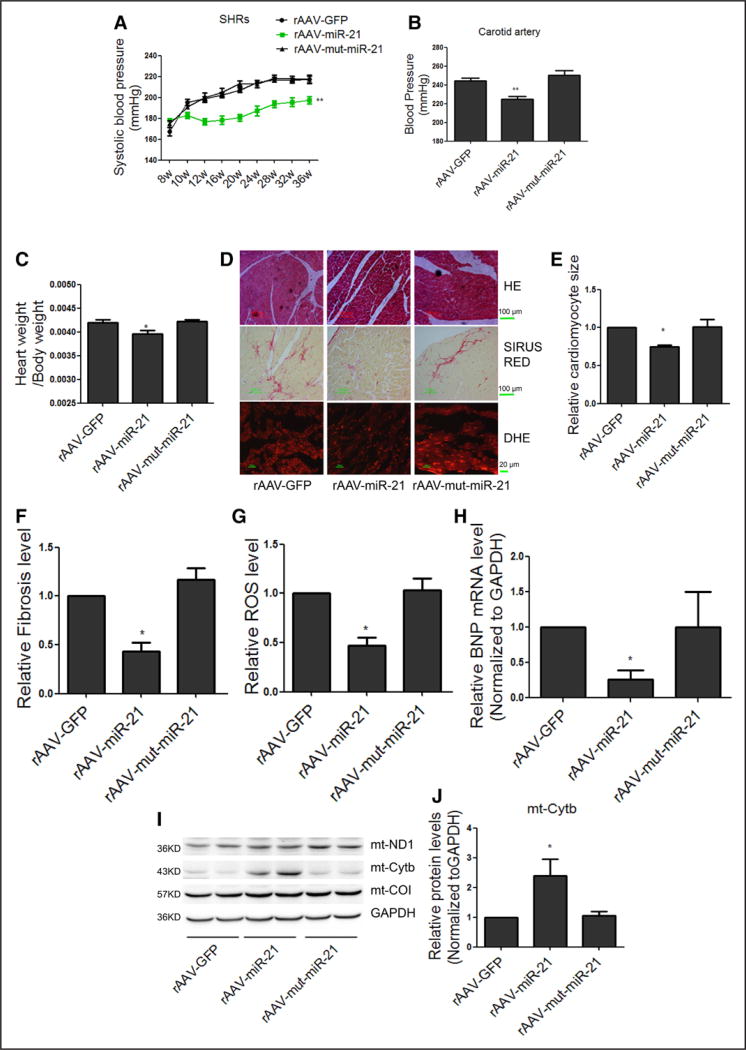
Results: We observed a marked reduction of mtDNA-encoded cytochrome b (mt-Cytb) in the heart of SHRs. Downregulation of mt-Cytb by small interfering RNA in mitochondria recapitulates some key disease features, including elevated reactive oxygen species production. Computational prediction coupled with biochemical analysis revealed that miR-21 directly targeted mt-Cytb to positively modulate mt-Cytb translation in mitochondria. Circulating miR-21 levels in hypertensive patients were significantly higher than those in controls, showing a positive correlation between miR-21 expression and blood pressure. Remarkably, recombinant adeno-associated virus-mediated delivery of miR-21 was sufficient to reduce blood pressure and attenuate cardiac hypertrophy in SHRs.

Conclusions: Our findings reveal a positive function of miR-21 in mitochondrial translation, which is sufficient to reduce blood pressure and alleviate cardiac hypertrophy in SHRs. This observation indicates that induced miR-21 is part of the compensatory program and suggests a novel theoretical ground for developing miRNA-based therapeutics against hypertension.

Keywords: MIR-21 microRNA, human; cytochrome b; mitochondria; reactive oxygen species.


Figures

Figure 1
Figure 1. Downregulated mitochondrial Cytb linked to increased ROS production in the heart of SHRs
A, Representative images of HE staining in various organs of SHRs in comparison with Wistar rats. B, Representative images of Sirius red staining in various organs of SHRs in comparison with Wistar rats. C, Representative images of ROS detected by DHE probe in frozen heart sections of SHRs in comparison with Wistar rats. D and E, Western blot analysis of the ETC subunits in the heart of SHRs. n=3, results from Wistar rats were set to 1, *P<0.05 in comparison with Wistar rats. F, mRNA levels of mitochondrial subunits in H9c2 cells transfected with the indicated siRNAs. n=3, results from si-NC were set to 1, *P<0.05 relative to si-NC. G and H, Protein levels of mitochondrial subunits in H9c2 cells transfected with the indicated siRNAs. I and J, ROS levels in H9c2 cells transfected with si-ND1, si-Cytb or si-COI. n=3, results from si-NC were set to 1. *P<0.05. **P<0.01 related to si-NC. DHE indicates dihydroethidium; ETC, electron transport chain; HE, hematoxylin and eosin; ROS, reactive oxygen species; SHR, spontaneous hypertensive rat; and si, small interfering.
Figure 2
Figure 2. miR-21 enhanced translation of Cytb in the mitochondria
A, Sequence alignment of miR-21 on the Cytb mRNA from different organisms. Extensive base pairings are evident both at the 5′ seed and the 3′ region of miR-21. B, miR-21 levels in purified mitochondria for SHR and Wistar hearts. n=3, results from Wistar rats were set to 1, *P<0.05. C, Real-time PCR analysis of mitochondrial Cytb mRNA and cytoplasmic GAPDH mRNA in purified mitochondria. D and E, miR-21 levels in the cytosol and mitochondria of transfected H9c2 cells. n=3, results from control cytosol were set to 1. F and G, Effects of transfected miR-21 on mitochondrial subunits at the protein levels. n=3, results from control were set to 1, *P<0.05. H, Effects of miR-21 on mitochondrial subunits at the mRNA levels. n=3, results from control were set to 1. mt indicates mitochondrial; RT-PCR, real-time polymerase chain reaction; and SHR, spontaneous hypertensive rat.
Figure 3
Figure 3. miR-21-stimulated interaction of the Cytb mRNA with the mitochondrial translation machinery
A, Real-time PCR analysis of mRNA in association with Ago2 in H9c2 cells. n=3, results from control were set to 1, **P<0.01. B, Mitochondrial polysome profiling. Isolated mitochondria free of markers of cytoplasmic ribosomes (RPS3 and RPL4) were fractionated on a sucrose gradient. The assignment of small and large ribosomal subunits, monosomes, and putative polysomes was based on the distribution of both 12/16S RNAs and mitochondrial ribosomal proteins (MRPS27 and MRPL45). The putative polysome fractions near the bottom of the gradient (fractions 12 and 13) could be converted to monosomes by RNase I treatment. The relative abundance of individual transcripts in each fraction was presented as the percentage of the total fraction. C through E, The association of the Cytb mRNA with putative polysome fractions (fractions 12 and 13) in response to miR-21 mimic treatment. n=3, results from control were set to 1, *P<0.05. F through H, Effects of miR-21 on Cytb and PTEN protein expression with the miRNA machinery selectively inactivated by knocking down GW182 in the cytoplasm, n=3, results from si-NC control were set to 1. miRNA indicates microRNA; mt, mitochondrial; PCR, polymerase chain reaction; and si, small interfering.
Figure 4
Figure 4. Transfected miR-21 mimic to quench ROS
A, Effect of miR-21 on mt-ROS in transfected H9c2 cells. B, Effects of si-Cytb and Antimycin A on mt-ROS. C, Effect of miR-21 on mt-ROS in si-Cytb–treated cells. D, Effect of miR-21 on mt-ROS in Antimycin A–treated cells. E, Effect of miR-21 on total-ROS. F, Effect of miR-21 on total-ROS in si-Cytb–treated cells. G and H, Effect of miR-21 on the Cytb protein level, results from si-NC control were set to 1. I, A model to illustrate the effects of si-Cytb and miR-21 on mt-ROS production. All data were presented as mean±SEM, n=3. mt indicates mitochondrial; ROS, reactive oxygen species; SEM, standard error of the mean; and si, small interfering.
Figure 5
Figure 5. Short-term treatment of rAAV-delivered miR-21 reduced blood pressure in SHRs
A, The levels of circulating miR-21 in healthy control and hypertensive patients. *P<0.01. B, The correlation between circulating miR-21 levels and systolic pressure. C, The correlation between circulating miR-21 levels and diastolic pressure. D and E, Systolic blood pressure in SHRs measured by tail-cuff method. F, Maximum pressure of carotid artery monitored by Millar Pressure-Volume System. G, miR-21 levels in heart of various groups, results from Wistar rats were set to 1. H through K, Western blot analysis of Cytb protein in the heart of rAAV-miR-21–treated SHRs, results from Wistar rats were set to 1. L through O, HE, Sirius red, and DHE staining of myocardial tissue in SHRs. All data were presented as mean±SEM, n=10. *P<0.05. **P<0.01. DHE indicates dihydroethidium; GFP, green fluorescent protein; HE, hematoxylin and eosin; mt, mitochondrial; rAAV, recombinant adeno-associated virus; ROS, reactive oxygen species; SEM, standard error of the mean; and SHR, spontaneous hypertensive rat.
Figure 6
Figure 6. Effects of short-term rAAV-miR-21 treatments in various organs of SHRs
A through D, miR-21 levels in liver, kidney, aorta, and brain of various groups, results from Wistar rats were set to 1. E through H, Western blot analysis of Cytb protein in liver, kidney, aorta, and brain of various groups. I, ROS detected by DHE probe in liver, kidney, aorta, and brain of various groups. All data were presented as mean±SEM, n=5. *P<0.05. **P<0.01. DHE indicates dihydroethidium; GFP, green fluorescent protein; mut, mutation; rAAV, recombinant adeno-associated virus; ROS, reactive oxygen species; SEM, standard error of the mean; and SHR, spontaneous hypertensive rat.
Figure 7
Figure 7. Long-term treatment of rAAV delivered miR-21-reduced blood pressure and inhibited cardiac hypertrophy in SHRs
A, Systolic blood pressure in SHRs measured by tail-cuff method. B, Maximum pressure of carotid artery monitored by Millar Pressure-Volume System. C, Cardiac mass index in SHRs treated with rAAV-miR-21. D, Representative images of HE staining, Sirius red staining and DHE of myocardial tissue in SHRs. E through G, Quantification of cardiomyocyte size, fibrosis, and ROS under different treatment conditions. H, Real-time PCR analysis of BNP mRNA levels in SHR hearts, results from rAAV-GFP were set to 1. I and J, Western blot analysis of Cytb protein in the heart of rAAV-miR-21–treated SHRs, results from rAAV-GFP were set to 1. All data were presented as mean±SEM, curves were compared using repeated measures ANOVA, n=5. *P<0.05. **P<0.01. ANOVA indicates analysis of variance; BNP, brain natriuretic peptide; DHE, dihydroethidium; GFP, green fluorescent protein; HE, hematoxylin and eosin; mt, mitochondrial; mut, mutation; PCR, polymerase chain reaction; rAAV, recombinant adeno-associated virus; ROS, reactive oxygen species; SEM, standard error of the mean; and SHR, spontaneous hypertensive rat.

References

    1. Drazner MH. The progression of hypertensive heart disease. Circulation. 2011;123:327–334. - PubMed
    1. Lip GY, Felmeden DC, Li-Saw-Hee FL, Beevers DG. Hypertensive heart disease. A complex syndrome or a hypertensive ‘cardiomyopathy’? Eur Heart J. 2000;21:1653–1665. - PubMed
    1. Teng L, Zheng J, Leng J, Ding Y. Clinical and molecular characterization of a Han Chinese family with high penetrance of essential hypertension. Mitochondrial DNA. 2012;23:461–465. - PubMed
    1. Nikitin AG, Lavrikova EY, Chistiakov DA. The heteroplasmic 15059G>A mutation in the mitochondrial cytochrome b gene and essential hypertension in type 2 diabetes. Diabetes Metab Syndr. 2012;6:150–156. - PubMed
    1. Ding Y, Xia B, Yu J, Leng J, Huang J. Mitochondrial DNA mutations and essential hypertension (Review) Int J Mol Med. 2013;32:768–774. - PubMed

Publication types

MeSH terms