Review
. 2016 Sep 20;111(6):1132-1140.
doi: 10.1016/j.bpj.2016.07.040. Epub 2016 Aug 17.

Following Optogenetic Dimerizers and Quantitative Prospects

Affiliations
Review

Following Optogenetic Dimerizers and Quantitative Prospects

Jacqueline Niu et al. Biophys J. .

Abstract

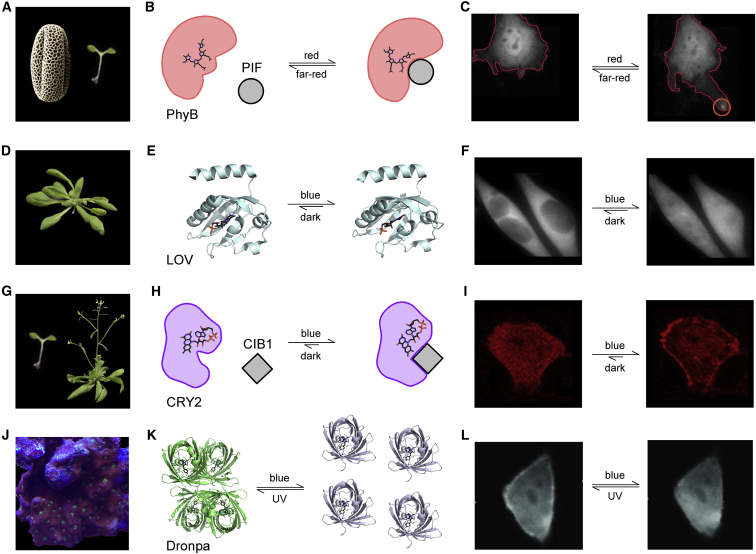
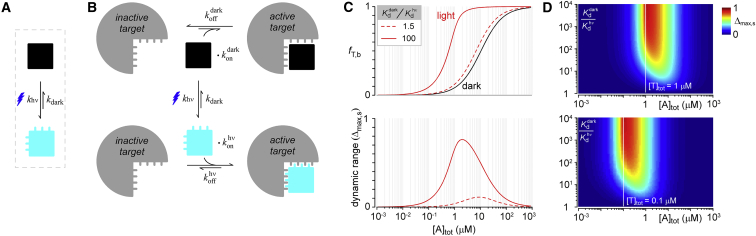
Optogenetics describes the use of genetically encoded photosensitive proteins to direct intended biological processes with light in recombinant and native systems. While most of these light-responsive proteins were originally discovered in photosynthetic organisms, the past few decades have been punctuated by experiments that not only commandeer but also engineer and enhance these natural tools to explore a wide variety of physiological questions. In addition, the ability to tune dynamic range and kinetic rates of optogenetic actuators is a challenging question that is heavily explored with computational methods devised to facilitate optimization of these systems. Here, we explain the basic mechanisms of a few popular photodimerizing optogenetic systems, discuss applications, compare optogenetic tools against more traditional chemical methods, and propose a simple quantitative understanding of how actuators exert their influence on targeted processes.


Figures

Figure 1
Figure 1
Organism of origin and relevant lifecycle is shown for various optogenetic actuators. (A) PhyB is known to be involved in germination and flowering of Arabidopsis thaliana (84). (B) Cartoon depiction of PhyB/PIF photoswitching mechanism with chromophore structure (85). (de-etioliation C) PhyB/PIF-induced lamellipodia formation (red circle) (86). (D) LOV domain of phototropin is a key component of phototropism and stomatal opening in Arabidopsis (84). (E) Atomic structures show two light-dependent configurations of LOV domain isolated from Avena sativa (left, Protein Data Bank (PDB): 2V0U; right, PDB: 2V0W) without the Jα helix (87). An alternate mechanism is LOV photodimerization with an EL222 mutation and VVD. (F) Lov2-Jα mediated nuclear localization (88). (G) CRY2 is an important player in flowering and deetiolation of Arabidopsis (84). (H) Cartoon rendition of CRY2/CIB1 dimerization with blue light (89). Light-dependent oligomerization of CRY2 is another powerful optogenetic mode of operation. (I) Membrane localization of CRY2-Akt in response to blue light (44). (J) Dronpa is a homolog of GFP found in coral Pectiniidae. (K) Crystal structures show reverse dimerization of Dronpa (left, tetramer PDB: 2POX (32); right, monomers PDB: 2IOV (90)). (Green) Fluorescent state; (gray) dark state of Dronpa. (L) Functional exemplar of light-regulated photoswitching of Dronpa (30). For visualization of relocalization, the fluorescence of mNeptune tagged to Dronpa is monitored. Images in (A), (D), and (G) are reproduced from Krämer (91). To see this figure in color, go online.
Figure 2
Figure 2
Schematic depiction of the behavior of an optogenetic actuator. (A) Light-activation leads to conformational changes in the actuator. (B) Four molecular conformations are possible: unbound dark actuator, bound dark actuator, unbound lit actuator, and bound lit actuator. Physical changes resulting from light allow the protein to interact better with its target under illumination and bias it to reside as a bound lit actuator. (C) The top graph shows a simulation for the changes in fraction bound of actuator-target complexes as a function of actuator concentration due to different fold changes in actuator binding affinity before and after light. Similarly, the bottom graph illustrates the dynamic range of actuator-target complexes for these various conditions. (D) Top graph color maps dynamic range at a total target concentration of 1 μM as a function of total actuator concentration and binding affinity fold enhancement for lit versus dark states. An analogous graph is drawn on the bottom for a total target concentration 0.1 μM. (Open line) Total concentration of actuator and target are equal, which is also the optimal total actuator concentration for maximizing dynamic range. To see this figure in color, go online.

Comment in

References

    1. Miesenböck G. The optogenetic catechism. Science. 2009;326:395–399. - PubMed
    1. Broussard G.J., Liang R., Tian L. Monitoring activity in neural circuits with genetically encoded indicators. Front. Mol. Neurosci. 2014;7:97. - PMC - PubMed
    1. Baird G.S., Zacharias D.A., Tsien R.Y. Circular permutation and receptor insertion within green fluorescent proteins. Proc. Natl. Acad. Sci. USA. 1999;96:11241–11246. - PMC - PubMed
    1. Miyawaki A., Llopis J., Tsien R.Y. Fluorescent indicators for Ca2+ based on green fluorescent proteins and calmodulin. Nature. 1997;388:882–887. - PubMed
    1. Paramonov V.M., Mamaeva V., Rivero-Müller A. Genetically-encoded tools for cAMP probing and modulation in living systems. Front. Pharmacol. 2015;6:196. - PMC - PubMed

Substances

LinkOut - more resources