. 2016 Aug 1;30(15):1747-60.
doi: 10.1101/gad.281162.116.

Female mice lacking Xist RNA show partial dosage compensation and survive to term

Affiliations

Female mice lacking Xist RNA show partial dosage compensation and survive to term

Lin Yang et al. Genes Dev. .

Abstract

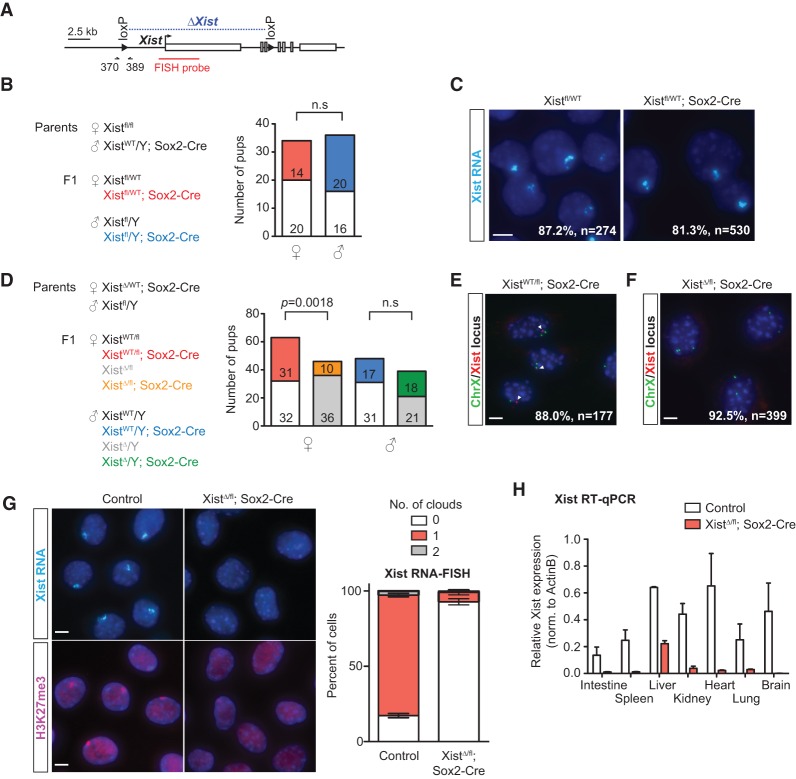
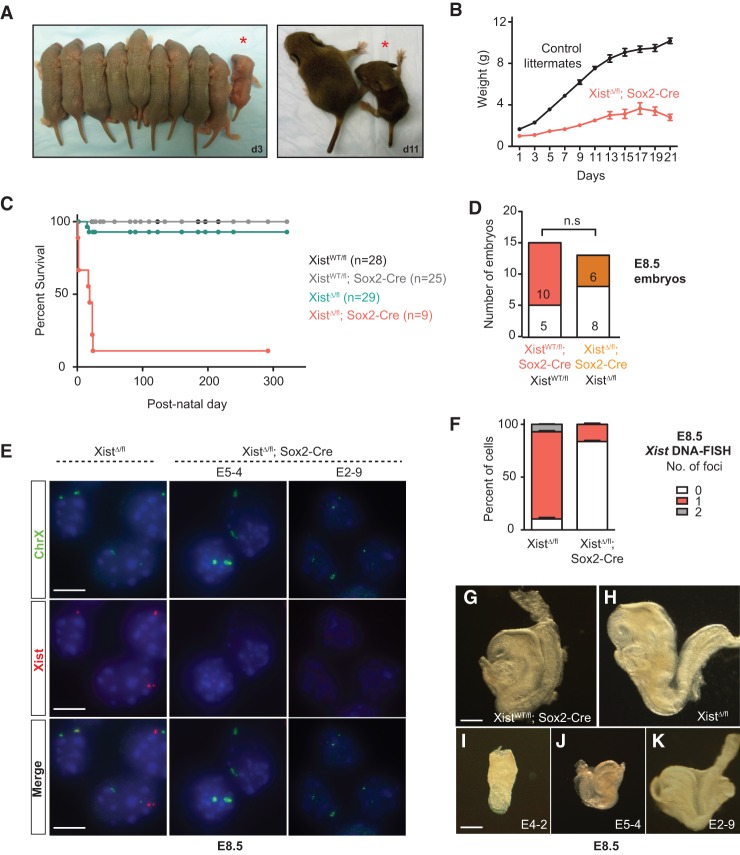
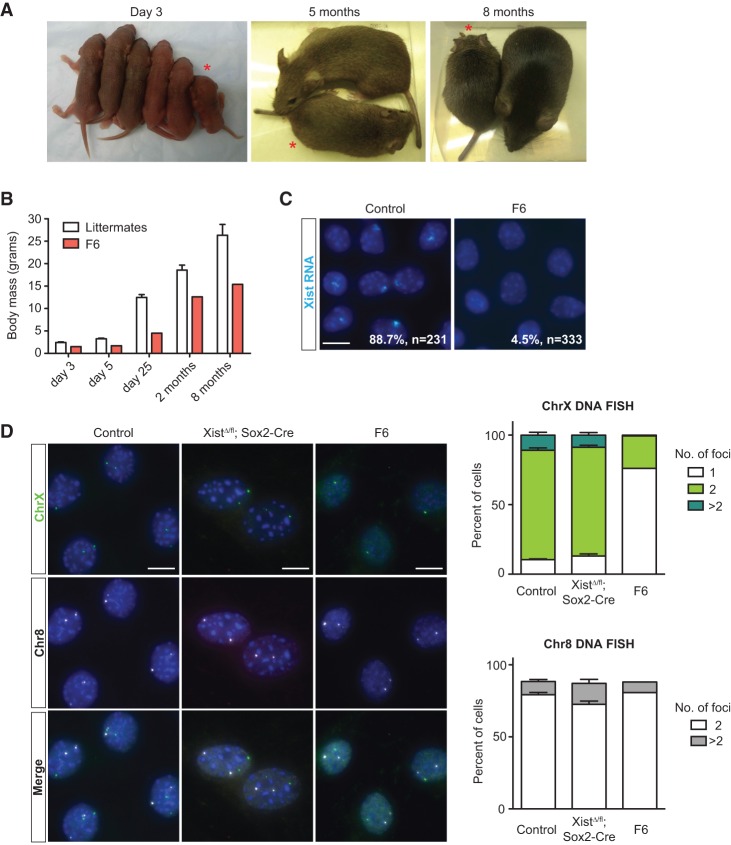
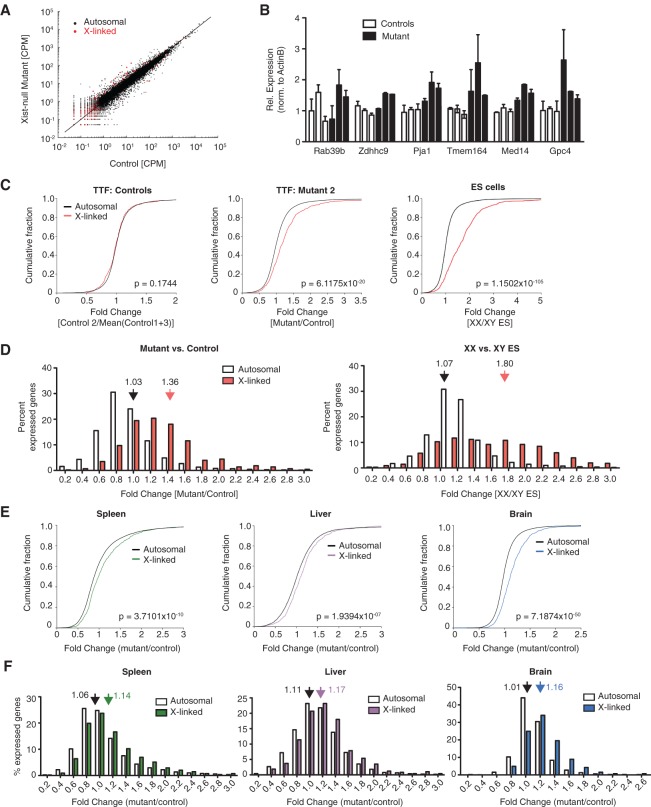
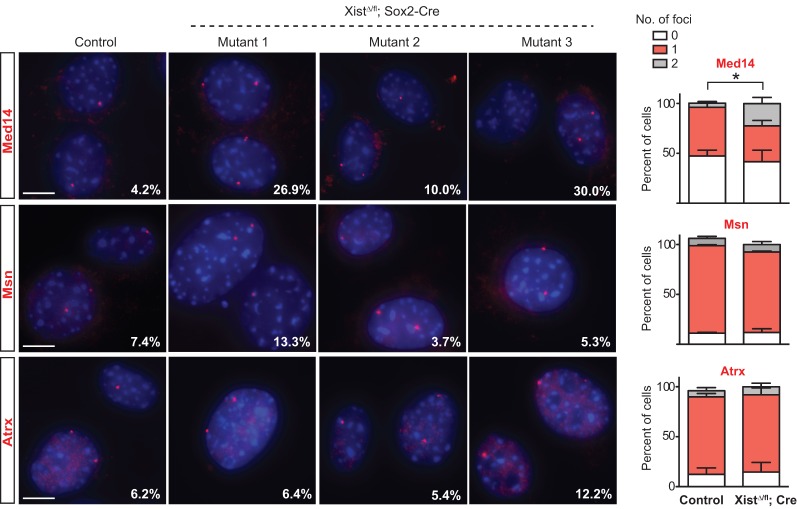
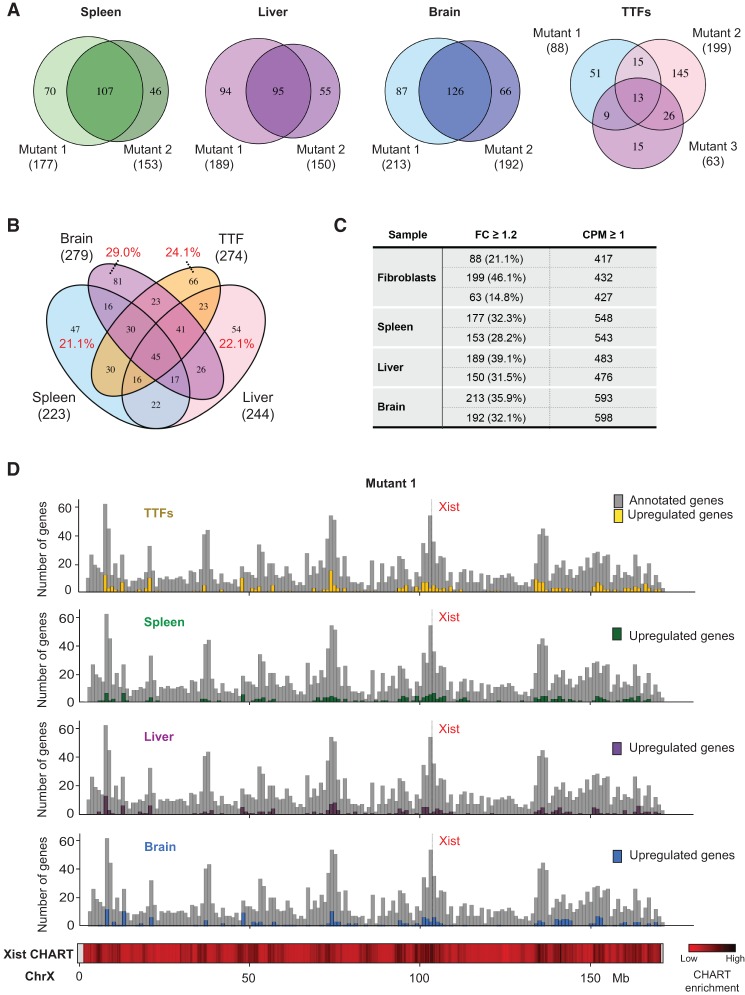
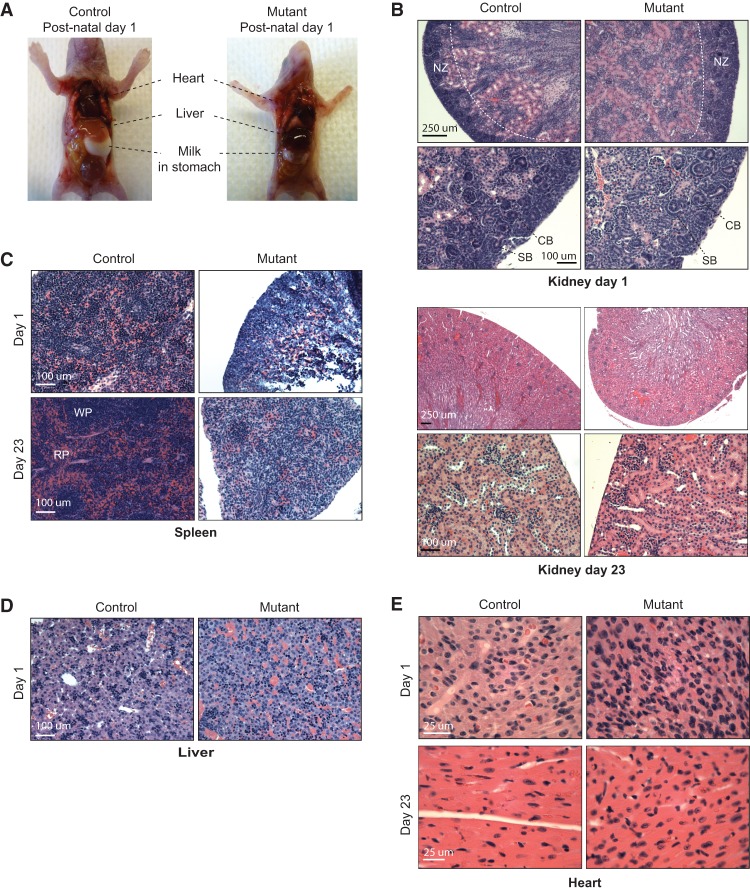
X-chromosome inactivation (XCI) compensates for differences in X-chromosome number between male and female mammals. XCI is orchestrated by Xist RNA, whose expression in early development leads to transcriptional silencing of one X chromosome in the female. Knockout studies have established a requirement for Xist with inviability of female embryos that inherit an Xist deletion from the father. Here, we report that female mice lacking Xist RNA can, surprisingly, develop and survive to term. Xist-null females are born at lower frequency and are smaller at birth, but organogenesis is mostly normal. Transcriptomic analysis indicates significant overexpression of hundreds of X-linked genes across multiple tissues. Therefore, Xist-null mice can develop to term in spite of a deficiency of dosage compensation. However, the degree of X-autosomal dosage imbalance was less than anticipated (1.14-fold to 1.36-fold). Thus, partial dosage compensation can be achieved without Xist, supporting the idea of inherent genome balance. Nevertheless, to date, none of the mutant mice has survived beyond weaning stage. Sudden death is associated with failure of postnatal organ maturation. Our data suggest Xist-independent mechanisms of dosage compensation and demonstrate that small deviations from X-autosomal balance can have profound effects on overall fitness.

Keywords: X inactivation; Xist; dosage compensation; genome balance; inverse effect; knockout mouse; transcriptomics.


Figures

Figure 1.
Figure 1.
Female mice lacking Xist RNA survive to term. (A) Map of the Xist conditional allele used in this study. The region of Xist deletion is indicated in blue. Arrows mark the location of the 370/389 primer set (used for detection of XistWT and Xistfl). The DNA-FISH probe for the Xist locus is indicated in red. (B, left) Schematic for generating heterozygous Xist deletants. (Right) Genotype data for cross; the number of pups for each genotype is listed. All genotypes in both sexes were derived at normal Mendelian ratios. χ2 test, P = 0.67. (n.s.) Not significant. (C) Representative images for Xist RNA-FISH from control (Xistfl/WT) and heterozygous mutant (Xistfl/WT; Sox2-Cre) E14.5 MEFs. Percentages denote cells with one Xist cloud and represent the average of at least two animals per genotype. (n) Number of nuclei counted. Bar, 5 µm. (D, left) Schematic for generating homozygous Xist deletants. (Right) Genotype data for cross, number of pups of each genotype obtained is listed. Homozygous Xist deletants were derived at significantly lower frequency (χ2 test). (n.s.) Not significant. (E) Representative images for Xist DNA-FISH in XistWT/fl; Sox2-Cre TTFs. The percentage denotes cells with one Xist focus (red) and two chromosome X foci (green) and represents the average of two animals. The location of the Xist probe is indicated in A. Arrowheads point to Xist signal. (n) Number of nuclei counted. Bar, 5 µm. (F) Representative images for Xist DNA-FISH in XistΔ/fl; Sox2-Cre TTFs. The percentage denotes cells with no Xist focus (red) and two chromosome X foci (green) and represents the average of three animals. The location of the Xist probe is indicated in A. (n) Number of nuclei counted. Bar, 5 µm. (G, left) Representative images for Xist RNA-FISH (top) and H3K27me3 immunofluorescence (bottom) in control (XistWT/fl; Sox2-Cre) and XistΔ/fl; Sox2-Cre TTFs. (Right) Quantification for RNA-FISH. At least 100 nuclei from each animal were counted. Data represent mean ± SEM of at least two animals per genotype. Bar, 5 µm. (H) RT-qPCR for Xist levels in different tissues. Data represent mean ± SEM for two controls and three Xist-null mutants.
Figure 2.
Figure 2.
Xist-null female mice have decreased fitness. (A) Female littermates from homozygous crosses at P3 (d3, left) and P11 (d11, right). Homozygous Xist mutants are indicated by asterisks. (B) Body weight of Xist mutants (n = 3) and female littermate controls (n = 10). Error bars indicate mean ± SEM. (C) Kaplan-Meier survival curve for homozygous Xist mutants and female littermate controls. (D) Genotype data from homozygous cross at E8.5. The observed number of embryos is listed. (n.s.) Not significant. (E) Representative images for Xist and chromosome X DNA-FISH to quantify deletion efficiency at E8.5. Data for two Xist-null mutants are shown. Bar, 10 µm. (F) Quantification for DNA-FISH shown in E. Fifty to 100 nuclei from each animal were counted, depending on the size of the embryo. Data represent mean ± SEM of two XistΔ/fl and three XistΔ/fl; Sox2-Cre embryos. (GK) E8.5 embryos of various genotypes. E4-2, E5-4, and E2-9 are XistΔ/fl; Sox2-Cre embryos showing different degrees of developmental defect and/or runting. Bar, 250 µm.
Figure 3.
Figure 3.
The surviving Xist-null female is a mosaic of XX and XO cells. (A) Xist mutant F6 and female littermates at P3 (day 3) and 5 mo and 8 mo of age. F6 is indicated by an asterisk. (B) Body weight of F6 and female littermate controls (n = 5) up to 8 mo of age. Data represent mean ± SEM. (C) Representative images for Xist RNA-FISH in TTFs of controls (XistWT/fl; Sox2-Cre) and F6 females. Percentages denote cells with one Xist cloud and, for controls, represent the average of two animals. (n) Number of nuclei counted. Bar, 10 µm. (D, left) Representative images for DNA-FISH using probes mapping to chromosome X and chromosome 8 in controls (XistWT/fl; Sox2-Cre), XistΔ/fl; Sox2-Cre animals, and female F6. (Right) Quantification for chromosome X (top) and chromosome 8 (bottom) DNA-FISH. At least 100 nuclei from each animal were counted. For chromosome X analysis, cells with more than two chromosome 8 foci were omitted. Data represent mean ± SEM. Controls, n = 3; XistΔ/fl; Sox2-Cre, n = 7. Bar, 10 µm.
Figure 4.
Figure 4.
Partial dosage compensation in Xist-null female mice. (A) Scatter plot for normalized read counts of all X-linked (red) and autosomal (black) genes in primary TTFs derived from control (XistWT/fl; Sox2-Cre) versus Xist-null mutant (XistΔ/fl; Sox2-Cre) mice. (B) RT-qPCR validation of RNA-seq data. Expression was normalized to β-actin. Data represent mean ± SEM of two replicate experiments. Data for six animals (three controls and three Xist-null mutants) are shown individually. (C) Cumulative distribution plots for fold changes in X-linked (red) and autosomal (black) genes in a control TTF line (relative to the average of other controls) (left), Xist-null TTF line (relative to the average of all controls) (middle), and female undifferentiated ES cells (relative to male ES cells) (right). Only genes with CPM ≥ 1 were considered. P-values given by Wilcoxon's rank sum test. (D, left) Distribution of X-linked (red) versus autosomal (white) fold changes in Xist-null TTFs relative to control cells. To minimize the effects due to noise, only genes with CPM ≥ 1 were considered. Fold changes are binned in steps of 0.2 (i.e., label of 0.2 on the X-axis includes all genes with fold changes between 0.0 and 0.2). Average fold changes of X-linked or autosomal genes are indicated. (Right) Distribution of X-linked (red) versus autosomal (white) fold changes in XX female ES cells relative to XY male ES cells. Average fold changes of X-linked or autosomal genes are indicated. (E) Cumulative distribution plots for fold changes in X-linked and autosomal genes (black) for the spleen (left), liver (middle), and brain (right) of the P1 Xist-null mutant relative to the average of age-matched control females. n = 2. Only genes with CPM ≥ 1 were considered. P-values were given by Wilcoxon's rank sum test. (F) Distribution of X-linked versus autosomal fold changes for the spleen (left), liver (middle), and brain (right) of the Xist-null mutant from D relative to age-matched control females. n = 2. Only genes with CPM ≥ 1 were considered. Average fold changes of X-linked or autosomal genes are indicated.
Figure 5.
Figure 5.
RNA-FISH analysis of up-regulated X-linked genes. Representative RNA-FISH images for Med14, Msn, and Atrx. Data for three Xist-null TTF lines are shown. Percentages denote cells with two foci. At least 100 nuclei were counted per sample. RNA-FISH results are quantified in the graphs for each gene. The percentage of cells with two Med14 foci is significantly increased in Xist-null TTFs. t-test, P = 0.044. Data represent mean ± SEM. n = 3 per genotype. Bar, 10 µm.
Figure 6.
Figure 6.
Up-regulated X-linked genes show significant overlap across tissues and correlate with high-density Xist-binding sites observed in normal cells. (A) Venn diagrams showing overlap in up-regulated (fold change [FC] ≥ 1.2) X-linked genes between two (for tissues) or three (for fibroblasts) biological replicates. The total number of up-regulated genes for each sample is indicated in parentheses. (B) Venn diagram showing overlap in up-regulated (fold change ≥ 1.2) X-linked genes across the spleen, liver, heart, and fibroblasts. The total number of up-regulated genes for each cell/tissue type is indicated in parentheses. The percentages refer to the fraction of up-regulated genes specific to one cell/tissue type. (C) The number of up-regulated X-linked genes in each cell/tissue type, along with the total number of expressed genes in the corresponding sample. Replicates are shown individually. (D) Histogram (in 1-Mb bins) showing the number of up-regulated genes and their locations along the X chromosome. Gene density is plotted in gray. Heat map for Xist CHART data performed for day 3 differentiating female ES cells shown (Simon et al. 2013).
Figure 7.
Figure 7.
Xist-null mutants are grossly normal but show developmental defects of the spleen and heart. (A) Xist-null mutant and female control littermates at P1. (B) H&E stainings for kidneys from one mutant and one control animal at P1 (top panel) and P23 (bottom panel). For each animal, H&E stainings are shown at two magnifications. Bars: lower magnification (4× or 10× objectives), 250 µm; higher magnification (20× objectives), 100 µm. (NZ) Nephrogenic zone; (CB) comma-shaped body; (SB) S-shaped body. (C) H&E stainings for spleens from one mutant and one control animal at P1 (day 1) and P23 (day 23). Bars (20× objective), 100 µm. (RP) Red pulp; (WP) white pulp. (D) H&E stainings for livers from one mutant and one control animal at P1 (day 1). Bars (20× objective), 100 µm. (E) H&E stainings for cardiac muscle from one mutant and one control animal at P1 (day 1) and P23 (day 23). Bars (40× objective), 25 µm.

Similar articles

Cited by

References

    1. Alkass K, Panula J, Westman M, Wu TD, Guerquin-Kern JL, Bergmann O. 2015. No evidence for cardiomyocyte number expansion in preadolescent mice. Cell 163: 1026–1036. - PubMed
    1. Anders S, Pyl PT, Huber W. 2015. HTSeq—a Python framework to work with high-throughput sequencing data. Bioinformatics 31: 166–169. - PMC - PubMed
    1. Birchler JA. 2013. Aneuploidy in plants and flies: the origin of studies of genomic imbalance. Semin Cell Dev Biol 24: 315–319. - PubMed
    1. Birchler JA, Hiebert JC, Krietzman M. 1989. Gene expression in adult metafemales of Drosophila melanogaster. Genetics 122: 869–879. - PMC - PubMed
    1. Birchler JA, Hiebert JC, Paigen K. 1990. Analysis of autosomal dosage compensation involving the alcohol dehydrogenase locus in Drosophila melanogaster. Genetics 124: 679–686. - PMC - PubMed

Publication types