. 2016 Aug 1;30(15):1761-75.
doi: 10.1101/gad.281030.116.

Codon usage affects the structure and function of the Drosophila circadian clock protein PERIOD

Affiliations

Codon usage affects the structure and function of the Drosophila circadian clock protein PERIOD

Jingjing Fu et al. Genes Dev. .

Abstract

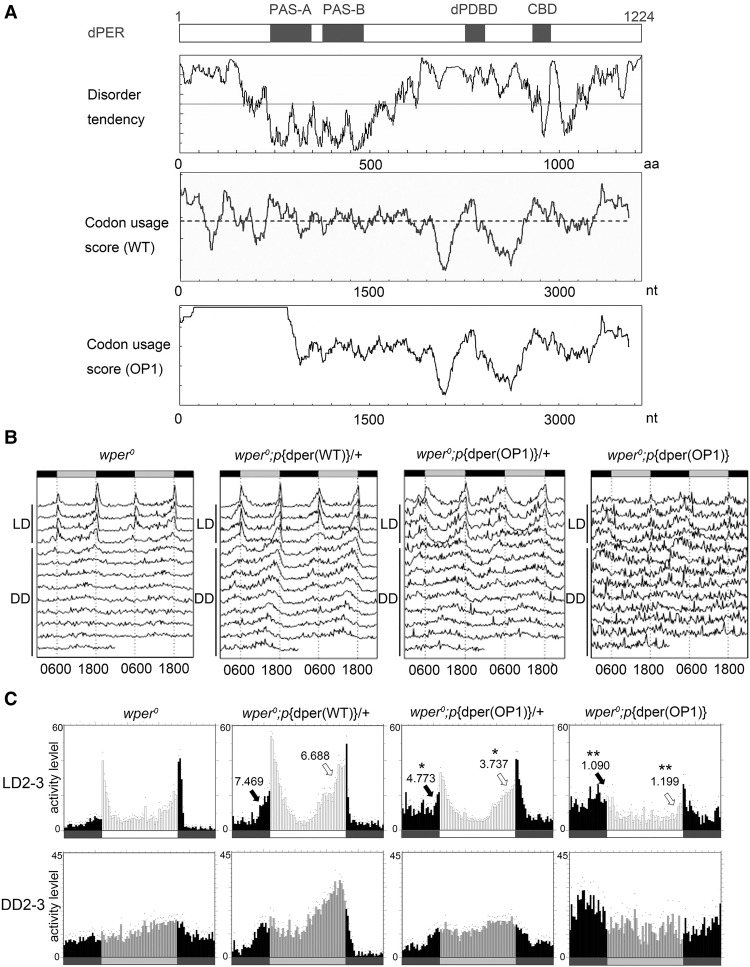
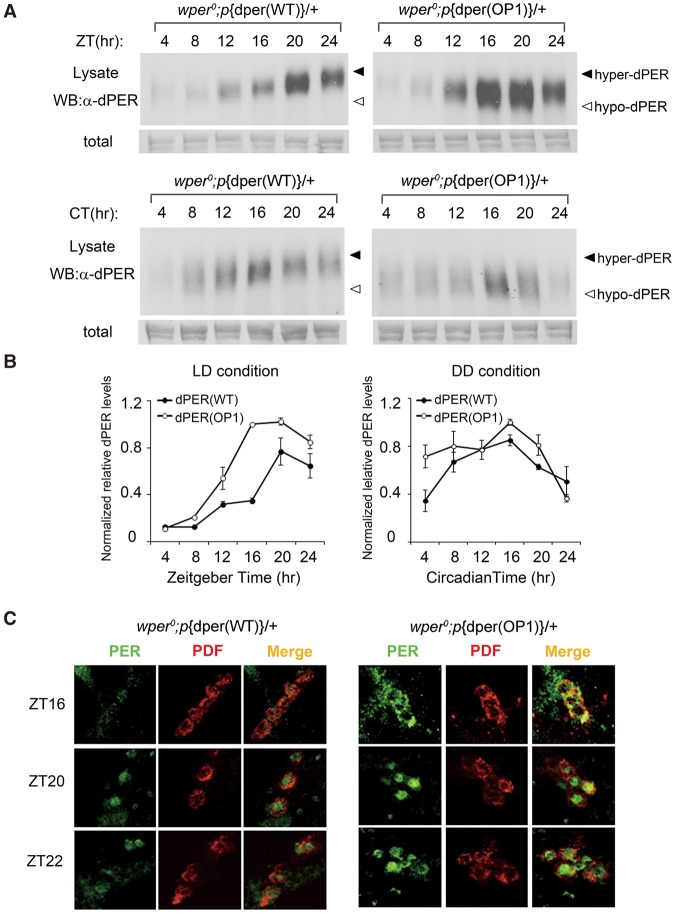
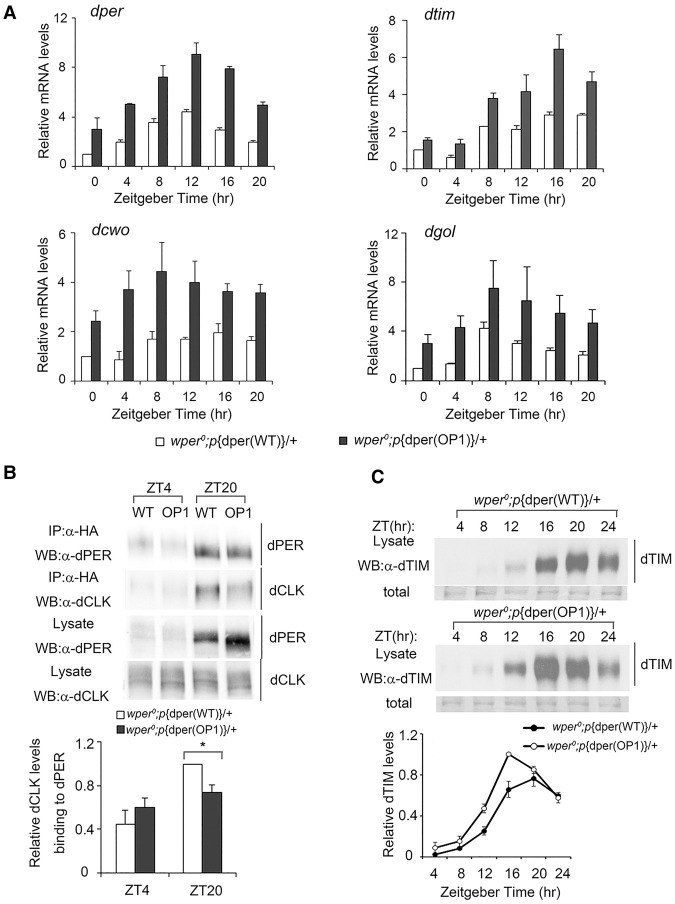
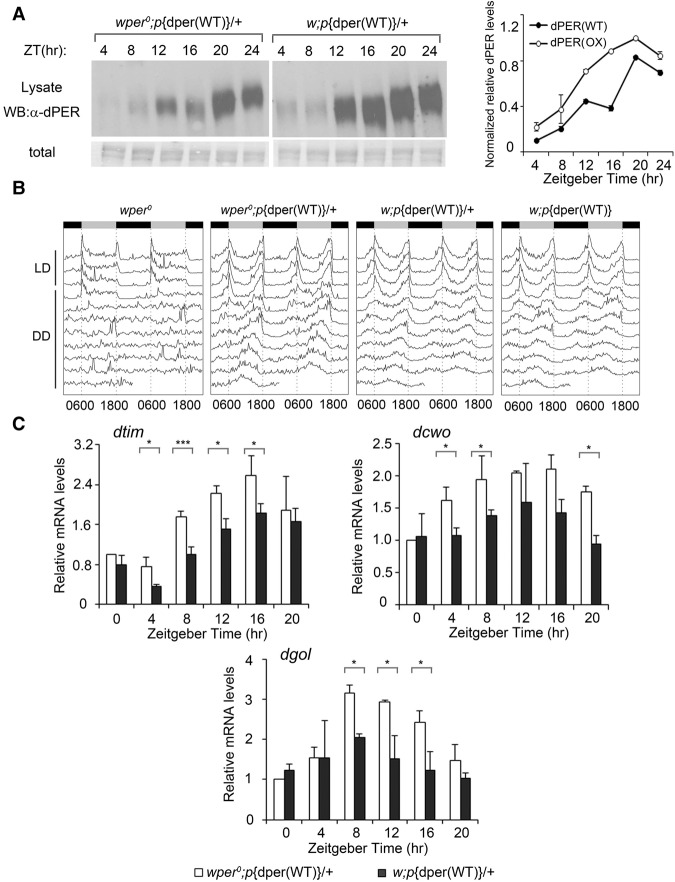
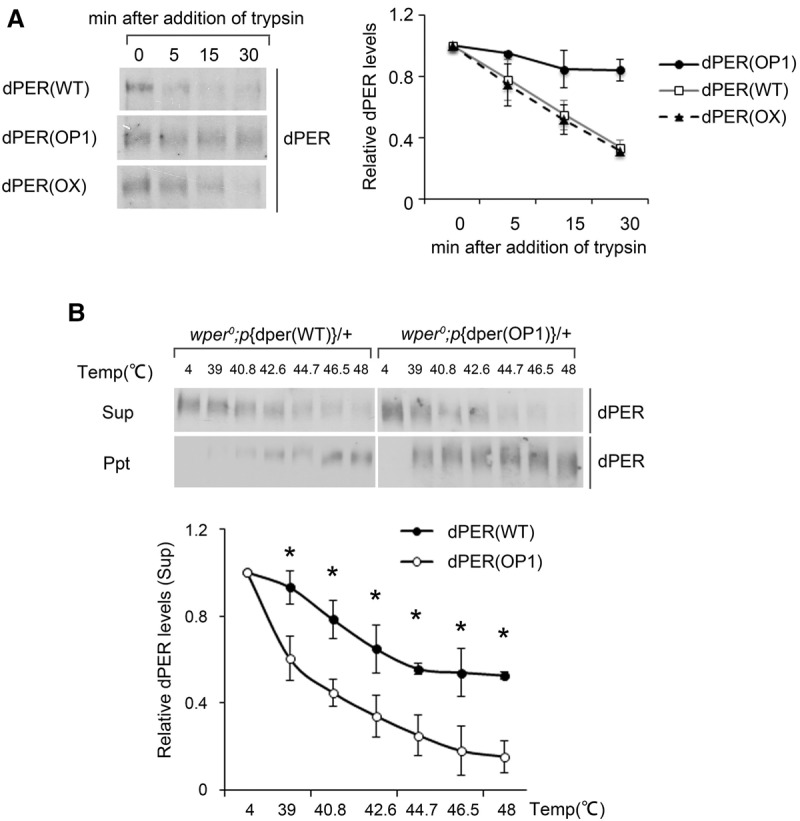
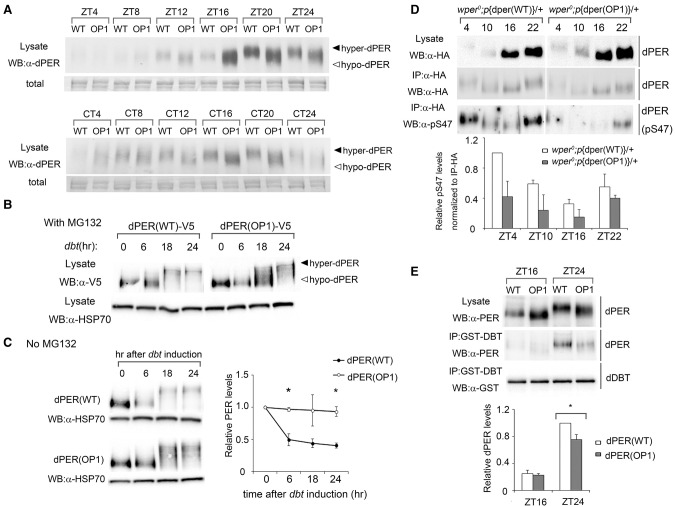
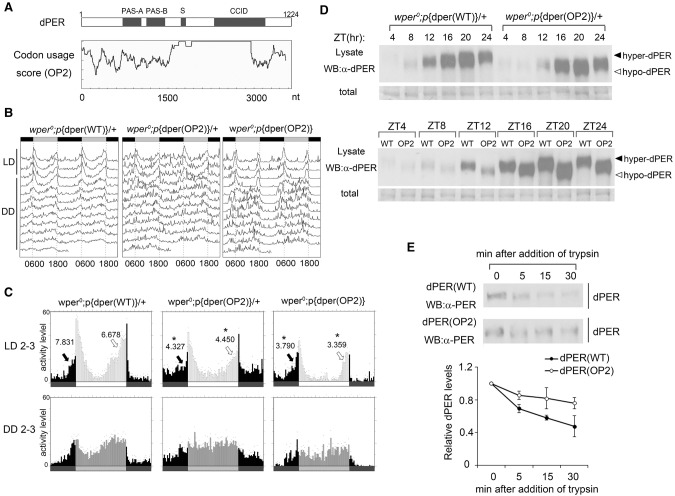
Codon usage bias is a universal feature of all genomes, but its in vivo biological functions in animal systems are not clear. To investigate the in vivo role of codon usage in animals, we took advantage of the sensitivity and robustness of the Drosophila circadian system. By codon-optimizing parts of Drosophila period (dper), a core clock gene that encodes a critical component of the circadian oscillator, we showed that dper codon usage is important for circadian clock function. Codon optimization of dper resulted in conformational changes of the dPER protein, altered dPER phosphorylation profile and stability, and impaired dPER function in the circadian negative feedback loop, which manifests into changes in molecular rhythmicity and abnormal circadian behavioral output. This study provides an in vivo example that demonstrates the role of codon usage in determining protein structure and function in an animal system. These results suggest a universal mechanism in eukaryotes that uses a codon usage "code" within genetic codons to regulate cotranslational protein folding.

Keywords: Drosophila; circadian clock; codon usage; period; protein structure.


Figures

Figure 1.
Figure 1.
Codon optimization of the N-terminal part of dper led to impaired circadian locomotor activity rhythms. (A, from top to bottom) A diagram depicting the previously identified domains of dPER. PAS-A and PAS-B (PAS domains); (dPDBD) DBT-binding domain; (CBD) dCLK-binding domain. Disorder tendency plot of the dPER protein using IUPred. Codon usage score plot (CAI value, window 35) of wild-type dper. Codon usage score plot (CAI value, window 35) of dper(OP1). The dashed line in the codon usage for the wild-type gene indicates the average CAI of wild-type dper. (B) Double plot actograms showing locomotor activity rhythms of the wper0; p{dper(WT)} and wper0;p{dper(OP1)} fly strains in 4 d of light/dark cycles (LD) and 7 d of constant darkness (DD). (C) Eduction graphs generated from locomotor activity analysis showing the rhythms of the indicated strains. The Y-axis represents activity levels. (Top) The activity data generated by averaging the second and third days in light/dark cycles (LD 2–3). (Bottom) The activity data generated by averaging the second and third days in DD (DD 2–3). Arrows indicate morning anticipation (black) and evening anticipation (white) behaviors with their respective anticipation index (AI) values. The statistical analysis was performed using a two-tailed t- test to compare the AIs between the OP1 mutants and the wild-type per gene rescue strain. (*) P-value < 0.05; (**) P-value < 0.01.
Figure 2.
Figure 2.
Impaired dPER rhythms in OP1 flies. (A) Western blot results showing the dPER molecular rhythm in LD (top) and DD (bottom) for wild-type and OP1 flies. The filled and open arrowheads indicate the hyperphosphorylated and hypophosphorylated dPER proteins, respectively. Membrane staining was used as a loading control. (B) Densitometric analyses of the results from three independent experiments. The levels of dPER were normalized to the loading control. Error bars indicate ±SD. (C) Immunohistochemistry assay of dPER expression in pigment dispersing factor (PDF)-positive (PDF+) circadian neurons in fly brains. Adult flies were entrained to LD cycle, and brains were dissected for immunohistochemistry analysis at the indicated time points.
Figure 3.
Figure 3.
Impaired circadian negative feedback loop in OP1 flies. (A) Quantitative RT–PCR assays showing the mRNA levels of dper, dtim, dcwo, and dgol. Error bars indicate SD. (B) Immunoprecipitation assay showing the reduced interaction between dPER and CLK in the wper0;p{dper(OP1)} flies. Head extracts were prepared from wper0; p{dper(WT)} and wper0;p{dper(OP1)} flies collected at the indicated times (ZT). (Top) Representative Western blot results are shown. (Bottom) Densitometric analyses from four independent biological experiments. The amount of dCLK was normalized to the HA (dPER) signal in the immunoprecipitation. (C) Western blot analysis showing the protein levels of TIM in the indicated fly strains in LD. Membrane staining was used as a loading control. (Bottom) Densitometric analyses of the Western blot results. Error bars indicate ±SD.
Figure 4.
Figure 4.
Overexpression of wild-type dPER does not result in phenotypes that resemble OP1 flies. (A, left panels) Western blot analysis shows that the levels of dPER were elevated to levels comparable with those of OP1 strains in the w;p{dper(WT)} (OX) fly strains due to the extra copy number of wild-type dPER. Note that endogenous per is located on the X chromosome. Membrane staining was used as a loading control. (Right panels) Densitometric analyses of the Western blot results. Error bars indicate ±SD. (B) Double plot actogram showing circadian locomotor activity rhythms of the indicated strains in 4 d of LD and 7 d of DD. (C) Quantitative RT–PCR assays showing the mRNA levels of dtim, dcwo, and dgol in the indicated strains. Error bars indicate ±SD. (*) P < 0.05.
Figure 5.
Figure 5.
Codon optimization of dper results in altered dPER sensitivity to trypsin digestion and heat treatment. (A, left panels) Western blots showing the levels of dPER from the indicated strains after partial trypsin (0.5 µg/mL) digestion at the indicated time points. (Right panels) Densitometric analyses of the Western blot results from three independent experiments. The levels of dPER at time point 0 were set as 1. (B) Thermal shift assays comparing the sensitivity of dPER from the indicated strains to heat treatment. (Top panels) Western blots showing the levels of dPER in the supernatant (top blot) or precipitate (bottom blot) from wild-type and OP1 strains. (Bottom panels) Densitometric analyses of the results from three independent experiments. The levels of dPER at 4°C were set as 1. Error bars indicate ±SD. (*) P < 0.05.
Figure 6.
Figure 6.
Impaired dPER phosphorylation profiles and degradation in OP1 flies. (A) Western blots showing a side-by-side comparison of dPER phosphorylation profiles at different time points in LD and DD between the wper0;p{dper(WT)} and wper0;p{dper(OP1)} flies. Membrane staining was used as a loading control. (B,C) Drosophila Schneider (S2) cells were cotransfected with dbt and dper (pAC-dper-V5) variants and collected at the indicated times (hours) after dbt induction. For the experiments in B, the culture medium contained MG132 to inhibit dPER degradation. (C, bottom) Densitometric analyses of the Western blot results for experiments without MG132 from three independent experiments. HSP70 signal was used as a loading control. (D) Western blot analysis using anti-pS47 antibody showing the reduction of S47 phosphorylation of dPER in the wper0;p{dper(OP1)} flies. Head extracts were prepared at the indicated times (ZT). dPER-HA-containing immune complexes were recovered using anti-HA beads, and dPER(S47) were detected by Western blots using an anti-pS47 antibody. (Bottom) Densitometric analyses of the results from three independent experiments. Error bars indicate ±SD. (E) GST pull-down assay showing the reduced interaction between dPER and DBT in the wper0;p{dper(OP1)} flies. Head extracts were prepared from wper0;p{dper(WT)} and wper0;p{dper(OP1)} flies collected at the indicated times (ZT). (Top) Representative Western blot results are shown. (Bottom) Densitometric analyses from four independent biological experiments. (*) P < 0.05.
Figure 7.
Figure 7.
Codon optimization of the central part of dper resulted in impaired circadian rhythms and altered dPER structure. (A) Diagrams showing the dPER protein domains and the codon usage score plot of dper (CAI value, window 35) after codon optimization. (B) Double plot actogram showing the circadian rhythms of wper0;p{dper(WT)} and wper0;p{dper(OP2)} strains after 4 d of LD and 7 d of DD. (C) Eduction graphs generated from locomotor activity analysis showing the circadian rhythms of the indicated strains in LD 2–3 (top) and in DD 2–3 (bottom). Arrows indicate morning anticipation (black) and evening anticipation (white) behaviors with their respective AI values. (*) P < 0.05. (D, top panels) Western blot results using dPER antibody showing the dPER rhythm in LD. (Bottom panels) Side-by-side Western blot analysis results showing the dPER mobility differences between two fly strains. Membrane staining was used as a loading control. (E, top panels) Western blots comparing the sensitivity of dPER from the indicated strains with partial trypsin (0.5 µg/mL) digestion. (Bottom panels) Densitometric analyses of the Western blot results from three independent experiments. The levels of dPER at time point 0 were set as 1. Error bars indicate ±SD.

Similar articles

Cited by

References

    1. Abruzzi KC, Rodriguez J, Menet JS, Desrochers J, Zadina A, Luo W, Tkachev S, Rosbash M. 2011. Drosophila CLOCK target gene characterization: implications for circadian tissue-specific gene expression. Genes Dev 25: 2374–2386. - PMC - PubMed
    1. Akashi H. 1994. Synonymous codon usage in Drosophila melanogaster: natural selection and translational accuracy. Genetics 136: 927–935. - PMC - PubMed
    1. Allada R, Chung BY. 2010. Circadian organization of behavior and physiology in Drosophila. Annu Rev Physiol 72: 605–624. - PMC - PubMed
    1. Bae K, Edery I. 2006. Regulating a circadian clock's period, phase and amplitude by phosphorylation: insights from Drosophila. J Biochem 140: 609–617. - PubMed
    1. Bae K, Lee C, Hardin PE, Edery I. 2000. dCLOCK is present in limiting amounts and likely mediates daily interactions between the dCLOCK–CYC transcription factor and the PER–TIM complex. J Neurosci 20: 1746–1753. - PMC - PubMed

Publication types