. 2016 Oct 14;82(21):6344-6356.
doi: 10.1128/AEM.01336-16. Print 2016 Nov 1.

Role of Phosphate Transport System Component PstB1 in Phosphate Internalization by Nostoc punctiforme

Affiliations

Role of Phosphate Transport System Component PstB1 in Phosphate Internalization by Nostoc punctiforme

L Hudek et al. Appl Environ Microbiol. .

Abstract

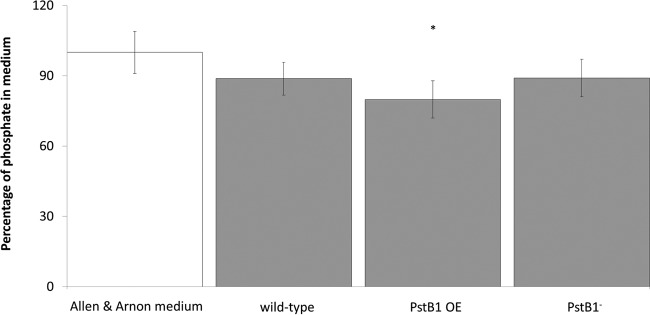
In bacteria, limited phosphate availability promotes the synthesis of active uptake systems, such as the Pst phosphate transport system. To understand the mechanisms that facilitate phosphate accumulation in the cyanobacterium Nostoc punctiforme, phosphate transport systems were identified, revealing a redundancy of Pst phosphate uptake systems that exists across three distinct operons. Four separate PstB system components were identified. pstB1 was determined to be a suitable target for creating phenotypic mutations that could result in the accumulation of excessive levels of phosphate through its overexpression or in a reduction of the capacity to accumulate phosphate through its deletion. Using quantitative real-time PCR (qPCR), it was determined that pstB1 mRNA levels increased significantly over 64 h in cells cultured in 0 mM added phosphate and decreased significantly in cells exposed to high (12.8 mM) phosphate concentrations compared to the level in cells cultured under normal (0.8 mM) conditions. Possible compensation for the loss of PstB1 was observed when pstB2, pstB3, and pstB4 mRNA levels increased, particularly in cells starved of phosphate. The overexpression of pstB1 increased phosphate uptake by N. punctiforme and was shown to functionally complement the loss of PstB in E. coli PstB knockout (PstB-) mutants. The knockout of pstB1 in N. punctiforme did not have a significant effect on cellular phosphate accumulation or growth for the most part, which is attributed to the compensation for the loss of PstB1 by alterations in the pstB2, pstB3, and pstB4 mRNA levels. This study provides novel in vivo evidence that PstB1 plays a functional role in phosphate uptake in N. punctiforme IMPORTANCE: Cyanobacteria have been evolving over 3.5 billion years and have become highly adept at growing under limiting nutrient levels. Phosphate is crucial for the survival and prosperity of all organisms. In bacteria, limited phosphate availability promotes the synthesis of active uptake systems. The Pst phosphate transport system is one such system, responsible for the internalization of phosphate when cells are in phosphate-limited environments. Our investigations reveal the presence of multiple Pst phosphate uptake systems that exist across three distinct operons in Nostoc punctiforme and functionally characterize the role of the gene product PstB1 as being crucial for the maintenance of phosphate accumulation. We demonstrate that the genes pstB2, pstB3, and pstB4 show alterations in expression to compensate for the deletion of pstB1 The overall outcomes of this work provide insights as to the complex transport mechanisms that exist in cyanobacteria like N. punctiforme, allowing them to thrive in low-phosphate environments.


Figures

FIG 1
FIG 1
Overview of the Pst phosphate transport system (45–47). The Pst system is comprised of PstS, PstC, PstA, and PstB. PstS is the periplasmic Pi-binding protein, PstA and PstC form the membrane channel, PstB is membrane bound and is the ATP hydrolysis site, PhoU is a regulatory protein that interacts with PstB and PhoB to regulate the import of Pi through the Pst system, and PhoR is the Pi-sensing/-regulatory site (45–47).
FIG 2
FIG 2
Overview of the pst transport systems and their potential regulatory genes in E. coli (A) and N. punctiforme (B to E). (A) Phosphate import ATP-binding protein gene pstB (GenBank accession no. BAJ45469), upstream phosphate ABC transporter periplasmic substrate-binding protein gene pstS (accession no. BAJ45472), upstream phosphate ABC-type transport system permease component gene pstC (accession no. BAJ45471), upstream phosphate transporter permease subunit gene pstA (accession no. BAJ45470), downstream transcriptional regulator gene phoU (accession no. BAJ45468), and downstream transcriptional antiterminator gene bglG (accession no. BAJ45467). (B) Putative phosphate ABC transporter gene pstB1 (accession no. WP_012407653.1, Pfam no. PF0005), upstream putative phosphate ABC transporter inner membrane subunit gene pstA (accession no. WP_012407652.1, Pfam no. PF00528), upstream putative phosphate ABC transporter inner membrane subunit gene pstC (accession no. WP_012407651.1, Pfam no. PF00528), upstream putative phosphate ABC transporter periplasmic phosphate binding protein gene pstS (accession no. WP_012407650.1, Pfam no. PF12849), upstream putative biotin uptake component gene bioY (accession no. WP_012407649.1, Pfam no. PF02632), upstream putative lipoprotein signal peptidase ispA (accession no. WP_012407648.1, Pfam no. PF01252), downstream putative glycine tRNA ligase gene (black arrow), downstream putative hypothetical protein gene (accession no. WP_012407657.1) (gray arrow), and downstream GAF sensor hybrid histidine kinase gene (accession no. WP_012407655.1, Pfam no. PF01590). (C) Overview of pstB2 (accession no. WP_012410452.1, Pfam no. PF00005) and its surrounding genes, including downstream putative phosphate transport ATP binding protein gene pstB3 (accession no. WP_012410553.1, Pfam no. PF00005), downstream putative phosphate transport system permease protein gene pstA (accession no. WP_012410554.1, Pfam no. PF00528), downstream putative phosphate transport system permease protein gene pstC (accession no. WP_012410555.1, Pfam no. PF00528), upstream hypothetical protein gene (accession no. WP_012410451.1) (black arrow), upstream putative short-chain dehydrogenase (adh_short, accession no. WP_012410450.1, Pfam no. PF00106), and upstream putative 4-hydroxyphenylpyruate dioxygenase gene cppA (accession no. WP_012410449.1, Pfam no. PF00903). (D) Overview of pstB4 (accession no. WP_012411066.1, Pfam no. PF00005) and its surrounding genes, including downstream putative phosphate transport system permease protein gene pstA (accession no. WP_012411067.1, Pfam no. PF00528), downstream phosphate transport system permease protein gene pstC (accession no. WP_012411068.1, Pfam no. PF00005), downstream putative periplasmic phosphate binding protein gene pstS (accession no. WP_012411069.1, Pfam no. PF12849), downstream putative periplasmic sulfate binding protein gene cysP (accession no. WP_012411070.1, Pfam no. PF13531), upstream hypothetical protein gene (accession no. WP_012411065.1) (left-facing black arrow), upstream putative single-stranded-DNA-specific exonuclease gene recJ (accession no. WP_012411064.1, Pfam no. PF01368), and upstream hypothetical protein gene (accession no. WP_012411063.1) (right-facing black arrow). (E) Overview of potential pst regulatory elements phoU (accession no. WP_012410558.1, Pfam no. PF01895), phoB (accession no. WP_012410557.1, Pfam no. PF00512), and phoR (accession no. WP_012410556.1, Pfam no. PF00072) and surrounding genes, including upstream hypothetical protein gene (accession no. WP_012410555.1) (left-facing black arrow), downstream hypothetical protein gene (accession no. WP_012410559.1) (right-facing black arrow), and downstream putative GtrA family protein gene gtrA (accession no. WP_012410560.1, Pfam no. PF04138).
FIG 3
FIG 3
Changes in N. punctiforme chlorophyll a levels for WT, pstB1-overexpressing (PstB OE), and pstB1 knockout (PstB) strains cultured in different levels of added Pi. An asterisk (*) denotes a significant difference (P < 0.05) between strains for each treatment. A significant difference (P < 0.05) in the chlorophyll a level across treatments (Pi levels) compared to the level in cells cultured under normal (0.8 mM) conditions is denoted by a plus sign (+) for WT cells, a hash symbol (#) for pstB1-overexpressing (PstB OE) cells, and a triangle (△) for pstB1 knockout (PstB) cells. Bars and error bars show the average values and standard deviations.
FIG 4
FIG 4
Alterations in mRNA levels for N. punctiforme pstB1 in cells exposed to 0 (A), 0.8 (B), and 12.8 (C) mM Pi. An asterisk (*) denotes a significant difference (P < 0.5) between the basal (control; cells maintained at the normal Pi concentration of 0.8 mM) level and the level in cells depleted of Pi for 72 h, pelleted, and then resuspended in Allen and Arnon medium with normal (0.8 mM) added Pi for 64 h. Bars and error bars show the average values and standard deviations.
FIG 5
FIG 5
Alterations in mRNA levels for N. punctiforme pstB2 (A), pstB3 (B), and pstB4 (C) in N. punctiforme WT, pstB1-overexpressing (PstB1 OE), and pstB1 knockout (PstB1) cells exposed to 0 mM Pi. An asterisk (*) denotes a statistically significant difference (P < 0.05) between the relative mRNA levels of the pstB1-overexpressing and pstB1 knockout strains in comparison to the WT. A significant difference (P < 0.05) between relative mRNA levels for the three strains is denoted by a hash symbol (#). Symbols and error bars show the average values and standard deviations.
FIG 6
FIG 6
Alterations in mRNA levels for N. punctiforme pstB2 (A), pstB3 (B), and pstB4 (C) in N. punctiforme WT, pstB1-overexpressing (PstB1 OE), and pstB1 knockout (PstB1) cells exposed to 0.8 mM Pi. An asterisk (*) denotes a statistically significant difference (P < 0.05) between the relative mRNA levels of the pstB1-overexpressing and pstB1 knockout strains in comparison to the WT. A significant difference (P < 0.05) between relative mRNA levels for the three strains is denoted by a hash symbol (#). Symbols and error bars show the average values and standard deviations.
FIG 7
FIG 7
Alterations in mRNA levels for N. punctiforme pstB2 (A), pstB3 (B), and pstB4 (C) in N. punctiforme WT, pstB1-overexpressing (PstB1 OE), and pstB1 knockout (PstB1) cells exposed to 12.8 mM Pi. An asterisk (*) denotes a statistically significant difference (P < 0.05) between the relative mRNA levels of the pstB1-overexpressing and pstB1 knockout strains in comparison to the WT. A significant difference (P < 0.05) between relative mRNA levels for the three strains is denoted by a hash symbol (#). Symbols and error bars show the average values and standard deviations.
FIG 8
FIG 8
Colorimetric assay-based quantification of phosphate levels in Allen and Arnon medium (0.8 mM added Pi) 64 h after inoculation of medium with N. punctiforme cells that had been depleted of Pi for 72 h prior. An asterisk (*) denotes a statistically significant difference (P < 0.05) between the levels in uninoculated medium and medium inoculated with N. punctiforme pstB1-overexpressing (PstB1 OE) cells. Bars and error bars show the average values and standard deviations.
FIG 9
FIG 9
Total phosphorus levels in culture medium and accumulated by N. punctiforme cells 64 h after inoculation as quantified using ICP-MS. (A) Quantification of total phosphorus levels removed from medium by N. punctiforme WT, pstB1-overexpressing (PstB1 OE), and pstB1 knockout (PstB1) cells. (B) Quantification of phosphorus levels accumulated by N. punctiforme WT, pstB1-overexpressing (PstB1 OE), and pstB1 knockout (PstB1) cells after 64 h of growth in Allen and Arnon medium with 0.8 mM added phosphate. An asterisk (*) denotes a statistically significant difference (P < 0.05) between the levels in uninoculated medium and medium inoculated with an N. punctiforme strain. A significant difference (P < 0.05) between the levels in WT and pstB1-overexpressing cells is denoted by a hash symbol (#). Bars and error bars show the average values and standard deviations.
FIG 10
FIG 10
Levels of radiolabeled phosphate (32P) accumulated by N. punctiforme and E. coli strains. (A) Values for Nostoc punctiforme WT, pstB1-overexpressing (PstB1 OE), and pstB1 knockout (PstB1) cells. (B) Values for Escherichia coli WT, pstB knockout (PstB), PstB harboring pET15b empty vector (PstB pET15b), and PstB knockout mutants complemented with PstB1 of N. punctiforme (Npun PstB comp). A statistically significant difference (P < 0.05) between the values for PstB1-complemented, PstB pET15b empty vector control and PstB E. coli strains is denoted by double asterisks (**). A statistically significant difference (P < 0.05) between the values for PstB1-complemented E. coli PstB mutants and WT cells is denoted by a hash symbol (#). Symbols and error bars show the average values and standard deviations.

Similar articles

Cited by

References

    1. Bardin SF, Dan SF, Osteras MF, Finan TM. 1996. A phosphate transport system is required for symbiotic nitrogen fixation by Rhizobium meliloti. J Bacteriol 178:4540–4547. - PMC - PubMed
    1. Dunne EJ, Culleton N, O'Donovan G, Harrington R, Daly K. 2005. Phosphorus retention and sorption by constructed wetland soils in Southeast Ireland. Water Res 39:4355–4362. doi: 10.1016/j.watres.2005.09.007. - DOI - PubMed
    1. Ann Y, Reddy KR, Delfino JJ. 1999. Influence of chemical amendments on phosphorus immobilization in soils from a constructed wetland. Ecol Eng 14:157–167. doi: 10.1016/S0925-8574(99)00026-9. - DOI
    1. Dokulil M, Teubner K. 2000. Cyanobacterial dominance in lakes. Hydrobiologia 438:1–12. doi: 10.1023/A:1004155810302. - DOI
    1. Meeks JC, Elhai J, Thiel T, Potts M, Larimer F, Lamerdin J, Predki P, Atlas R. 2001. An overview of the genome of Nostoc punctiforme, a multicellular, symbiotic cyanobacterium. Photosynth Res 70:85–106. doi: 10.1023/A:1013840025518. - DOI - PubMed

MeSH terms

LinkOut - more resources