

Estimating the Effective Population Size from Temporal Allele Frequency Changes in Experimental Evolution
- PMID: 27542959
- PMCID: PMC5068858
- DOI: 10.1534/genetics.116.191197
Estimating the Effective Population Size from Temporal Allele Frequency Changes in Experimental Evolution
Abstract
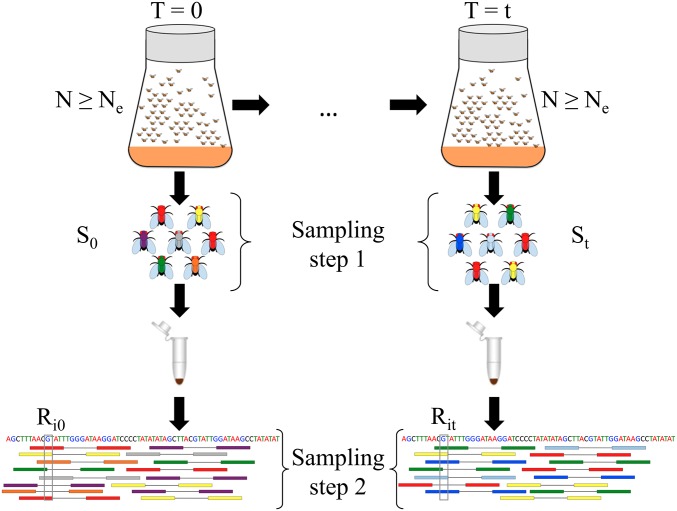
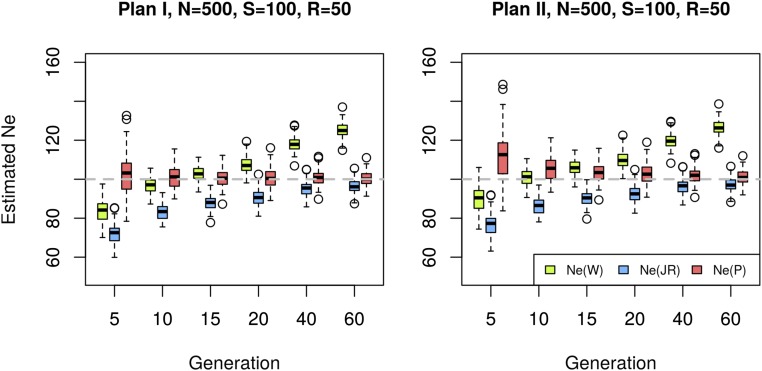
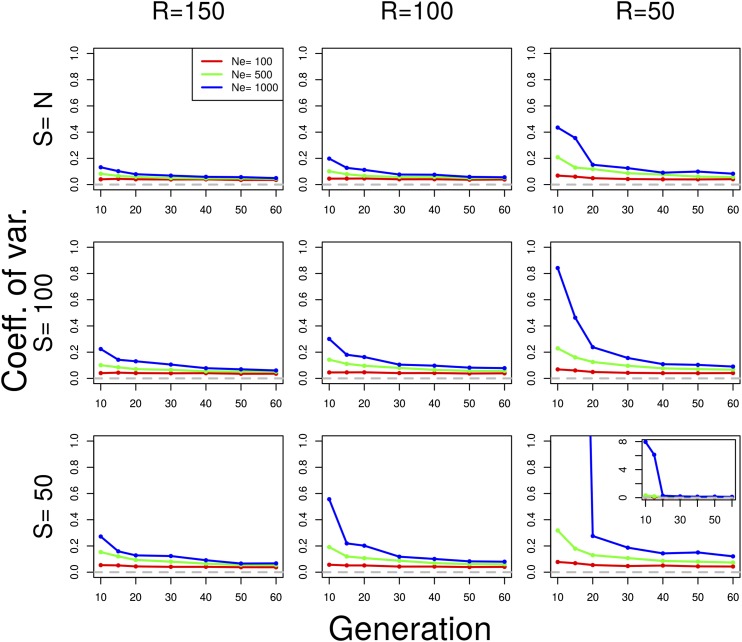
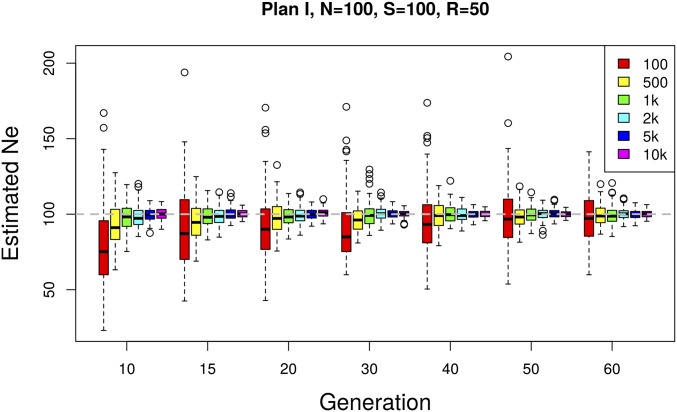
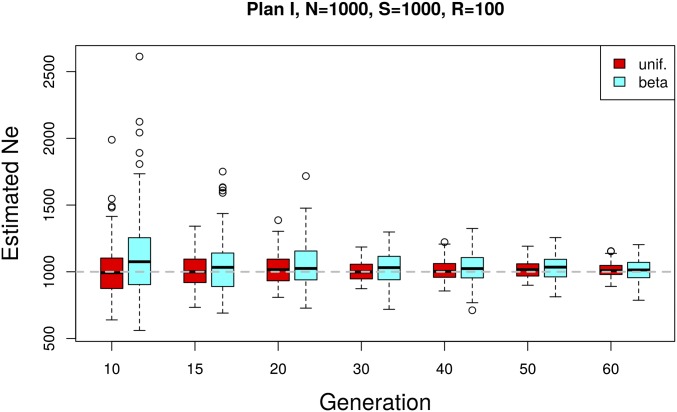
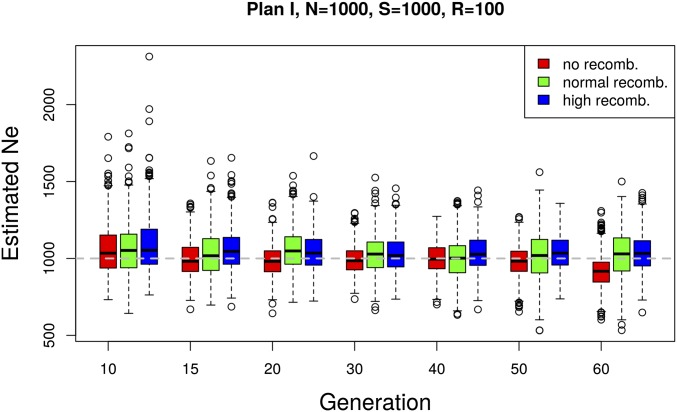
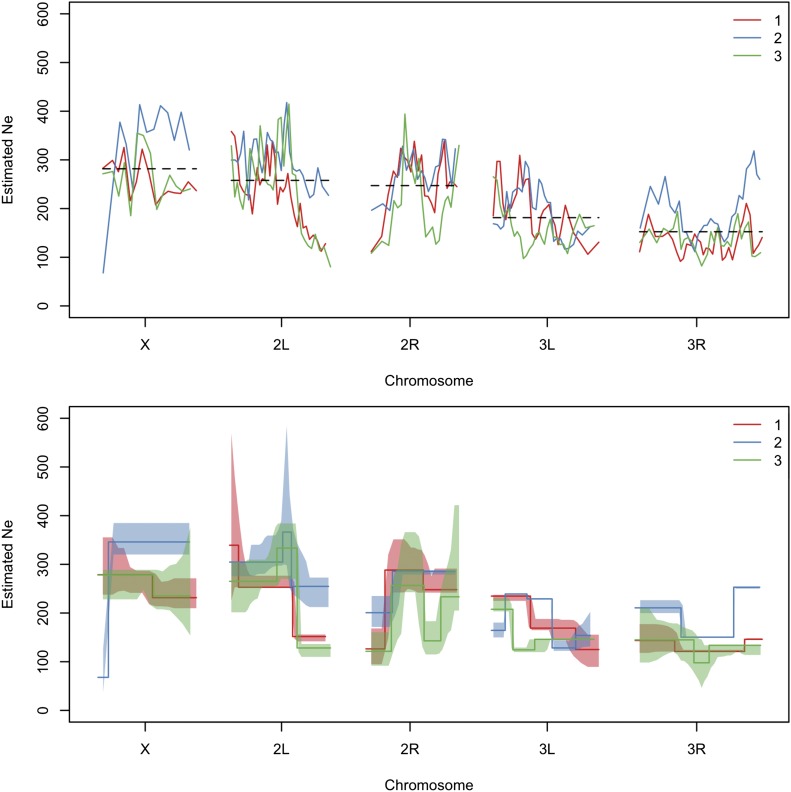
The effective population size ([Formula: see text]) is a major factor determining allele frequency changes in natural and experimental populations. Temporal methods provide a powerful and simple approach to estimate short-term [Formula: see text] They use allele frequency shifts between temporal samples to calculate the standardized variance, which is directly related to [Formula: see text] Here we focus on experimental evolution studies that often rely on repeated sequencing of samples in pools (Pool-seq). Pool-seq is cost-effective and often outperforms individual-based sequencing in estimating allele frequencies, but it is associated with atypical sampling properties: Additional to sampling individuals, sequencing DNA in pools leads to a second round of sampling, which increases the variance of allele frequency estimates. We propose a new estimator of [Formula: see text] which relies on allele frequency changes in temporal data and corrects for the variance in both sampling steps. In simulations, we obtain accurate [Formula: see text] estimates, as long as the drift variance is not too small compared to the sampling and sequencing variance. In addition to genome-wide [Formula: see text] estimates, we extend our method using a recursive partitioning approach to estimate [Formula: see text] locally along the chromosome. Since the type I error is controlled, our method permits the identification of genomic regions that differ significantly in their [Formula: see text] estimates. We present an application to Pool-seq data from experimental evolution with Drosophila and provide recommendations for whole-genome data. The estimator is computationally efficient and available as an R package at https://github.com/ThomasTaus/Nest.
Keywords: Pool-seq; effective population size; experimental evolution; genetic drift.
Copyright © 2016 Jónás et al.
Figures
Similar articles
-
Measuring Genetic Differentiation from Pool-seq Data.Genetics. 2018 Sep;210(1):315-330. doi: 10.1534/genetics.118.300900. Epub 2018 Jul 30. Genetics. 2018. PMID: 30061425 Free PMC article.
-
Estimating effective population size from temporally spaced samples with a novel, efficient maximum-likelihood algorithm.Genetics. 2015 May;200(1):285-93. doi: 10.1534/genetics.115.174904. Epub 2015 Mar 5. Genetics. 2015. PMID: 25747459 Free PMC article.
-
Assessment of the Global Variance Effective Size of Subdivided Populations, and Its Relation to Other Effective Sizes.Acta Biotheor. 2023 Jul 17;71(3):19. doi: 10.1007/s10441-023-09470-w. Acta Biotheor. 2023. PMID: 37458852 Free PMC article.
-
Population-genetic inference from pooled-sequencing data.Genome Biol Evol. 2014 Apr 30;6(5):1210-8. doi: 10.1093/gbe/evu085. Genome Biol Evol. 2014. PMID: 24787620 Free PMC article.
-
Folic acid supplementation and malaria susceptibility and severity among people taking antifolate antimalarial drugs in endemic areas.Cochrane Database Syst Rev. 2022 Feb 1;2(2022):CD014217. doi: 10.1002/14651858.CD014217. Cochrane Database Syst Rev. 2022. PMID: 36321557 Free PMC article.
Cited by
-
Do estimates of contemporary effective population size tell us what we want to know?Mol Ecol. 2019 Apr;28(8):1904-1918. doi: 10.1111/mec.15027. Epub 2019 Apr 26. Mol Ecol. 2019. PMID: 30663828 Free PMC article.
-
Repeatability of evolution and genomic predictions of temperature adaptation in seed beetles.Nat Ecol Evol. 2025 Jun;9(6):1061-1074. doi: 10.1038/s41559-025-02716-5. Epub 2025 May 16. Nat Ecol Evol. 2025. PMID: 40379980 Free PMC article.
-
SNP-based analysis reveals unexpected features of genetic diversity, parental contributions and pollen contamination in a white spruce breeding program.Sci Rep. 2021 Mar 2;11(1):4990. doi: 10.1038/s41598-021-84566-2. Sci Rep. 2021. PMID: 33654140 Free PMC article.
-
The genomic scale of fluctuating selection in a natural plant population.Evol Lett. 2022 Dec 11;6(6):506-521. doi: 10.1002/evl3.308. eCollection 2022 Dec. Evol Lett. 2022. PMID: 36579169 Free PMC article.
-
Low concordance of short-term and long-term selection responses in experimental Drosophila populations.Mol Ecol. 2020 Sep;29(18):3466-3475. doi: 10.1111/mec.15579. Epub 2020 Aug 26. Mol Ecol. 2020. PMID: 32762052 Free PMC article.
References
-
- Baalsrud H. T., Saether B.-E., Hagen I. J., Myhre A. M., Ringsby T. H., et al. , 2014. Effects of population characteristics and structure on estimates of effective population size in a house sparrow metapopulation. Mol. Ecol. 23(11): 2653–2668. - PubMed
-
- Barker J. S. F., 2011. Effective population size of natural populations of Drosophila buzzatii, with a comparative evaluation of nine methods of estimation. Mol. Ecol. 20(21): 4452–4471. - PubMed
-
- Barrick J. E., Yu D. S., Yoon S. H., Jeong H., Oh T. K., et al. , 2009. Genome evolution and adaptation in a long-term experiment with Escherichia coli. Nature 461(7268): 1243–1247. - PubMed
MeSH terms
Grants and funding
LinkOut - more resources
Full Text Sources
Other Literature Sources
Molecular Biology Databases
