. 2016 Nov;102(4):672-689.
doi: 10.1111/mmi.13485. Epub 2016 Sep 14.

UAP56 is a conserved crucial component of a divergent mRNA export pathway in Toxoplasma gondii

Affiliations

UAP56 is a conserved crucial component of a divergent mRNA export pathway in Toxoplasma gondii

Mariana Serpeloni et al. Mol Microbiol. 2016 Nov.

Abstract

Nucleo-cytoplasmic RNA export is an essential post-transcriptional step to control gene expression in eukaryotic cells and is poorly understood in apicomplexan parasites. With the exception of UAP56, a component of TREX (Transcription Export) complex, other components of mRNA export machinery are not well conserved in divergent supergroups. Here, we use Toxoplasma gondii as a model system to functionally characterize TgUAP56 and its potential interaction factors. We demonstrate that TgUAP56 is crucial for mRNA export and that functional interference leads to significant accumulation of mRNA in the nucleus. It was necessary to employ bioinformatics and phylogenetic analysis to identify orthologs related to mRNA export, which show a remarkable low level of conservation in T. gondii. We adapted a conditional Cas9/CRISPR system to carry out a genetic screen to verify if these factors were involved in mRNA export in T. gondii. Only the disruption of TgRRM_1330 caused accumulation of mRNA in the nucleus as found with TgUAP56. This protein is potentially a divergent partner of TgUAP56, and provides insight into a divergent mRNA export pathway in apicomplexans.


Figures

Figure 1
Figure 1
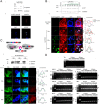
Localization and functional analysis of TgUAP56. A. Analysis of dd‐GFP‐TgUAP56 expression. i) In non‐induced parasites (‐Shld1), only the endogenous protein (TgUAP56) is detected by Western blot using polyclonal antibody against Tryp‐Sub2 (Serpeloni et al., 2011a), renamed here as α‐TgUAP56. Both TgUAP56 and dd‐GFP‐TgUAP56 are detected by this antibody after incubation with 1 µM of Shld1 for 6 h. Aldolase: Loading control. ii) In the immunofluorescence assay dd‐GFP‐TgUAP56 is nuclear and colocalizes with endogenous TgUAP56 protein, in red. Nuclear and apicoplast DNA staining with DAPI: in blue. Scale bar: 5 µm. B. Analysis of mRNA distribution after dd‐GFP‐TgUAP56 overexpression with 1 µM Shld1. i) Western blot to analyze induction of dd‐GFP‐TgUAP56. The protein was detected with anti‐GFP. Aldolase was used as loading control. dd‐GFP‐TgUAP56 was detectable after 6 h of incubation with 1 µM of Shld1. The numbers above the Western blot indicate the relative expression levels of dd‐GFP‐TgUAP56 at each indicated time point, normalized to the loading control aldolase using ImageJ software with the densitometry plugin (Version 1.6, National Institutes of Health, Bethesda, MD). ii) To check mRNA distribution, poly(A)+ mRNAs were detected by fluorescent in situ hybridization (FISH) using oligodT‐Alexa594 as probe: in Red. Nuclear and apicoplast DNA staining with DAPI: in blue. dd‐GFP‐TgUAP56: in green. In the right: quantification of signals of immunofluorescence and DAPI in selected parasites, in yellow box. Scale bar: 10 µm. C. Analysis of mRNA distribution after knockout of uap56 by gene‐swap strategy based on Di‐Cre system in T. gondii. i) Endogenous uap56 gene is replaced with mcherry by Dicre after incubation with 50 nM of rapamycin. ii) uap56 knockout was analyzed in cKOuap56 strain western blot after incubation with 50 nM of rapamycin at different times. ‐, not induced; +, induced. Aldolase: Loading control. iii) mRNA distribution was analyzed in cKOuap56 strain after incubation with rapamycin at different times by fluorescent in situ hybridization (FISH) using oligodT‐Alexa488 as probe, in green. Nuclear and apicoplast DNA was staining with DAPI: in blue. In the right: quantification of signals of immunofluorescence and DAPI in selected parasites. Scale bar: 10 µm D. PCR analysis of mRNA splicing for selected genes. Total RNA was purified from DiCre strain and cKOuap56 strain both incubated with 50 nM of rapamycin, as indicated. −, not induced; +, induced. The total RNA was reverse transcribed and PCR amplified using primers that span an intron. PCR of gDNA was included as a reference to distinguish between properly spliced (S) and pre‐spliced (PS) forms of each gene. In the top: Tubulin, used as loading control (Dalmasso et al., 2009). In the bottom: PCR analysis of mRNA splicing for selected genes: RNA polymerase II p8.2 subunit (TGME49_217560), RNA polymerase II p19 subunit (TGME49_271300), RNA polymerase II p23 subunit (TGME49_240590), imc1 (TGME49_231640), imc15 (TGME49_275670), imc5 (TGME49_224530), and transcription factor iid (TGME49_258680). gDNA: genomic DNA from non‐induced parasites of cKOuap56 strain. Expected sizes for pre‐mRNA (Pre‐spliced) and mRNA (spliced) are shown for each selected gene.
Figure 2
Figure 2
Establishment of a conditional Cas9 (ddCas9). A. Western blot showing ddCas9‐FLAG overexpression. Parasites were induced for indicated times with 1µM of Shld1 prior protein extraction. RH‐Δhxgprt strain was used as control (first and second lanes ‐ wild type‐wt) Aldolase: Loading control. B. i) Nuclear localization of Cas9 in RHddCas9 parasites after addition of 1 µM Shld1 for 24 h. Nuclear and apicoplast DNA staining with DAPI: in blue. Scale bar: 10µm. ii) Co‐localization map, showing in grey the areas where there was co‐localization with an M2 of 0.8. Graph represents the areas where there was a signal for green (green line) and areas where there was signal for blue (blue line). y‐Axis: intensity level; x‐axis: distance in microns. C. Plaque assays for parental RHddCas9 and RHddCas9‐gap40 gRNA strains. Both parasite strains were grown on human foreskin fibroblasts, in the presence or absence of 1 µM of Shld1, as indicated, for 108 h. −, not induced; +, induced. Scale bar: 500 µm. D. Immunofluorescence assay of parental RHddCas9 and RHddCas9‐gap40 sgRNA strains in the presence or absence of Shld1. Collapsing vacuoles with a significant reduction of GAP40 signal were only observed in induced parasites that expressed the specific sgRNA against gap40. Scale bar: 8 µm. E. mRNA distribution was analyzed in RHddCas9, RHddCas9‐gap40 gRNA and RHddCas9‐uap56 gRNA strains after incubation for 4 h with 1 µM Shld1 and further incubation for 48 h in media. The analysis was performed by fluorescent in situ hybridization (FISH) using oligodT‐Alexa594 as probe, in red. Nuclear and apicoplast DNA was staining with DAPI: in blue. Scale bar: 5 µm. F. mRNA distribution and TgUAP56 protein presence analysis in RHddCas9‐uap56 gRNA strain after incubation for 4 h with 1 µM Shld1 and further incubation for 48 h in media. i) The analysis was performed by immunofluorescence assay, α‐TgUAP56 in green, combined with fluorescent in situ hybridization (FISH) using oligodT‐Alexa594 as probe, in red. mRNA export blocking was observed in absence of TgUAP56 in induced parasites that expressed the specific sgRNA against uap56. Nuclear and apicoplast DNA was staining with DAPI: in blue. Scale bar: 5µm. ii) Western blot to analyse TgUAP56 protein levels after 1 µM Shld1 incubation for 24 and 48 h. The protein was detected with anti‐TgUAP56. Aldolase was used as loading control. ddCas9‐FLAG was detected using antibody α‐Flag. −, not induced; +, induced.
Figure 3
Figure 3
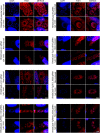
ddCas9 genetic screen for potential candidates related to mRNA export in T. gondii. mRNA distribution was analyzed in RHddCas9, RHddCas9‐candidate strains after incubation for 4 h with 1 µM Shld1 and then 48 h with fresh media. The analyses were performed by fluorescent in situ hybridization (FISH) using oligodT‐Alexa594 as probe, in red. Nuclear and apicoplast DNA was stained with DAPI: in blue. Scale bar: 5 µm.
Figure 4
Figure 4
Subcellular localization and phenotypic analysis after overexpression of T. gondii candidate proteins in T. gondii. A. Plaque assays for overexpression strains. Both parasite strains were grown on human foreskin fibroblasts, in the presence or absence of 1 µM of Shield, as indicated, for 108 h. −, not induced; +, induced. Scale bar: 500 µm. B–F. mRNA distribution in different times of candidates overexpression by incubation with 1 µM of Shld1. poly(A)+ mRNAs were detected by fluorescent in situ hybridization (FISH) using oligodT‐Alexa594 as probe: in Red. Nuclear and apicoplast DNA staining with DAPI: in blue. dd‐GFP‐candidates: in green. Scale bar: 5 µm.
Figure 5
Figure 5
Localization and functional analysis of TgRRM_1330. A. Analysis of mRNA distribution during dd‐GFP‐ TgRRM_1330 overexpression after incubation with 1 µM Shld1 at different times. To check mRNA distribution, poly(A)+ mRNAs were detected by fluorescent in situ hybridization (FISH) using oligodT‐Alexa555 as probe: in Red. Nuclear and apicoplast DNA staining with DAPI: in blue. dd‐GFP‐ TgRRM_1330: in green. Scale bar: 5 µm. B. dd‐GFP‐TgRRM_1330 protein was detected with anti‐GFP and the overexpression levels were quantified by comparison with aldolase levels. dd‐GFP‐TgRRM_1330 was stabilized after 6 h of incubation with 1 µM of Shld1. The numbers above the Western blot means the percentage of overexpression at each indicated time point, related to result after 6 h, proportional to loading control. C. dd‐GFPTgRRM_1330 strain growth assay. Parasites were grown on human foreskin fibroblasts in the presence of different concentration of Shld1. After 108 h of incubation, the cells were fixed and stained with Giemsa. D. Colocalization analysis between TgUAP56 and dd‐GFP‐ TgRRM_1330. i) Super‐resolution microscopy of four tachyzoites nuclei. There is a clear co‐stain with anti‐TgUAP56 (in red) and the GFP signal of dd‐GFP‐TgRRM_1330 (in green) within the nucleus, stained in blue with DAPI. The fluorescence signals were analyzed and plotted, showing a co‐localization of the fluorescences in the same areas within the nuclei highlighted in the white box. ii) Immunoelectron micrograph of a tachyzoite nucleus. Arrows indicate labeling of anti‐TgUAP56 protein, and arrowheads indicate anti‐GFP protein. iii) dd‐GFP‐TgRRM_1330 immunoprecipitation. dd‐GFP‐TgRRM_1330 was stabilized for 2 h with 0,5 µM of Shld1. The membrane was incubated with anti‐TgUAP56. I: Input. W1: First wash. W4: Fourth and last wash. E: Eluted.

Similar articles

Cited by

References

    1. Andenmatten, N. , Egarter, S. , Jackson, A.J. , Jullien, N. , Herman, J.P. , and Meissner, M. (2013) Conditional genome engineering in Toxoplasma gondii uncovers alternative invasion mechanisms. Nat Methods 10: 125–127. - PMC - PubMed
    1. Banaszynski, L.A. , Chen, L.C. , Maynard‐Smith, L.A. , Ooi, A.G. , and Wandless, T.J. (2006) A rapid, reversible, and tunable method to regulate protein function in living cells using synthetic small molecules. Cell 126: 995–1004. - PMC - PubMed
    1. Bargieri, D.Y. , Andenmatten, N. , Lagal, V. , Thiberge, S. , Whitelaw, J.A. , Tardieux, I. , et al (2013) Apical membrane antigen 1 mediates apicomplexan parasite attachment but is dispensable for host cell invasion. Nat Commun 4: 2552. - PMC - PubMed
    1. Breinich, M.S. , Ferguson, D.J. , Foth, B.J. , van Dooren, G.G. , Lebrun, M. , Quon, D.V. , et al (2009) A dynamin is required for the biogenesis of secretory organelles in Toxoplasma gondii . Curr Biol 19: 277–286. doi:10.1038/ncomms 3552 - PMC - PubMed
    1. Buhlmann, M. , Walrad, P. , Rico, E. , Ivens, A. , Capewell, P. , Naguleswaran, A. , et al (2015) NMD3 regulates both mRNA and rRNA nuclear export in African trypanosomes via an XPOI‐linked pathway. Nucleic Acids Res 43: 4491–4504. - PMC - PubMed

Publication types

MeSH terms