. 2016 Dec 1;44(21):10201-10215.
doi: 10.1093/nar/gkw719. Epub 2016 Aug 19.

Novel TDP2-ubiquitin interactions and their importance for the repair of topoisomerase II-mediated DNA damage

Affiliations

Novel TDP2-ubiquitin interactions and their importance for the repair of topoisomerase II-mediated DNA damage

Timsi Rao et al. Nucleic Acids Res. .

Abstract

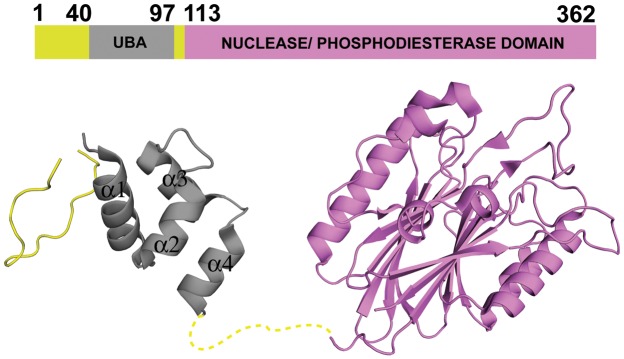
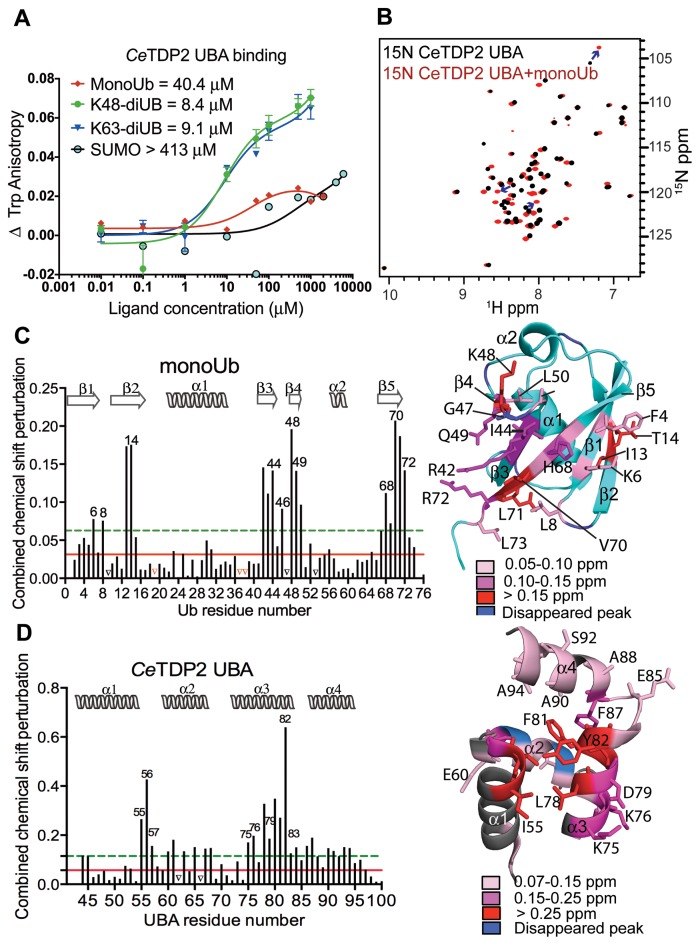
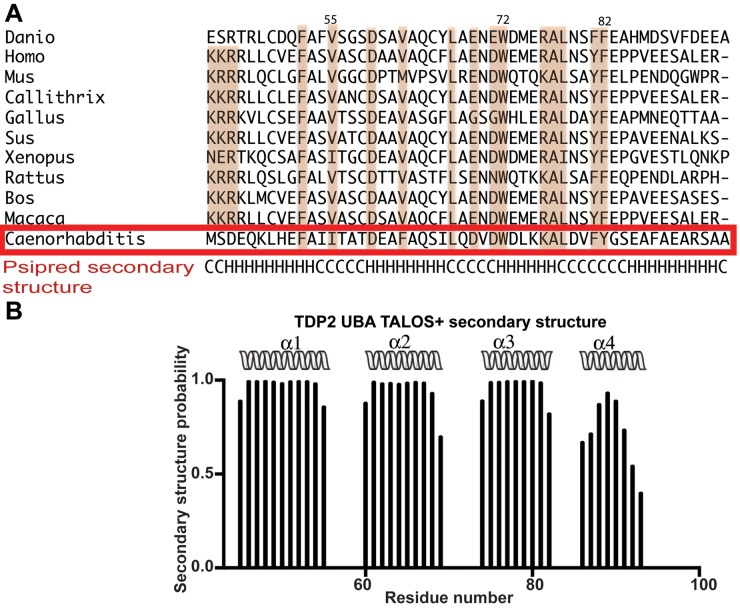
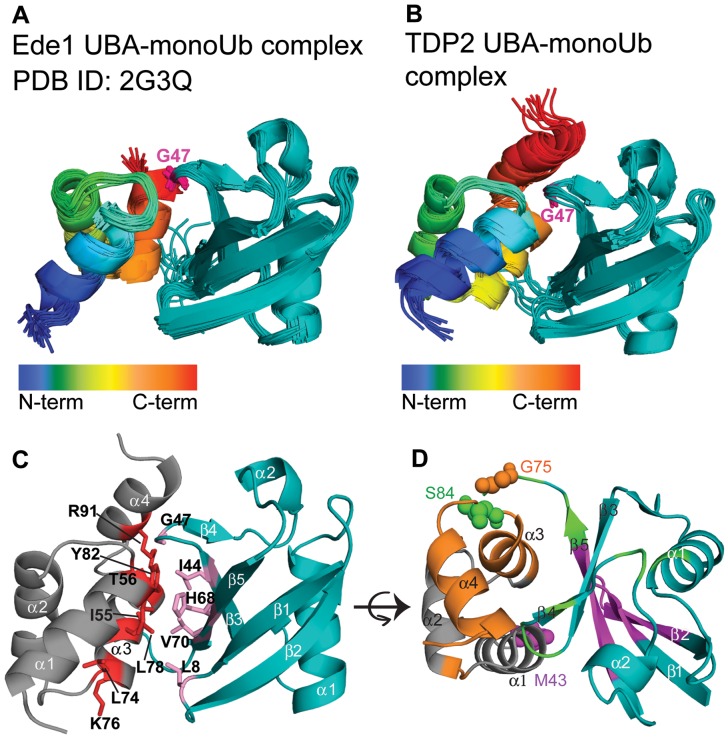
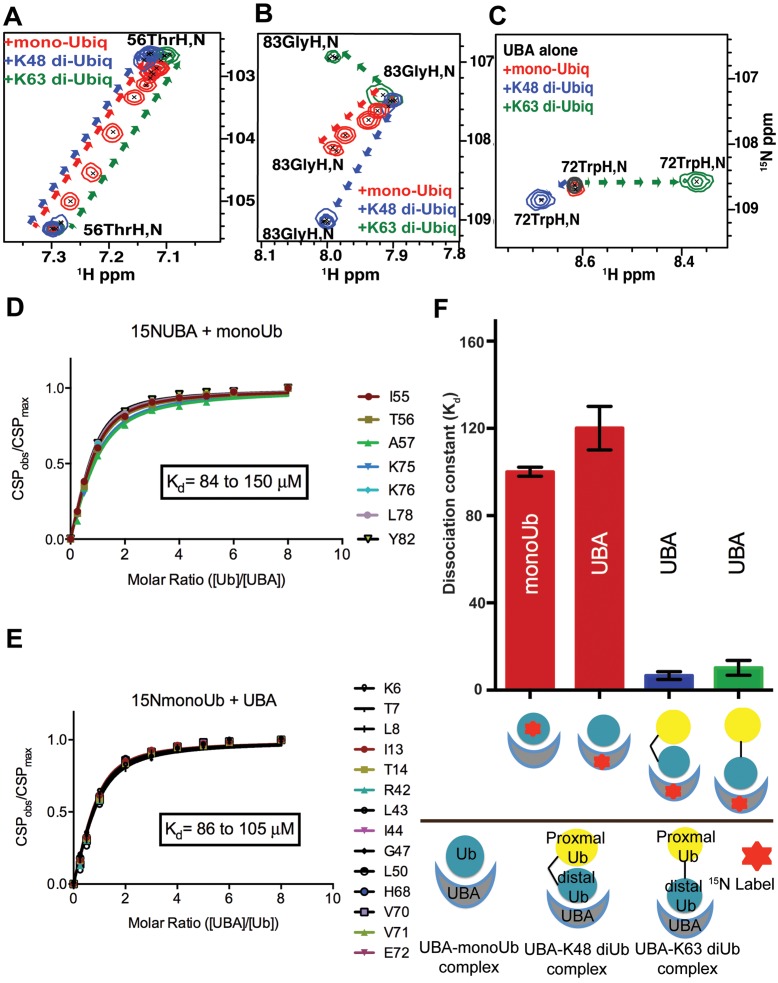
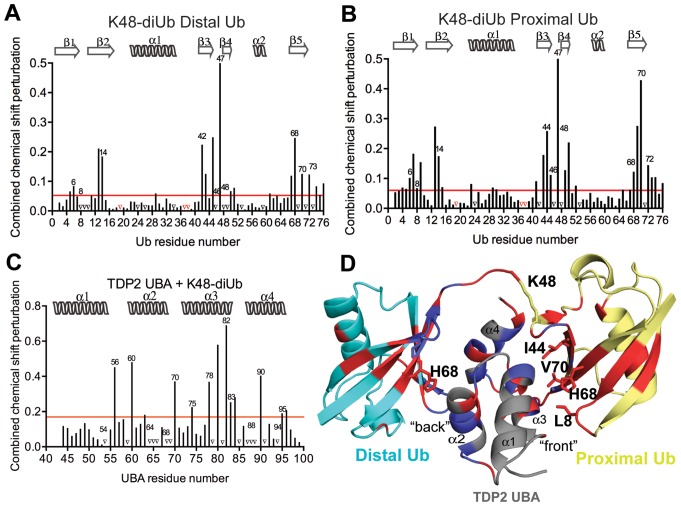
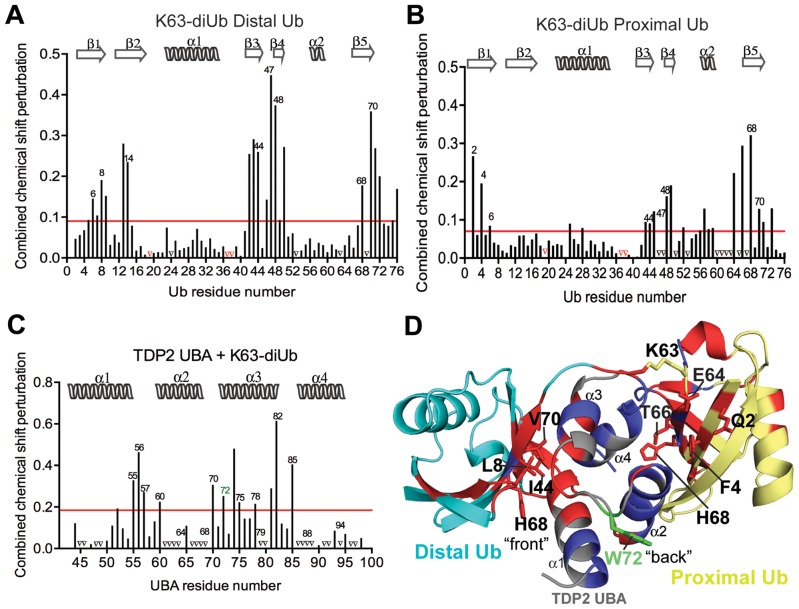
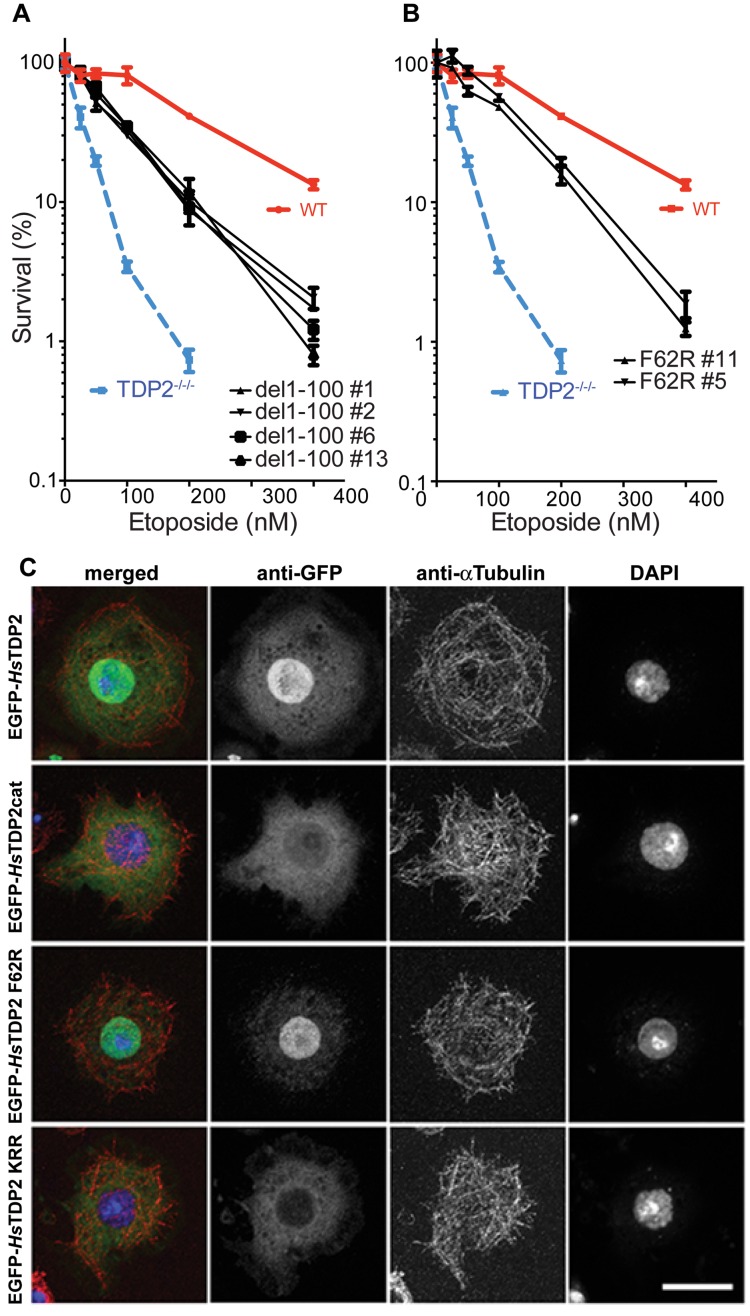
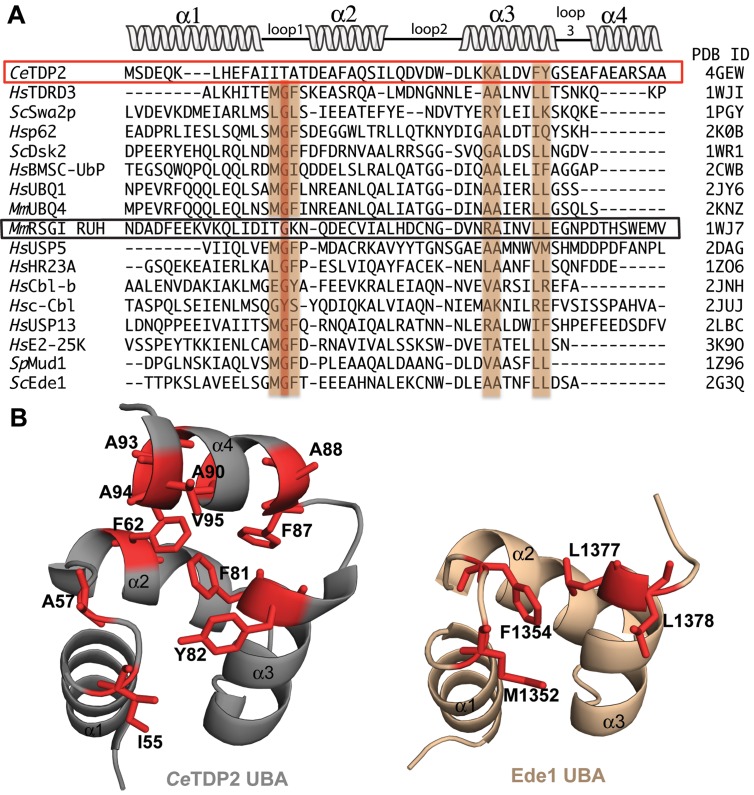
Tyrosyl DNA phosphodiesterase 2 (TDP2) is a multifunctional protein implicated in DNA repair, signal transduction and transcriptional regulation. In its DNA repair role, TDP2 safeguards genome integrity by hydrolyzing 5'-tyrosyl DNA adducts formed by abortive topoisomerase II (Top2) cleavage complexes to allow error-free repair of DNA double-strand breaks, thereby conferring cellular resistance against Top2 poisons. TDP2 consists of a C-terminal catalytic domain responsible for its phosphodiesterase activity, and a functionally uncharacterized N-terminal region. Here, we demonstrate that this N-terminal region contains a ubiquitin (Ub)-associated (UBA) domain capable of binding multiple forms of Ub with distinct modes of interactions and preference for either K48- or K63-linked polyUbs over monoUb. The structure of TDP2 UBA bound to monoUb shows a canonical mode of UBA-Ub interaction. However, the absence of the highly conserved MGF motif and the presence of a fourth α-helix make TDP2 UBA distinct from other known UBAs. Mutations in the TDP2 UBA-Ub binding interface do not affect nuclear import of TDP2, but severely compromise its ability to repair Top2-mediated DNA damage, thus establishing the importance of the TDP2 UBA-Ub interaction in DNA repair. The differential binding to multiple Ub forms could be important for responding to DNA damage signals under different contexts or to support the multi-functionality of TDP2.


Figures

Figure 1.
Figure 1.
Structure of the full-length CeTDP2. Schematic and ribbon representations of the previously published structure of C. elegans TDP2 protein, PDB ID 4GEW (11).
Figure 2.
Figure 2.
TDP2 UBA binds specifically to ubiquitin. (A) Binding isotherms of TDP2 UBA titrated with increasing concentrations of monoUb, diUb (K48 or K63-linked) and SUMO, monitored by fluorescence anisotropy of Trp72 of TDP2 UBA. (B) HSQC spectrum of 15N labeled CeTDP2 UBA (black), superimposed over that of 15N CeTDP2 UBA in the presence of 6-fold molar excess of monoUb (red). Blue arrows trace a few of the significantly shifted peaks from their free to the bound position. (C) Per residue chemical shift perturbation map of monoUb on the left and residues with significant change (>2 σ0 corr) highlighted on the structure of monoUb on the right (PDB ID: 1D3Z). The solid red and dashed green lines cross the map at 1 and 2 σ0 corr (corrected standard deviation (44,67)), respectively. Peaks that vanished due to significant broadening during the titration are marked by black triangles on the graph. Red triangles on the graph represent the three proline residues that do not show NH peaks in the 2D 1H,15N HSQC experiment and were therefore excluded from the CSP analysis. Secondary structure elements of Ub are drawn on top of the graph. (D) Per residue chemical shift perturbation map of TDP2 UBA on the left and residues with significant change (>2 σ0 corr) highlighted on the structure of TDP2 UBA on the right. Red and green lines as well as black triangles are drawn as in panel C. Secondary structure elements of TDP2 UBA are drawn on top of the graph.
Figure 3.
Figure 3.
TDP2 UBA has an extra fourth helix in solution. (A) Multiple sequence alignment (MSA) of TDP2 UBAs from 11 organisms (Danio rerio, Homo sapiens, Mus musculus, Callithrix jacchus, Gallus gallus, Sus scrofa, Xenopus laevis, Rattus norvegicus, Bos taurus, Macaca mulatta and Caenorhabditis elegans). Alignment was carried out with Clustal Omega (12,68) and this alignment was used in PSIPRED (39) to predict secondary structure, which is shown at the bottom of the alignment. H, helix; C, coil. A red box highlights the CeTDP2 UBA sequence, for which the residue numbering is shown at the top. (B) TALOS+ (40) secondary structure prediction based on backbone chemical shifts of CeTDP2 UBA. Helices are shown as spiral ribbons and labeled.
Figure 4.
Figure 4.
The TDP2 UBA-Ub complex adopts a canonical conformation. (A) The solution structure of the Ede1 UBA-Ub complex (PDB 2G3Q), published previously (15), is shown as a representative UBA-Ub complex. The UBA is colored in a rainbow spectrum from the N- to C-terminus and Ub in teal. Gly47 from the Ub loop that inserts between helix 1 and 3 of the UBA is highlighted in magenta. (B) An ensemble of 10 best scored TDP2 UBA-Ub complex models by HADDOCK (31), shown in a similar orientation and color scheme as in A. (C) HADDOCK model showing side chains in the interaction surface between TDP2 UBA (grey and red) and Ub (teal and purple). (D) HADDOCK model of the TDP2 UBA-Ub complex, as in C but rotated about the horizontal axis, showing the MTSL labeling sites on Ub (Gly75) or UBA (Met43 and Ser84) that were used for modeling and validation. Gly75 on Ub and the proximal residues to it on the UBA whose HN signals were attenuated in the PRE experiment are colored in orange. Likewise, Met43 on the UBA and the proximal residues to it on Ub are colored in magenta, and Ser84 and its proximal residues in green.
Figure 5.
Figure 5.
TDP2 UBA binds Ubs with different modes of binding. (A) Chemical shift titration profiles of TDP2 UBA Thr56 for binding with monoUb and diUbs (K48 or K63-linked) at UBA:Ub ratios of 1:0, 4:1, 2:1, 1:1, 1:2, 1:3, 1:4 and 1:6 show shifting of the peaks in the same direction for all, but in fast exchange for monoUb (red) and slow-intermediate exchange for diUbs (blue and green). (B) Chemical shift titration profiles of TDP2 UBA Gly83 for binding with monoUb and diUbs (K48 or K63-linked) show shifts in different directions. (C) Chemical shift titration profiles of CeTDP2 UBA Trp72 for binding with monoUb and diUbs (K48- or K63-linked) show no shift for monoUb binding, but shifts in different directions for the two diUbs. (D) The combined CSPs of significantly shifted peaks from 15N labeled CeTDP2 UBA at indicated molar ratios with monoUb. The range of Kd values calculated for the chosen residues is shown on the graph. (E) CSPs of significantly shifted peaks from 15N labeled monoUb titrated with increasing concentration of CeTDP2 UBA. The range of Kd values calculated for the chosen residues is shown on the graph. (F) Binding affinity averages from chemical shift titrations of different combinations of CeTDP2 UBA and Ubs are shown, with error bars for standard error of mean. Text labels inside each bar indicate the protein that was 15N labeled in that experiment. Ligand for the corresponding binding experiment is shown as a schematic cartoon label under the X-axis. The bottom half of the panel shows what each schematic cartoon represents. The kinked and straight black bars between two Ub moieties stands for the K48- and K63-linkage, respectively. The cartoons do not depict the actual binding poses (they are not meant to show that UBA only interacts with the distal Ub moieties of diUbs).
Figure 6.
Figure 6.
Interaction of K48-linked diUb with UBA. (A) Per residue chemical shift perturbation map of 15N labeled distal Ub residues when K48-linked diUb was titrated with increasing concentrations of CeTDP2 UBA. The red line denotes cut-off for significance; set at 1 standard deviation (1 σ) from all the weighted averaged chemical shift values. Peaks that vanished during the titration are represented by black triangles on the graph and prolines, which are excluded from this analysis, indicated with red triangles. (B) Per residue chemical shift perturbation map of 15N labeled proximal Ub residues when K48-linked diUb was titrated with increasing concentrations of CeTDP2 UBA. Significance denoted by a red line defined as in A. Prolines and amino acids with signals that disappeared are represented by red and black triangles, respectively. (C) Per residue chemical shift perturbation map of 15N labeled CeTDP2 UBA residues when it was titrated with increasing concentrations of K48-linked diUb. Significance as in A. (D) A hypothetical model of one molecule of TDP2 UBA binding to one molecule of K48-linked diUb. Significantly shifted residues for TDP2 UBA and Ub are colored in red with some of these residues that determine the interaction surface on each Ub moiety labeled. Peaks that disappeared upon titration are colored in blue on both UBA and Ub moieties.
Figure 7.
Figure 7.
Interaction of K63-linked diUb with UBA. (A) Per residue chemical shift perturbation map of 15N labeled distal Ub residues when K63-linked diUb was titrated with increasing concentrations of CeTDP2 UBA. The red line denotes the cut-off for significance; set at 1 standard deviation (1 σ) from all the weighted averaged chemical shift values. Peaks that vanished during the titration are represented by black triangles on the graph. (B) Per residue chemical shift perturbation map of 15N labeled proximal Ub residues when K63-linked diUb was titrated with increasing concentrations of CeTDP2 UBA. Significance as in A. (C) Per residue chemical shift perturbation map of 15N labeled CeTDP2 UBA residues when it was titrated with increasing concentrations of K63-linked diUb. Significance as in A. (D) A hypothetical model of one molecule of TDP2 UBA binding to one molecule of K63-linked diUb. Significantly shifted residues for TDP2 UBA and Ub are colored in red with some of these residues that determine the UBA interaction surface on each Ub moiety labeled. Peaks that disappeared upon titration are colored in blue on both UBA and Ub moieties.
Figure 8.
Figure 8.
TDP2 UBA-Ub interaction partially determines response to Top2 poison, but is not involved in localization of TDP2 to the nucleus. (A) Cell survival curves in the presence of increasing concentrations of etoposide are compared for DT40 clones lacking TDP2 (TDP2−/−/−) and those complemented by WT HsTDP2 or HsTDP2 with complete N-terminal domain (residues 1–100) deletion transfections. Four different clones of the N-terminal deletion are shown for reproducibility purpose. (B) Same as A, but instead of complete N-terminal deletion, only F62R mutation in the UBA-Ub interaction surface was tested for survival compared to WT and TDP2-deleted clones. Results from two clones of the F62R transfection are shown. (C) Wild-type HsTDP2 and HsTDP2 mutants (HsTDP2cat, HsTDP2 F62R and HsTDP2 KKR) were N-terminally tagged with EGFP and individually expressed in Drosophila S2 cells to investigate localization of the molecules in cells. Wild-type HsTDP2 is imported and accumulates in the nucleus (EGFP-HsTDP2), whereas HsTDP2cat is not (EGFP-HsTDP2cat). The F62R mutation in the UBA domain does not affect nuclear localization of HsTdp2 (EGFP-HsTDP2 F62R). A triple-mutation (K23N, R25D and R26P: KRR) in the potential nuclear localization signal (NLS) sequence within the N-terminal region of HsTDP2 inhibits nuclear import and accumulation (EGFP-HsTDP2 KKR). Anti-EGFP and anti-Tubulin antibodies were used to stain EGFP-fusion proteins and microtubules, respectively. DNA was stained with DAPI. Each panel shows the maximum intensity projections of multiple z sections scanned through the thickness of each cell. Bar: 10 μm.
Figure 9.
Figure 9.
TDP2 does not have the MGF motif in loop1, conserved in other UBAs. (A) MSA of UBA domains from 17 different UBA-containing proteins. All these UBAs have been structurally characterized and their corresponding PDB IDs are listed on the right. MGF motif in loop 1 and important residues for Ub interaction in helix 3 are highlighted. CeTDP2, lacking the MGF motif, is boxed in red. The only other protein with significant dissimilarity in the MGF motif, mouse RSGI RUH, is boxed in black. Secondary structure schematic on top is representative of the four-helix bundle present in CeTDP2 UBA structure. (B) The 4th helix of TDP2 UBA may provide an extended surface for Ub binding. Hydrophobic residues forming and adjoining the ITA patch in TDP2 UBA (left) and MGF patch as well as hydrophobic residues on helix 3 in Ede1 UBA (right) are highlighted in red and labeled. α-helices are numbered for both structures.

Similar articles

Cited by

References

    1. Li C., Sun S.-Y., Khuri F.R., Li R. Pleiotropic functions of EAPII/TTRAP/TDP2: Cancer development, chemoresistance and beyond. Cell Cycle. 2011;10:3274–3283. - PMC - PubMed
    1. Pommier Y., Huang S.-Y.N., Gao R., Das B.B., Murai J., Marchand C. Tyrosyl-DNA-phosphodiesterases (TDP1 and TDP2) DNA Repair (Amst) 2014;19:114–129. - PMC - PubMed
    1. Cortes Ledesma F., El Khamisy S.F., Zuma M.C., Osborn K., Caldecott K.W. A human 5′-tyrosyl DNA phosphodiesterase that repairs topoisomerase-mediated DNA damage. Nature. 2009;461:674–678. - PubMed
    1. Pei H., Yordy J.S., Leng Q., Zhao Q., Watson D.K., Li R. EAPII interacts with ETS1 and modulates its transcriptional function. Oncogene. 2003;22:2699–2709. - PubMed
    1. Pype S., Declercq W., Ibrahimi A., Michiels C., Van Rietschoten J.G., Dewulf N., de Boer M., Vandenabeele P., Huylebroeck D., Remacle J.E. TTRAP, a novel protein that associates with CD40, tumor necrosis factor (TNF) receptor-75 and TNF receptor-associated factors (TRAFs), and that inhibits nuclear factor-kappa B activation. J. Biol. Chem. 2000;275:18586–18593. - PubMed

MeSH terms