. 2016 Sep;28(9):2276-2290.
doi: 10.1105/tpc.16.00540. Epub 2016 Aug 19.

Mitochondrial Defects Confer Tolerance against Cellulose Deficiency

Affiliations

Mitochondrial Defects Confer Tolerance against Cellulose Deficiency

Zhubing Hu et al. Plant Cell. 2016 Sep.

Abstract

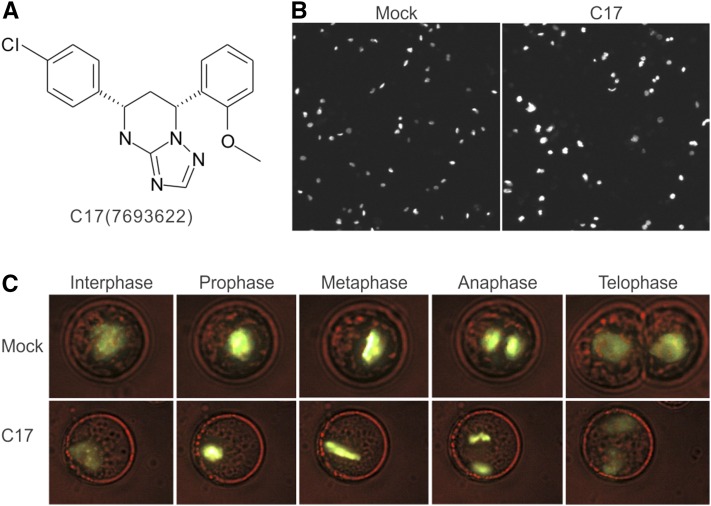
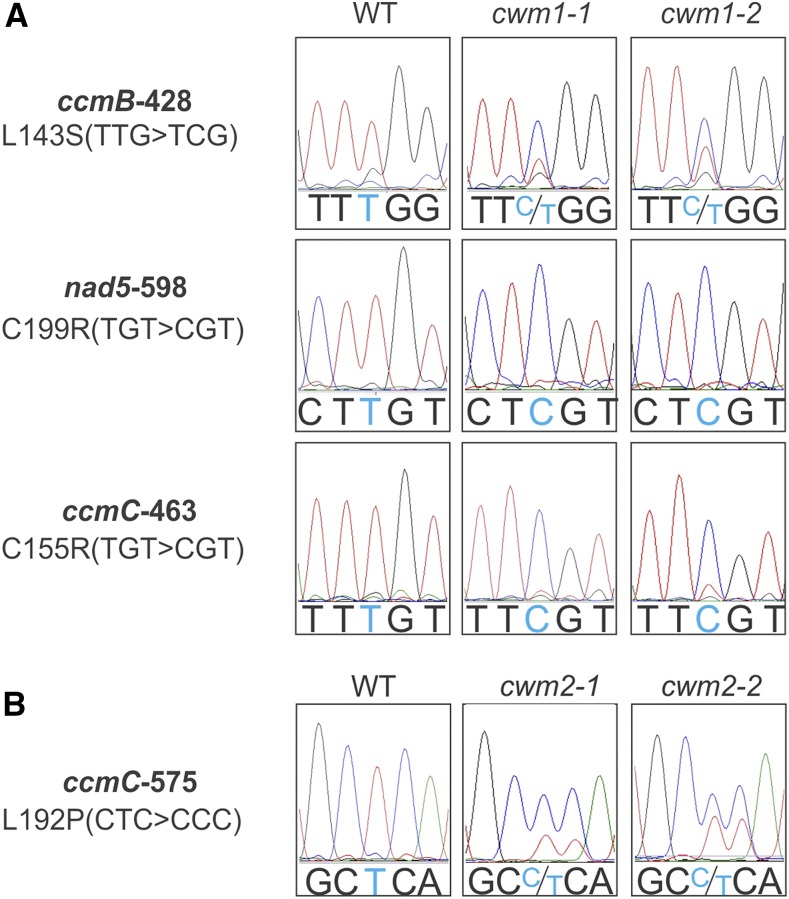
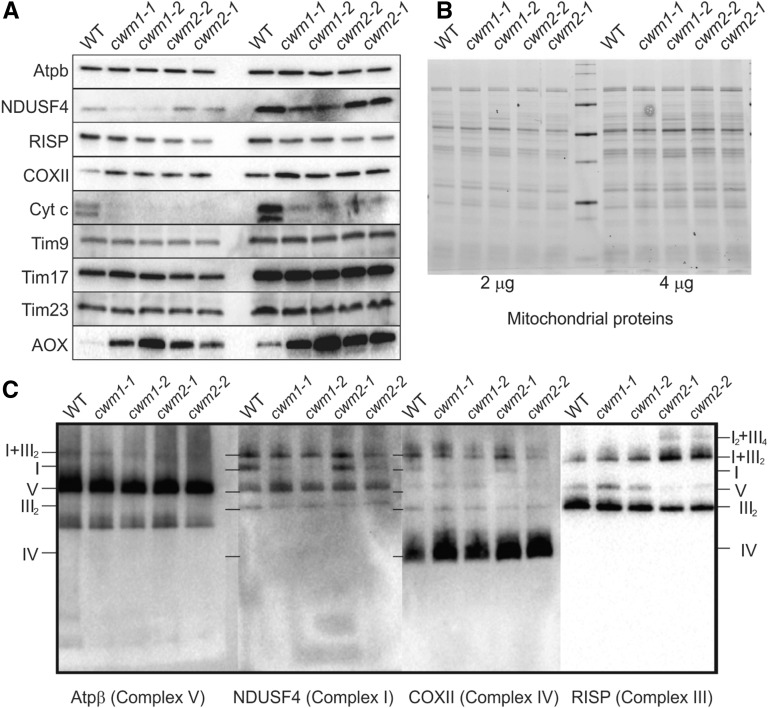
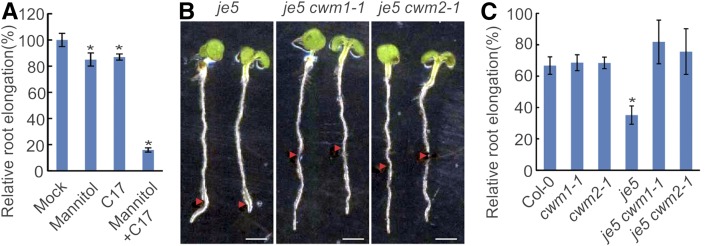
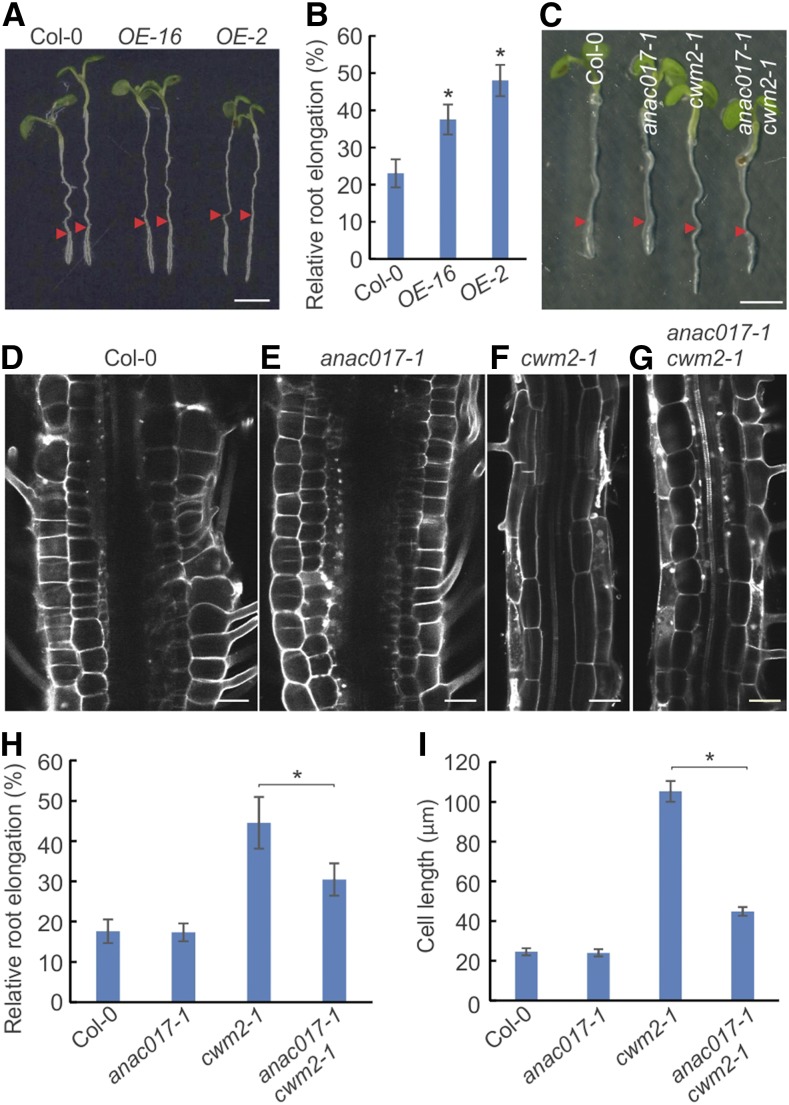
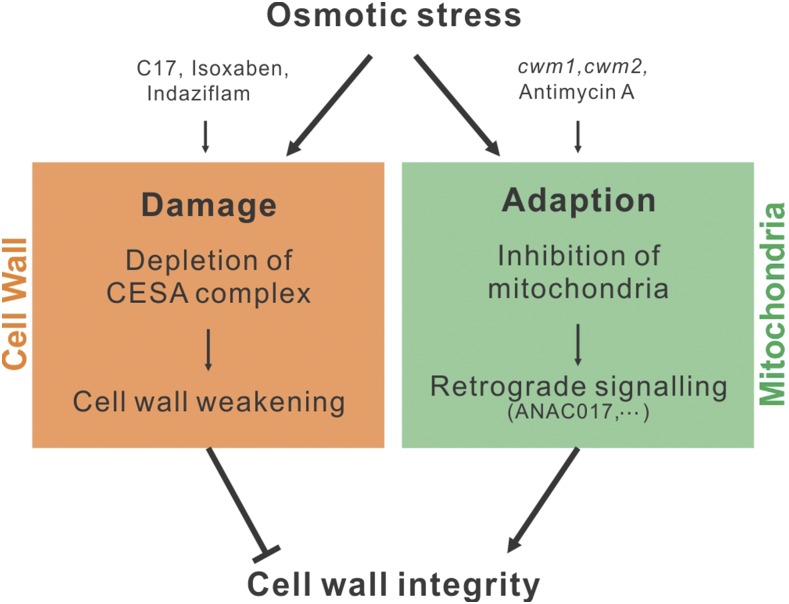
Because the plant cell wall provides the first line of defense against biotic and abiotic assaults, its functional integrity needs to be maintained under stress conditions. Through a phenotype-based compound screening approach, we identified a novel cellulose synthase inhibitor, designated C17. C17 administration depletes cellulose synthase complexes from the plasma membrane in Arabidopsis thaliana, resulting in anisotropic cell elongation and a weak cell wall. Surprisingly, in addition to mutations in CELLULOSE SYNTHASE1 (CESA1) and CESA3, a forward genetic screen identified two independent defective genes encoding pentatricopeptide repeat (PPR)-like proteins (CELL WALL MAINTAINER1 [CWM1] and CWM2) as conferring tolerance to C17. Functional analysis revealed that mutations in these PPR proteins resulted in defective cytochrome c maturation and activation of mitochondrial retrograde signaling, as evidenced by the induction of an alternative oxidase. These mitochondrial perturbations increased tolerance to cell wall damage induced by cellulose deficiency. Likewise, administration of antimycin A, an inhibitor of mitochondrial complex III, resulted in tolerance toward C17. The C17 tolerance of cwm2 was partially lost upon depletion of the mitochondrial retrograde regulator ANAC017, demonstrating that ANAC017 links mitochondrial dysfunction with the cell wall. In view of mitochondria being a major target of a variety of stresses, our data indicate that plant cells might modulate mitochondrial activity to maintain a functional cell wall when subjected to stresses.


Figures

Figure 1.
Figure 1.
C17 Interferes with Cytokinesis. (A) C17 chemical structure (ChemDiv, catalog no. 7693622). (B) H2B-YFP-labeled nuclei of Arabidopsis suspension cells in absence (mock) or presence (C17) of 50 µM C17 for 72 h. (C) The five main phases (interphase, prophase, metaphase, anaphase, and telophase) of mitosis of suspension cells cultivated under control conditions (mock, upper panel) or in the presence of 50 µM C17 (C17, bottom panel).
Figure 2.
Figure 2.
C17-Tolerant Mutants. (A) Five-day-old wild-type (Col-0) seedlings grown with (0.1, 0.2, 0.5, 1, 2, or 5 µM) or without (mock) C17. (B) Quantification of the root length of seedlings shown in (A). Data represent mean ± sd (n > 10). Statistically significant differences compared with wild-type plants in absence of C17 are indicated; *P value < 0.01 (two-tailed Student’s t test). (C) and (D) Roots of 5-d-old wild-type (Col-0) and 22 C17-tolerant mutants grown in the absence (C) or presence (D) of 2 µM C17. Bars = 5 mm.
Figure 3.
Figure 3.
Mapping of Mutations Rendering C17 Tolerance. (A) and (B) Genetic mapping and gene structure of CESA1 (A) and CESA3 (B). The cesa17l and cesa32c loci were mapped to CESA1 (AT4G32410) and CESA3 (AT5G05170), respectively. The gene structure is shown below: Exons are represented as filled rectangles, and introns are shown as lines. The nucleotide replacement in the mutant allele is indicated. Bar = 100 kb. (C) Schematic diagram of the domains and mutation locations in CESA1 and CESA3. CESA1 and CESA3 proteins are located in the plasma membrane (PM) with eight predicted transmembrane domains (black boxes). The C17 tolerance mutations are indicated by colored marks. The corresponding amino acid changes are listed.
Figure 4.
Figure 4.
C17 Inhibits Cellulose Biosynthesis and Depletes CSCs from the Plasma Membrane. (A) Hypocotyl elongation of 5-d-old dark-grown wild type (Col-0, left panel) and a C17-tolerant mutant (cesa1A1018V, right panel) in the absence (mock) or presence of C17 (0.05, 0.1, 0.2, and 0.5 µM). Bars = 0.25 mm. (B) Quantification of the hypocotyl length of plants shown in (A). Data represent mean ± sd (n > 10). Statistically significant differences compared with wild-type plants are indicated; *P value < 0.01 (two-sided Student’s t test). (C) Glucose content of the hypocotyl of 5-d-old dark-grown wild type in the presence of C17 (0, 0.1, and 0.2 µM). Data represent mean ± sd (n = 4). Statistically significant differences compared with wild-type plants are indicated; *P value < 0.01 (two-tailed Student’s t test). (D) GFP-CESA3 localization at the plasma membrane in the absence (mock) or presence of 50 µM C17 for 2 h. Single optical sections and time averages of 61 frames (5-min duration in 5-s intervals) of plasma membrane-localized GFP-CESA3. Bars = 10 µm.
Figure 5.
Figure 5.
C17 Results in a Brittle Cell Wall. (A) Representative confocal microscopy images of plants stained with PI. Four-day-old wild-type (Col-0, left panel) and C17-tolerant mutant (cesa1A1018V, right panel) seedlings were treated with 200 nM C17 for 0, 1, 2, or 3 h and roots were collected and stained with PI. The broken cells with brittle cell walls were visualized by the uptake of PI. Bars = 50 µm. (B) Representative confocal microscopy images of 4-d-old wild-type and je5 mutant seedlings (with a weak allele of CESA3) stained with PI. Bar = 50 µm. (C) Root growth of 4-d-old wild-type (Col-0) and C17-tolerant mutant (cesa1A108V) seedlings in the presence of 200 nM C17. Data represent mean ± sd (n > 5). Statistically significant differences compared with wild-type plants are indicated; *P value < 0.01 (two-tailed Student’s t test).
Figure 6.
Figure 6.
Suppression of C17 Sensitivity by the Mutations in CWM1 and CWM2. (A) Root growth of the wild type (Col-0) and cwm1 and cwm2 mutants. Three-day-old seedlings grown on half-strength MS medium were transferred for 2 d to control medium (mock) or medium containing 200 nM C17. Arrowheads indicate the root tip position at the moment of transfer. Bars = 5 mm. (B) Quantification of root elongation of plants after transfer. Data represent mean ± sd (n > 10). Statistically significant differences compared with wild-type plants are indicated; *P value < 0.01 (two-tailed Student’s t test).
Figure 7.
Figure 7.
Both CWM1 and CWM2 Are Involved in Mitochondrial RNA Editing Events. (A) Multiple mitochondrial RNA editing defects in cwm1 mutants. Sequencing chromatograms of editing sites (ccmB-428, nad5-598, and ccmC-463) from the wild type (left panel), cwm1-1 (middle panel), and cwm1-2 (right panel) are displayed. (B) ccmC-575 editing defect in cwm2 mutants. Sequencing chromatograms of the ccmC-575 editing site of the wild type (left panel), cwm2-1 (middle panel), and cwm2-2 (right panel) are displayed. The editing sites are marked with light blue color; amino acid changes caused by editing defects are listed on the left.
Figure 8.
Figure 8.
Deficiency of CWM1 and CWM2 Perturbs Mitochondrial Function. (A) Mitochondrial protein content was quantified using antibodies. Antibodies used detect ATP synthase (Atpb, subunit of complex V), ubiquinone oxidoreductase Fe-S protein4 (NDUFS4, subunit of complex I), Rieske iron-sulfur protein (RISP, subunit of complex III), cytochrome oxidase subunit II (COXII, subunit of complex IV), cytochrome c (Cyt c), AOX, and mitochondrial import inner membrane translocase subunits (Tim9, Tim17, and Tim23). (B) Image of total mitochondrial proteins of the wild type, cwm1 mutants (cwm1-1 and cwm1-2), and cwm2 mutants (cwm2-1 and cwm2-2). Two or four micrograms of mitochondrial proteins were separated with SDS-PAGE and stained with Coomassie blue. (C) Mitochondrial complexes in the wild type, cwm1 mutants (cwm1-1 and cwm1-2), and cwm2 mutants (cwm2-1 and cwm2-2). Mitochondrial proteins were separated with blue native polyacrylamide gel electrophoresis. Atpb antibody was used to visualize complex V, RISP for complex III, COXII for complex IV, and NDUFS4 for complex I. The identities of protein complexes are indicated on the left or right of the blots: I, complex I; IV, complex IV; V, complex V; III2, dimeric complex III; I+III2, supercomplex composed of complex I and dimeric complex III; I2+III4, a dimer of supercomplex I+III2.
Figure 9.
Figure 9.
Inhibition of Mitochondrial Complex III Phenocopies the C17-Tolerance Phenotype of cwm1 and cwm2 Mutants. (A) Root elongation of wild-type control-treated (DMSO), 1 µM AA-treated, and 50 µM RO-treated plants. Three-day-old seedlings grown on half-strength MS medium were transferred to medium without (left panel) or with (right panel) 200 nM C17 for 2 d. Arrowheads indicate the root tip position at the moment of transfer. Bars = 5 mm. (B) Quantification of the root elongation of plants after transfer. Data represent mean ± sd (n > 10). Statistically significant differences compared with wild-type plants in the absence of mitochondrial inhibitors are indicated; *P value < 0.01 (two-tailed Student’s t test). (C) Representative confocal microscopy images of 4-d-old wild type (Col-0) control-treated with 0.1% DMSO (mock) or with 1 µM AA, 200 nM C17 (C17), or a combination of 1 µM AA with 200 nM C17 (C17+AA). Two-hour treated roots were stained with PI. The brittle cell wall was visualized by the uptake of PI. Bar = 100 µm. (D) to (F) Representative spinning confocal microscopy images of 4-d-old GFP-CESA3 plants treated with 0.1% DMSO (D), 200 nM C17 (E), or a combination of 1 µM AA with 200 nM C17 (F). The images were taken at 20 min after treatment. Bars = 5 µm. (G) Quantification of fluorescence in (D) to (F). The relative intensity is calculated by the fluorescence per unit area in the root elongation zone of each sample divided by that of the mock-treated plants. Data represent mean ± sd (n = 5). Statistically significant differences compared with wild-type plants in mock are indicated; *P value < 0.01 (two-tailed Student’s t test).
Figure 10.
Figure 10.
Both cwm1 and cwm2 Mutations Enhance the Tolerance of je5 against Osmotic Stress. (A) Relative 2-d elongation of the wild type (Col-0) after transfer to the medium without (Mock) or with 200 mM mannitol, 100 nM C17 (C17), or the combination of 200 mM mannitol and 100 nM C17 (Mannitol+C17). Data represent mean ± sd (n > 10). Statistically significant differences compared with mock are indicated; *P < 0.01 (two-tailed Student’s t test). (B) Root growth of je5, je5 cwm1, and je5 cwm2 mutants in presence of 250 mM mannitol. Three-day-old seedlings grown on half-strength MS medium were transferred to medium with 250 mM mannitol for 2 d. Arrowheads indicate root tip position at the moment of transfer. Bar = 2.5 mm. (C) Relative 2-d elongation of the wild type (Col-0), cwm1-1, cwm2-1, je5, je5 cwm1-1, and je5 cwm2-1 after transfer to the medium supplemented with 250 mM mannitol. Data represent mean ± sd (n > 10). Statistically significant differences compared with wild-type plants are indicated; *P < 0.01 (two-tailed Student’s t test).
Figure 11.
Figure 11.
ANAC017 Is a Component Linking Mitochondria and Cell Wall. (A) Root growth of wild type (Col-0) and ANAC017-overexpressing lines (ANAC017OE-2 and ANAC017OE-16) in the presence of 200 nM C17. Three-day-old seedlings grown on half-strength MS medium were transferred to medium with 200 nM C17 for 2 d. Arrowheads indicate the root tip position at the moment of transfer. Bar = 2.5 mm. (B) Relative root elongation of wild type (Col-0) and ANAC017-overexpressing lines (ANAC017OE-2 and ANAC017OE-16). Three-day-old seedlings grown on half-strength MS medium were transferred to medium without (mock) or with 200 nM C17 for 2 d. Data represent mean ± sd (n > 10). (C) Root growth of the wild type (Col-0), ANAC017 knockout mutant (anac017-1), cwm2-1 single mutant, and cwm2-1 anac017-1 double mutant in the presence of 200 nM C17. Three-day-old seedlings grown on half-strength MS medium were transferred to medium with 200 nM C17 for 2 d. Arrowheads indicate the root tip position at the moment of transfer. (D) to (G) Representative images of root mature zone of the wild type (Col-0; [D]), ANAC017 knockout mutant (anac017-1; [E]), cwm2-1 single mutant (F), and cwm2-1 anac017-1 double mutant (G) in the presence of 200 nM C17. Bar = 50µm. (H) Relative root elongation of wild type (Col-0), ANAC017 knockout mutant (anac017-1), cwm2-1 single mutant, and cwm2-1 anac017-1 double mutant in the presence of 200 nM C17. Three-day-old seedlings grown on half-strength MS medium were transferred to medium without (mock) or with 200 nM C17 for 2 d. Data represent mean ± sd (n > 10). (I) The length of mature cortical cells of the wild type (Col-0), ANAC017 knockout mutant (anac017-1), cwm2-1 single mutant, and cwm2-1 anac017-1 double mutant in the presence of 200 nM C17. Data represent mean ± sd (n > 20). Statistically significant differences are indicated; *P value < 0.01 (two-tailed Student’s t test).
Figure 12.
Figure 12.
Model Depicting the Relationship between the Cell Wall and Mitochondria under Osmotic Stress Conditions. Osmotic stress exerts at least two different effects on the plants: damage and adaption. Damage occurs through the depletion of CESA complexes from the plasma membrane, resulting in decreased cellulose production that in turn leads to cell wall weakening and loss of cell wall integrity. Adaptation occurs in response to inhibition of mitochondrial activity, which triggers retrograde signaling that eventually results in cell wall fortification. CESA inhibitors (including C17, isoxaben, and indaziflam) mimic the process of cell wall damage, whereas inhibition of mitochondrial activity can be simulated by mutations in mitochondrial editing genes (such as CWM1 and CWM2) or application of chemical inhibitors (such as AA). The presence of both CESA and mitochondrial inhibitors likely mimics osmotic stress conditions, in which a decrease in cellulose content is matched by retrograde-induced cell wall modifications. Cell wall, orange; mitochondria, green.

References

    1. Barkan A., Small I. (2014). Pentatricopeptide repeat proteins in plants. Annu. Rev. Plant Biol. 65: 415–442. - PubMed
    1. Bartoli C.G., Gómez F., Martínez D.E., Guiamet J.J. (2004). Mitochondria are the main target for oxidative damage in leaves of wheat (Triticum aestivum L.). J. Exp. Bot. 55: 1663–1669. - PubMed
    1. Beeckman T., Przemeck G.K.H., Stamatiou G., Lau R., Terryn N., De Rycke R., Inzé D., Berleth T. (2002). Genetic complexity of cellulose synthase a gene function in Arabidopsis embryogenesis. Plant Physiol. 130: 1883–1893. - PMC - PubMed
    1. Bentolila S., Knight W., Hanson M. (2010). Natural variation in Arabidopsis leads to the identification of REME1, a pentatricopeptide repeat-DYW protein controlling the editing of mitochondrial transcripts. Plant Physiol. 154: 1966–1982. - PMC - PubMed
    1. Bentolila S., Oh J., Hanson M.R., Bukowski R. (2013). Comprehensive high-resolution analysis of the role of an Arabidopsis gene family in RNA editing. PLoS Genet. 9: e1003584. - PMC - PubMed