

Hip and ankle responses for reactive balance emerge from varying priorities to reduce effort and kinematic excursion: A simulation study
- PMID: 27543251
- PMCID: PMC5074864
- DOI: 10.1016/j.jbiomech.2016.08.007
Hip and ankle responses for reactive balance emerge from varying priorities to reduce effort and kinematic excursion: A simulation study
Abstract
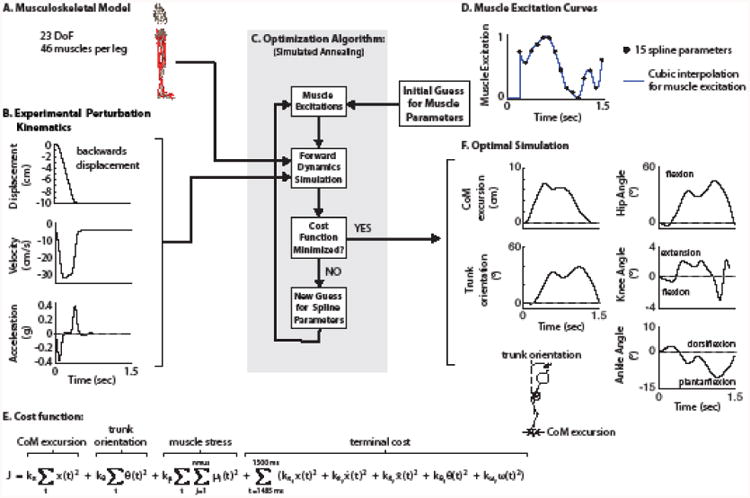
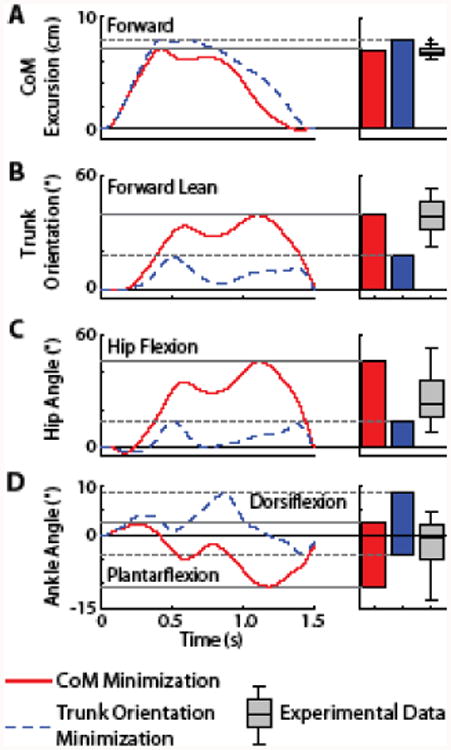
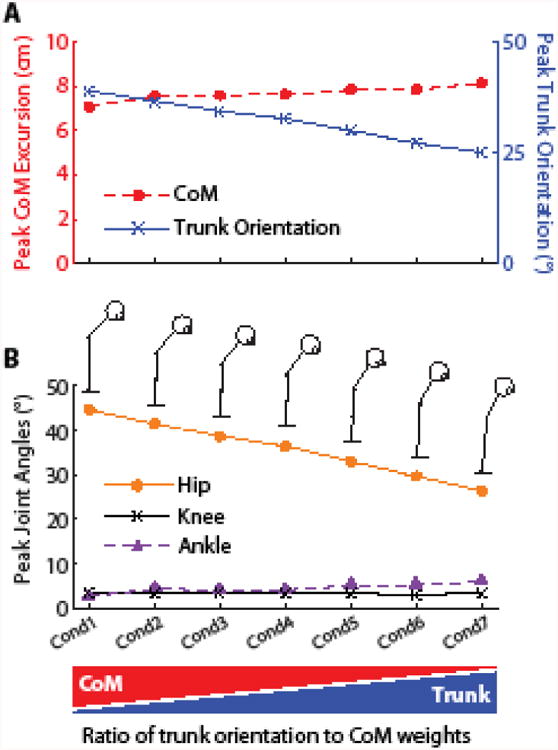
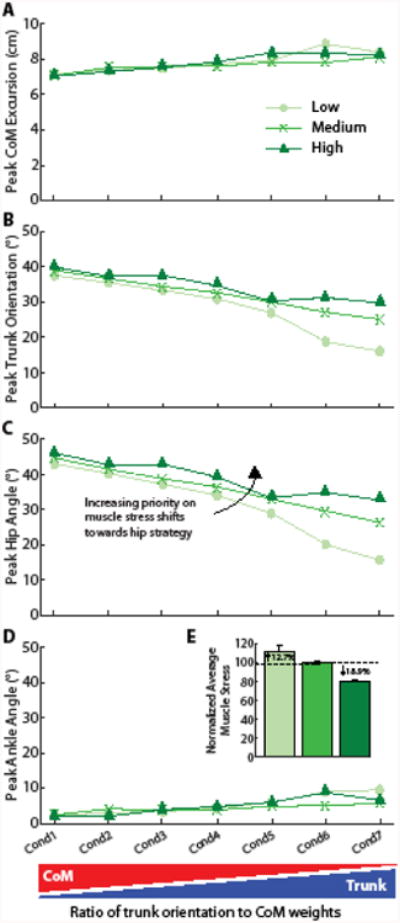
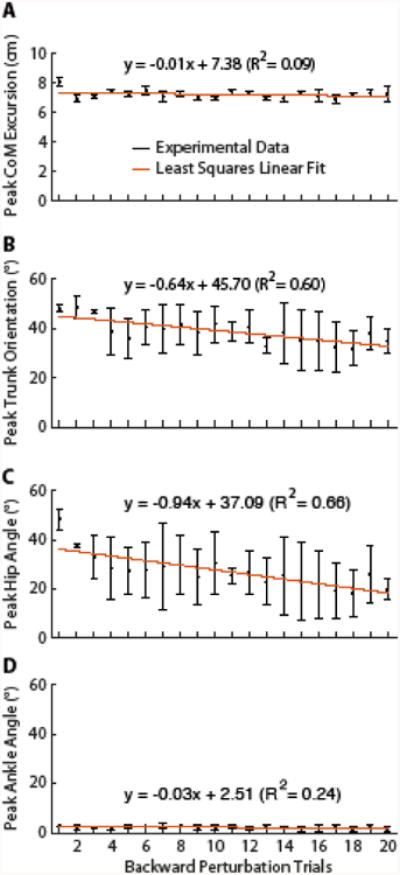
Although standing balance is important in many daily activities, there has been little effort in developing detailed musculoskeletal models and simulations of balance control compared to other whole-body motor activities. Our objective was to develop a musculoskeletal model of human balance that can be used to predict movement patterns in reactive balance control. Similar to prior studies using torque-driven models, we investigated how movement patterns during a reactive balance response are affected by high-level task goals (e.g., reducing center-of-mass movement, maintaining vertical trunk orientation, and minimizing effort). We generated 23 forward dynamics simulations where optimal muscle excitations were found using cost functions with different weights on minimizing these high-level goals. Variations in hip and ankle angles observed experimentally (peak hip flexion=7.9-53.1°, peak dorsiflexion=0.5-4.7°) could be predicted by varying the priority of these high-level goals. More specifically, minimizing center-of-mass motion produced a hip strategy (peak hip flexion and ankle dorsiflexion angles of 45.5° and 2.3°, respectively) and the response shifted towards an ankle strategy as the priority to keep the trunk vertical was increased (peak hip and ankle angles of 13.7° and 8.5°, respectively). We also found that increasing the priority to minimize muscle stress always favors a hip strategy. These results are similar to those from sagittal-plane torque-driven models. Our muscle-actuated model facilitates the investigation of neuromechanical interactions governing reactive balance control to predict muscle activity and movement patterns based on interactions between neuromechanical elements such as spinal reflexes, muscle short-range stiffness, and task-level sensorimotor feedback.
Keywords: Forward dynamics; Kinematics; Posture; Simulation.
Copyright © 2016 Elsevier Ltd. All rights reserved.
Conflict of interest statement
We wish to confirm that there are no known conflicts of interest associated with this publication and there has been no significant financial support for this work that could have influenced its outcome.
Figures
Similar articles
-
Contribution of muscle short-range stiffness to initial changes in joint kinetics and kinematics during perturbations to standing balance: A simulation study.J Biomech. 2017 Apr 11;55:71-77. doi: 10.1016/j.jbiomech.2017.02.008. Epub 2017 Feb 21. J Biomech. 2017. PMID: 28259465 Free PMC article.
-
Mechanical effort predicts the selection of ankle over hip strategies in nonstepping postural responses.J Neurophysiol. 2016 Oct 1;116(4):1937-1945. doi: 10.1152/jn.00127.2016. Epub 2016 Aug 3. J Neurophysiol. 2016. PMID: 27489362 Free PMC article.
-
Triggering of balance corrections and compensatory strategies in a patient with total leg proprioceptive loss.Exp Brain Res. 2002 Jan;142(1):91-107. doi: 10.1007/s00221-001-0926-3. Epub 2001 Nov 14. Exp Brain Res. 2002. PMID: 11797087
-
Contributions to the understanding of gait control.Dan Med J. 2014 Apr;61(4):B4823. Dan Med J. 2014. PMID: 24814597 Review.
-
Control of voluntary trunk movements in man. Mechanisms for postural equilibrium during standing.Acta Physiol Scand Suppl. 1990;595:1-60. Acta Physiol Scand Suppl. 1990. PMID: 2080712 Review.
Cited by
-
A sensorimotor enhanced neuromusculoskeletal model for simulating postural control of upright standing.Front Neurosci. 2024 May 15;18:1393749. doi: 10.3389/fnins.2024.1393749. eCollection 2024. Front Neurosci. 2024. PMID: 38812972 Free PMC article.
-
Delayed center of mass feedback in elderly humans leads to greater muscle co-contraction and altered balance strategy under perturbed balance: A predictive musculoskeletal simulation study.PLoS One. 2024 May 24;19(5):e0296548. doi: 10.1371/journal.pone.0296548. eCollection 2024. PLoS One. 2024. PMID: 38787871 Free PMC article.
-
Postural control of a musculoskeletal model against multidirectional support surface translations.PLoS One. 2019 Mar 6;14(3):e0212613. doi: 10.1371/journal.pone.0212613. eCollection 2019. PLoS One. 2019. PMID: 30840650 Free PMC article.
-
Human foot force informs balance control strategies when standing on a narrow beam.J Neurophysiol. 2024 Oct 1;132(4):1302-1314. doi: 10.1152/jn.00089.2024. Epub 2024 Sep 11. J Neurophysiol. 2024. PMID: 39258774
-
Methods for integrating postural control into biomechanical human simulations: a systematic review.J Neuroeng Rehabil. 2023 Aug 21;20(1):111. doi: 10.1186/s12984-023-01235-3. J Neuroeng Rehabil. 2023. PMID: 37605197 Free PMC article.
References
-
- Anderson FC. Doctoral Dissertation. The University of Texas; Austin: 1999. A dynamic optimization solution for a complete cycle of normal gait.
-
- Anderson FC, Pandy MG. A Dynamic Optimization Solution for Vertical Jumping in Three Dimensions. Comput Methods Biomech Biomed Engin. 1999;2:201–231. - PubMed
-
- Anderson FC, Pandy MG. Individual muscle contributions to support in normal walking. Gait Posture. 2003;17:159–169. - PubMed
-
- Bobbert MF, van Soest AJ. Why do people jump the way they do? Exerc Sport Sci Rev. 2001;29:95–102. - PubMed
MeSH terms
Grants and funding
LinkOut - more resources
Full Text Sources
Other Literature Sources
