. 2016 Oct;67(18):5429-5445.
doi: 10.1093/jxb/erw307. Epub 2016 Aug 19.

The photomorphogenic factors UV-B RECEPTOR 1, ELONGATED HYPOCOTYL 5, and HY5 HOMOLOGUE are part of the UV-B signalling pathway in grapevine and mediate flavonol accumulation in response to the environment

Affiliations

The photomorphogenic factors UV-B RECEPTOR 1, ELONGATED HYPOCOTYL 5, and HY5 HOMOLOGUE are part of the UV-B signalling pathway in grapevine and mediate flavonol accumulation in response to the environment

Rodrigo Loyola et al. J Exp Bot. 2016 Oct.

Abstract

Grapevine (Vitis vinifera L.) is a species well known for its adaptation to radiation. However, photomorphogenic factors related to UV-B responses have not been molecularly characterized. We cloned and studied the role of UV-B RECEPTOR (UVR1), ELONGATED HYPOCOTYL 5 (HY5), and HY5 HOMOLOGUE (HYH) from V. vinifera We performed gene functional characterizations, generated co-expression networks, and tested them in different environmental conditions. These genes complemented the Arabidopsis uvr8 and hy5 mutants in morphological and secondary metabolic responses to radiation. We combined microarray and RNA sequencing (RNA-seq) data with promoter inspections to identify HY5 and HYH putative target genes and their DNA binding preferences. Despite sharing a large set of common co-expressed genes, we found different hierarchies for HY5 and HYH depending on the organ and stress condition, reflecting both co-operative and partially redundant roles. New candidate UV-B gene markers were supported by the presence of HY5-binding sites. These included a set of flavonol-related genes that were up-regulated in a HY5 transient expression assay. We irradiated in vitro plantlets and fruits from old potted vines with high and low UV-B exposures and followed the accumulation of flavonols and changes in gene expression in comparison with non-irradiated conditions. UVR1, HY5, and HYH expression varied with organ, developmental stage, and type of radiation. Surprisingly, UVR1 expression was modulated by shading and temperature in berries, but not by UV-B radiation. We propose that the UV-B response machinery favours berry flavonol accumulation through the activation of HY5 and HYH at different developmental stages at both high and low UV-B exposures.

Keywords: Binding; MYBF1; UVR8.; glycosyltransferase; network; photolyase; ripening.


Figures

Fig. 1.
Fig. 1.
Transgenic expression of VviUVR1 and VviHY5 in Arabidopsis complements the uvr8 and hy5 mutant UV-B phenotypes. (A–D) Restored UV-B-induced hypocotyl growth inhibition in UVR1 and HY5 complementation lines. Wt (Col-0), uvr8-6 mutant, hy5-215 mutant, and UVR1 and HY5 complementation lines were grown under white light with or without supplementary UV-B radiation. (E, F) Total flavonol accumulation in 6-day-old seedlings grown under white light with or without supplementary UV-B. Error bars represent the SD (n=6 plates with 15 seedlings each). Asterisks indicate statistical significance. (This figure is available in colour at JXB online.)
Fig. 2.
Fig. 2.
VviHY5–GFP subcellular localization in agroinfiltrated tobacco leaves. Two days after infiltration, plants were kept in light (A–C) or transferred to a chamber with light supplemented with UV-B for 2h (D–F). Light-field images are merged with the GFP filter. Bars represent a scale of 5 µm. The insert in (A) shows nucleolar peripheral localization and a nuclear spleckle in the nucleus indicated with an arrowhead. (This figure is available in colour at JXB online.)
Fig. 3.
Fig. 3.
Comparison of UVR1, HY5, and HYH expression levels in grapevine organs of field-grown plants of cv. Cabernet Sauvignon. Expression in (A) all organs tested, (B) berry developmental stages, and (C) inflorescence development. Expression levels were normalized against the tissue of lowest expression in (A) and the expression at the first developmental stage in (B) and (C). SDs are the result of three independent replicates.
Fig. 4.
Fig. 4.
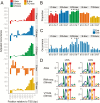
Genome-wide analysis of predicted HY5 and UV-B response cis-regulatory elements (CREs) in grapevine promoters. (A) Distribution plots of HY5 and UV-B response CREs in grapevine promoters (1kb upstream of the TSS). Each bin represents the total motif occurrence in 50 promoter bases, adjusted for the baseline occurrence (average motif occurrence between the –500 and –1000bp region). The baselines of the C-box, C/A-box, C/G-box, E-box, and T/G-box are 490, 798, 600, 709, and 333, respectively. Motif Z-scores for the C-box, C/A-box, C/G-box, E-box, and T/G-box are 6.4, 1.6, 5.8, –0.7, and 2.9 respectively. (B) Frequencies (in proportion) of highly co-expressed genes with HY5 and HYH inferred from various data sets (atlas, stress-related RNA-seq, and stress-related VTCdb) containing the relevant CRE in their promoter region. Strong enrichment of the CRE based on the differences in proportions following a hypergeometric distribution is indicated as * (P<0.01). (C) The total number of CRE occurrences (Obs) in promoter regions of HY5 and HYH co-expressed genes and randomized promoters of similar size (Exp). Statistically significant CRE observations at P<0.01 (based on 1000 permutations) are indicated by asterisks. (D) The sequence logo for grapevine HY5 and HYH inferred from degenerate binding sites enriched in various data sets. a, HY5 (Atlas); b, HY5 (Stress RNA-seq); c HY5 (Stress VTCdb); d, HYH (Atlas); e, HYH (Stress RNA-seq); f, HYH (Stress VTCdb). (This figure is available in colour at JXB online.)
Fig. 5.
Fig. 5.
Integrated grapevine HY5 and HYH community gene co-expression and cis-regulatory subnetwork. Square and circle nodes indicate co-expressed target genes and the presence of various HY5 consensus CREs predicted in co-expressed target genes. Square nodes indicate putative functions of co-expressed target genes; DNA repair, flavonoid, HSP and chaperones, jasmonic acid, photosynthesis, terpenes, transporters, and UV markers. Circle nodes, shown as pie charts, indicate the type of HY5 consensus CRE present in the promoter region of each co-expressed gene. Edges represent significant co-expression between each unique and shared HY5 and HYH subnetwork. Edges also indicate the nodes supported by one, two, three, four, five, and six co-expression networks. Gene IDs can be found in Supplementary Table S8. (This figure is available in colour at JXB online.)
Fig 6.
Fig 6.
Transient expression of HY5 in grapevine plantlets induces flavonol-related genes. Normalized gene expression values and induction fold changes in response to HY5 ectopic expression. Grapevine in vitro plants were agroinfiltrated with either a 35S:VP64-HY5 construct or an empty vector, and kept in low light conditions for 5 d before gene expression quantification. Values above asterisks indicate significant differences compared with the control.
Fig. 7.
Fig. 7.
Flavonol synthesis is activated in leaves in response to low UV-B irradiance. (A) Time series of flavonol accumulation in plantlets exposed to 6h of UV-B under in vitro conditions. The 48h and 96h measurements correspond to the recovery stage after the treatment. Data were normalized against the control (–UV-B), independently for each time point. Different lower case letters indicate significant differences between treatments as calculated by Tukey statistical analysis (P<0.05). (B) Expression of a set of VvHY5 co-expressed genes in plantlet leaves after 6h of irradiation with low UV-B irradiance. Gene expression was measured by quantitative real-time PCR, and data were normalized against the control.
Fig. 8.
Fig. 8.
The UV-induced expression of flavonol-related genes correlates with HY5 and HYH at different stages of berry development. (A) UV-B daily measurements were taken in a tested UV-free greenhouse from 07:00h to 22:00h. (B) Flavonol measurements at technical maturity in berry skins in response to high and low UV-B irradiance at 9 WAV. (C) Gene expression changes of the UV-B signalling pathway and flavonoid-related genes in berry skins of irradiated fruit clusters. Gene expression data were normalized against the control at –3 WAV. Different lower case letters indicate significant differences (Tukey test, P<0.05).
Fig. 9.
Fig. 9.
UV-B response factors are modulated by light, temperature, and biotic stress. (A) Expression analysis of candidate UV-B perception and signalling in response to various abiotic and biotic stresses in different organs based on RNA-seq data. Significantly up-regulated and down-regulated (FDR <0.05, |Log2FC|>1) genes identified with DESeq2 are indicated with varying intensities. (B) Expression of UV-B response factors under both light and temperature regimes in detached grape berries. Different lower case letters indicate statistically significant differences (P<0.05). (This figure is available in colour at JXB online.)

References

    1. Abbas N, Maurya JP, Senapati D, Gangappa SN, Chattopadhyay S. 2014. Arabidopsis CAM7 and HY5 physically interact and directly bind to the HY5 promoter to regulate its expression and thereby promote photomorphogenesis. The Plant Cell 26, 1036–1052. - PMC - PubMed
    1. Alonso JM, Stepanova AN, Leisse TJ, et al. 2003. Genome-wide insertional mutagenesis of Arabidopsis thaliana. Science 301, 653–657. - PubMed
    1. Anders S, Pyl PT, Huber W. 2014. HTSeq A Python framework to work with high-throughput sequencing data. Bioinformatics 31, 166–169. - PMC - PubMed
    1. Ang LH, Chattopadhyay S, Wei N, Oyama T, Okada K, Batschauer A, Deng XW. 1998. Molecular interaction between COP1 and HY5 defines a regulatory switch for light control of Arabidopsis development. Molecular Cell 1, 213–222. - PubMed
    1. Aoki Y, Okamura Y, Tadaka S, Kinoshita K, Obayashi T. 2016. ATTED-II in 2016: a plant coexpression database towards lineage-specific coexpression. Plant and Cell Physiology 57, e5. - PMC - PubMed

Publication types

MeSH terms