

Elevation of Vδ1 T cells in peripheral blood and livers of patients with primary biliary cholangitis
- PMID: 27543908
- PMCID: PMC5108068
- DOI: 10.1111/cei.12852
Elevation of Vδ1 T cells in peripheral blood and livers of patients with primary biliary cholangitis
Abstract
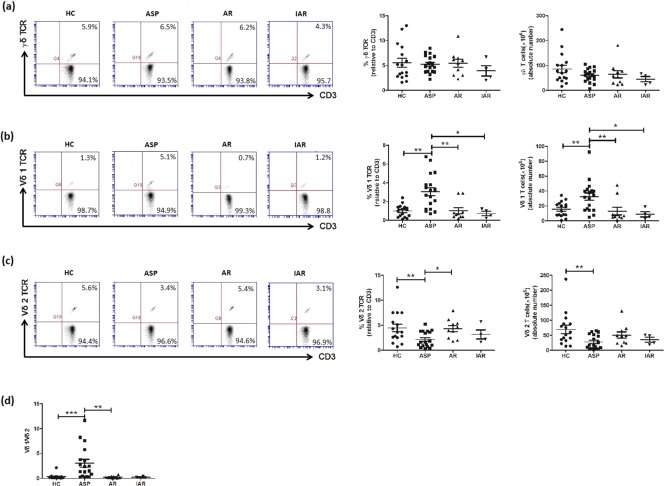
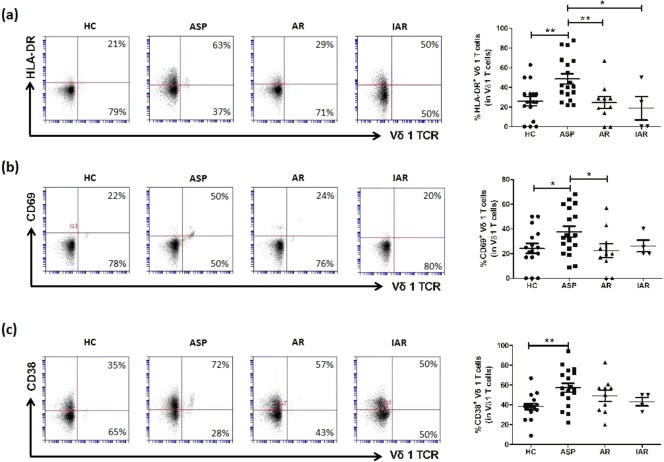
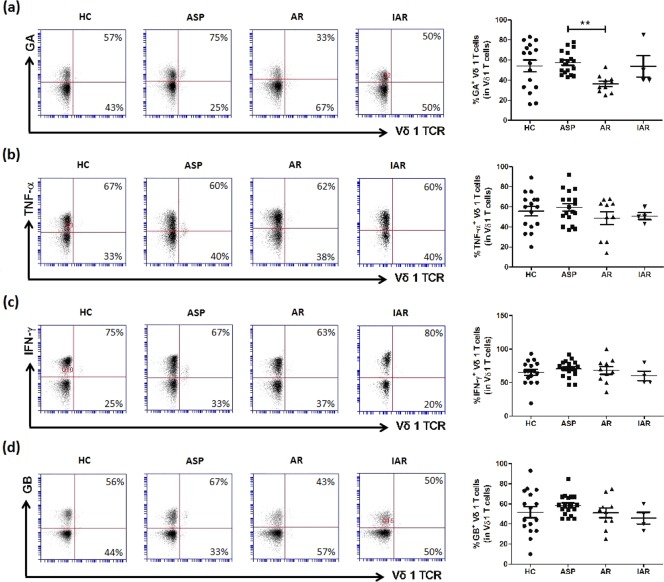
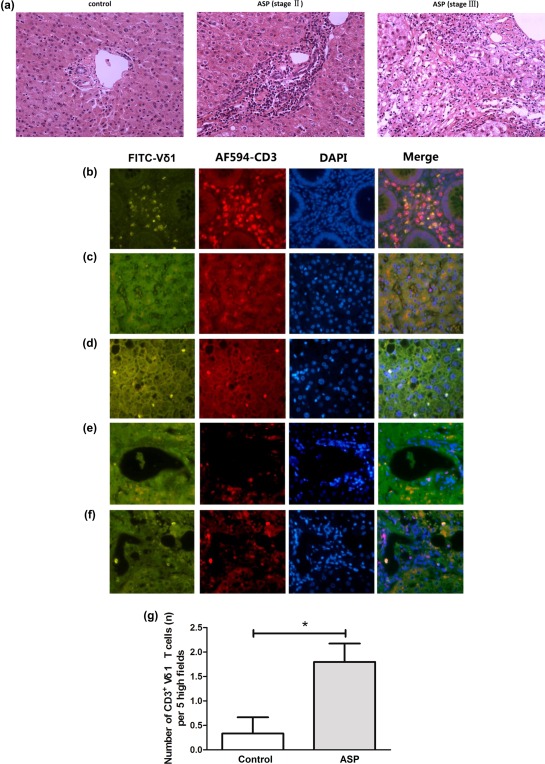
Primary biliary cholangitis (PBC), hitherto called primary biliary cirrhosis, is a cholestatic liver disease of unclear aetiology with autoimmune features. Accumulating evidence revealed that γδ T cells were involved in the development of autoimmune diseases. As one of γδ T cells subsets, however, the role of Vδ1 T cells in the immunopathogenesis of PBC is poorly understood. We analysed peripheral blood Vδ1 T cells in PBC patients in active stage (ASP, n = 18), adequate responders (AR, n = 10) and inadequate responders (IAR, n = 4) to ursodeoxycholic acid (UDCA) and an age-matched healthy control group (n = 16) by flow cytometric analysis. The ASP group exhibited a significantly higher proportion and absolute number of Vδ1 T cells, which were also observed in immunofluorescence staining of liver biopsy specimens of PBC patients. Moreover, these Vδ1 T cells expressed a series of activation markers and intracellular cytokines, which may contribute to the immunopathogenesis of PBC. Our study will help to clarify the role of Vδ1 T cells in the development of PBC.
Keywords: Vδ1 T cells; autoimmune disease; primary biliary cholangitis; γδ T cells.
© 2016 British Society for Immunology.
Figures
Similar articles
-
Reciprocal alterations in circulating and hepatic gamma-delta T cells in patients with primary biliary cholangitis.Hepatol Int. 2022 Feb;16(1):195-206. doi: 10.1007/s12072-021-10267-7. Epub 2022 Jan 14. Hepatol Int. 2022. PMID: 35028922
-
Elevation of gamma delta T lymphocytes in peripheral blood and livers of patients with primary sclerosing cholangitis and other autoimmune liver diseases.Hepatology. 1996 May;23(5):988-93. doi: 10.1002/hep.510230508. Hepatology. 1996. PMID: 8621180
-
Vdelta1 T lymphocytes expressing a Th1 phenotype are the major gammadelta T cell subset infiltrating the liver of HCV-infected persons.Mol Med. 2001 Jan;7(1):11-9. Mol Med. 2001. PMID: 11474123 Free PMC article.
-
The immunogenetics of primary biliary cirrhosis: A comprehensive review.J Autoimmun. 2015 Nov;64:42-52. doi: 10.1016/j.jaut.2015.07.004. Epub 2015 Aug 3. J Autoimmun. 2015. PMID: 26250073 Free PMC article. Review.
-
Lymphocyte recruitment and homing to the liver in primary biliary cirrhosis and primary sclerosing cholangitis.Semin Immunopathol. 2009 Sep;31(3):309-22. doi: 10.1007/s00281-009-0167-2. Epub 2009 Jun 17. Semin Immunopathol. 2009. PMID: 19533132 Free PMC article. Review.
Cited by
-
Diverse Subsets of γδT Cells and Their Specific Functions Across Liver Diseases.Int J Mol Sci. 2025 Mar 19;26(6):2778. doi: 10.3390/ijms26062778. Int J Mol Sci. 2025. PMID: 40141420 Free PMC article. Review.
-
γδ T cells in liver diseases.Front Med. 2018 Jun;12(3):262-268. doi: 10.1007/s11684-017-0584-x. Epub 2018 Feb 14. Front Med. 2018. PMID: 29441440 Review.
-
Single-cell mass cytometry on peripheral blood identifies immune cell subsets associated with primary biliary cholangitis.Sci Rep. 2020 Jul 28;10(1):12584. doi: 10.1038/s41598-020-69358-4. Sci Rep. 2020. PMID: 32724082 Free PMC article.
References
-
- Ulrich Beuers ME, Gershwin Robert G et al Changing nomenclature for PBC: from cirrhosis to cholangitis. Gut 2015; 64:1671–2. - PubMed
-
- Kaplan MM, Gershwin ME. Primary biliary cirrhosis. N Engl J Med 2005; 353:1261–73. - PubMed
-
- Lindor KD, Gershwin ME, Poupon R et al Primary biliary cirrhosis. Hepatology 2009; 50:291–308. - PubMed
-
- Carbone M, Mells GF, Pells G et al Sex and age are determinants of the clinical phenotype of primary biliary cirrhosis and response to ursodeoxycholic acid. Gastroenterology 2013; 144:560–9. - PubMed
MeSH terms
Substances
LinkOut - more resources
Full Text Sources
Other Literature Sources
Research Materials
