. 2017 Sep;27(5):567-579.
doi: 10.1111/bpa.12434. Epub 2016 Oct 28.

Tumor cells with neuronal intermediate progenitor features define a subgroup of 1p/19q co-deleted anaplastic gliomas

Collaborators, Affiliations

Tumor cells with neuronal intermediate progenitor features define a subgroup of 1p/19q co-deleted anaplastic gliomas

Franck Bielle et al. Brain Pathol. 2017 Sep.

Abstract

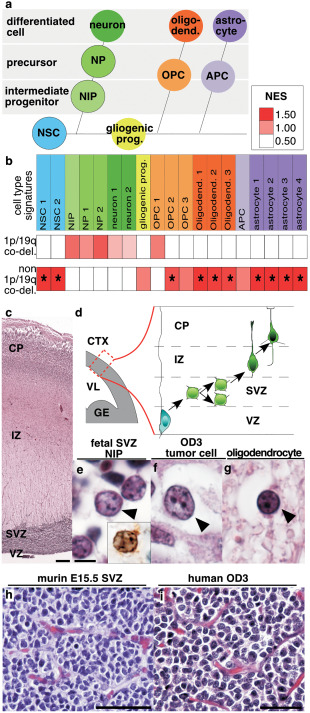
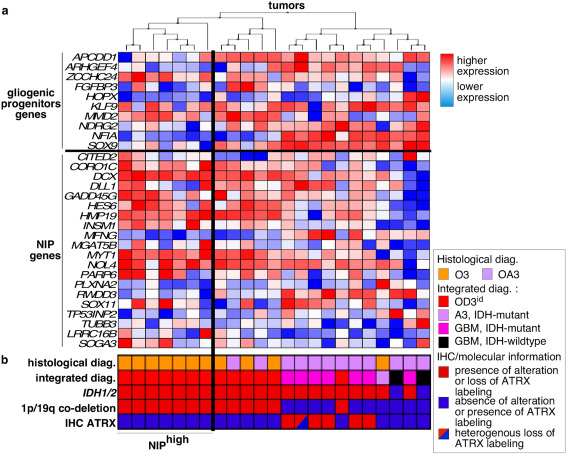
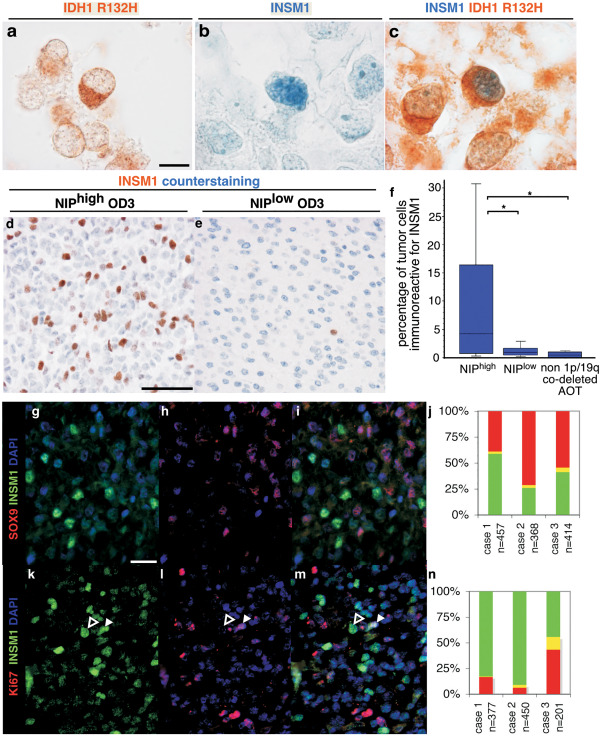
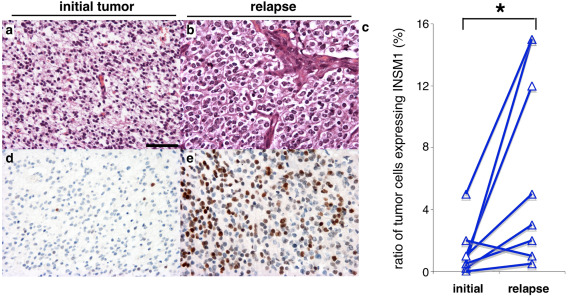
The integrated diagnosis of anaplastic oligodendroglioma, IDH mutant and 1p/19q co-deleted, grade III (O3id ) is a histomolecular entity that WHO 2016 classification distinguished from other diffuse gliomas by specific molecular alterations. In contrast, its cell portrait is less well known. The present study is focused on intertumor and intratumor, cell lineage-oriented, heterogeneity in O3id . Based on pathological, transcriptomic and immunophenotypic studies, a novel subgroup of newly diagnosed O3id overexpressing neuronal intermediate progenitor (NIP) genes was identified. This NIP overexpression pattern in O3id is associated with: (i) morphological and immunohistochemical similarities with embryonic subventricular zone, (ii) proliferating tumor cell subpopulation with NIP features including expression of INSM1 and no expression of SOX9, (iii) mutations in critical genes involved in NIP biology and, (iv) increased tumor necrosis. Interestingly, NIP tumor cell subpopulation increases in O3id recurrence compared with paired newly diagnosed tumors. Our results, validated in an independent cohort, emphasize intertumor and intratumor heterogeneity in O3id and identified a tumor cell subpopulation exhibiting NIP characteristics that is potentially critical in oncogenesis of O3id . A better understanding of spatial and temporal intratumor cell heterogeneity in O3id will open new therapeutic avenues overcoming resistance to current antitumor treatments.

Keywords: 1p/19q co-deletion; anaplastic oligodendroglioma; embryonic subventricular zone; neuronal intermediate progenitor.


Figures

Figure 1
Figure 1
Expression of cell lineage signatures according to 1p/19q co‐deletion status in anaplastic oligodendroglial tumors. a. Schematic representation of embryonic central nervous system lineages. Neural stem cells produce neurons, becomes gliogenic progenitors after the glial switch and then produce oligodendrocytes and astrocytes. b. Normalized Enrichment Score obtained by Gene Set Enrichment Analysis for cell lineage signatures is presented by a color scale. Significant enrichments (False Discovery Rate < 0.25) are indicated by an asterisk. c. Human cerebral cortex at gestational week 19 (GW19) (H&E). d. Schema of the embryonic mammalian cerebral cortex with its layers: ventricular zone containing neural stem cells, subventricular zone containing neuronal intermediate progenitors, intermediate zone containing neuronal precursors and cortical plate containing differentiating neurons. e. Neuronal intermediate progenitors (arrowhead) in the human fetal GW19 SVZ (H&E) are identified by INSM1 immunostaining (inset in e). f, g. Adult human anaplastic oligodendroglioma with tumor cell (arrowhead in f, H&E) and residual oligodendrocyte (arrowhead in g, H&E). h. Murine cerebral cortex SVZ at embryonic day 15 and i. human anaplastic oligodendroglioma: both presented honey comb aspect and branched vessels. Abbreviations. 1p/19q co‐del., 1p/19q co‐deletion; APC, astrocyte precursor cell; CP, cortical plate; CTX, cerebral cortex; GE, ganglionic eminence; gliogenic prog., gliogenic progenitors; IZ, intermediate zone; NES, Normalized Enrichment Score; NIP, neuronal intermediate progenitor; NP, neuronal precursor; NSC, neural stem cells; OPC, oligodendrocyte progenitor cell; OD3, anaplastic oligodendroglioma (grade III); SVZ, subventricular zone; VL, lateral ventricle; VZ, ventricular zone. Scale bars. C: 250 µm; E–G: 5 µm; H: 25 µm; I: 50 µm.
Figure 2
Figure 2
Hierarchical clustering of tumors according to the expression of genes of the gliogenic progenitor vs. NIP. a. columns correspond to tumors and lines correspond to genes. NIPhigh subgroup contained 1p/19q co‐deleted AOT clustering together with higher expression of NIP genes. NIPlow subgroup contained the other 1p/19q co‐deleted AOT. b. WHO 2016 histological and integrated diagnoses and molecular markers are indicated for each tumor. Abbreviations: A3, IDH‐mutant: anaplastic astrocytoma, IDH‐mutant; GBM, IDH‐mutant: glioblastoma, IDH‐mutant; GBM, IDH‐wildtype, glioblastoma, IDH‐wildtype; IHC, immunohistochemical; OA3, anaplastic oligo‐astrocytoma; OD3, anaplastic oligodendroglioma.
Figure 3
Figure 3
INSM1 immunolabeling in anaplastic oligodendroglial tumors. a–c. three sections of the same anaplastic oligodendroglial tumor of the NIPhigh subgroup were immunolabeled for IDH1 R132H (brown signal in a, c), and INSM1 (blue signal in b, c). Some tumor cells showed cytoplasmic immunolabeling for IDH1 R132H and nuclear immunolabeling for INSM1 (c). d, e. Immunolabeling of INSM1 (brown signal) and counterstaining (blue signal) in anaplastic oligodendroglioma of the NIPhigh and NIPlow subgroups. f. Quantification of INSM1 immunolabeling in NIPhigh vs. NIPlow and non 1p/19q co‐deleted tumors with significant difference (P = 0.0163 Kruskal–Wallis test; asterisk NIPhigh vs. NIPlow P = 0.0454; asterisk NIPhigh vs. non 1p/19q co‐deleted AOT P = 0.0143; Mann–Whitney test). g–i. Double immunolabeling of an anaplastic oligodendroglial tumors of the NIPhigh subgroup by INSM1 (green, g, i) and SOX9 (red, h, i) with quantification (j). Both markers are expressed by two mainly exclusive tumor cell populations. k–m, double immunolabeling of an anaplastic oligodendroglial tumors of the NIPhigh subgroup by INSM1 (green, k, m) and Ki‐67 (red, l, m) with quantification (n). Most INSM1+ cells are negative for Ki‐67 (open arrowhead, f–h) and a minority of INSM1+ cells are positive for Ki‐67 (solid arrowhead, f–h). Scale bars. A–C: 10 µm, D–E: 50 µm. G–I, K–M: 20 µm.
Figure 4
Figure 4
INSM1 expression in newly diagnosed tumors and their relapse. a, b. H&E of a newly diagnosed anaplastic oligodendroglioma (a) and its relapse (b). c. Quantification of the ratio of INSM1 positive tumor cells among the total tumor cells in initial tumors and their relapse. Pairs of tumors are linked by a line. Asterisk correspond to P = 0.03, paired t test. d, e. INSM1 immunolabeling (brown) and blue counterstaining of the newly diagnosed (d) and relapsing (e) tumors. Scale bar: a, b, d, e: 100 µm.

References

    1. Akamatsu W, Okano HJ, Osumi N, Inoue T, Nakamura S, Sakakibara S et al (1999) Mammalian ELAV‐like neuronal RNA‐binding proteins HuB and HuC promote neuronal development in both the central and the peripheral nervous systems. Proc Natl Acad Sci U S A 96:9885–9890. - PMC - PubMed
    1. Akerstrom V, Chen C, Lan MS, Breslin MB (2013) Adenoviral insulinoma‐associated protein 1 promoter‐driven suicide gene therapy with enhanced selectivity for treatment of neuroendocrine cancers. Ochsner J 13:91–99. - PMC - PubMed
    1. Alentorn A, Marie Y, Carpentier C, Boisselier B, Giry M, Labussiere M et al (2012) Prevalence, clinico‐pathological value, and co‐occurrence of PDGFRA abnormalities in diffuse gliomas. Neuro Oncol 14:1393–1403. - PMC - PubMed
    1. Alentorn A, Sanson M, Idbaih A (2012) Oligodendrogliomas: new insights from the genetics and perspectives. Curr Opin Oncol 24:687–693. - PubMed
    1. Bannykh SI, Stolt CC, Kim J, Perry A, Wegner M (2006) Oligodendroglial‐specific transcriptional factor SOX10 is ubiquitously expressed in human gliomas. J Neurooncol 76:115–127. - PubMed

MeSH terms