. 2016;8(6):601-616.
doi: 10.1159/000448401. Epub 2016 Aug 20.

Filarial Infection or Antigen Administration Improves Glucose Tolerance in Diet-Induced Obese Mice

Affiliations

Filarial Infection or Antigen Administration Improves Glucose Tolerance in Diet-Induced Obese Mice

Afiat Berbudi et al. J Innate Immun. 2016.

Abstract

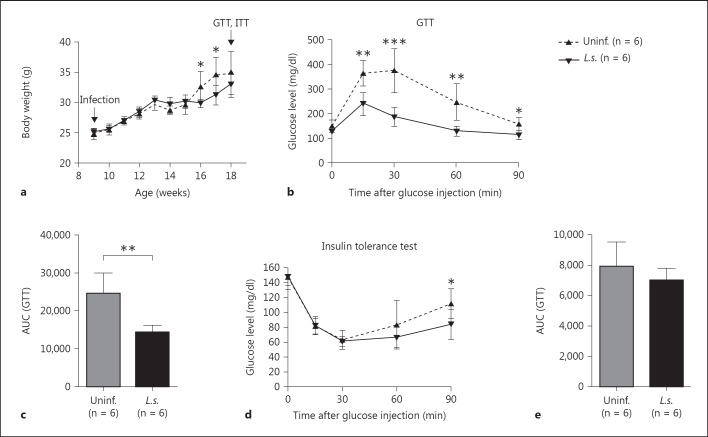
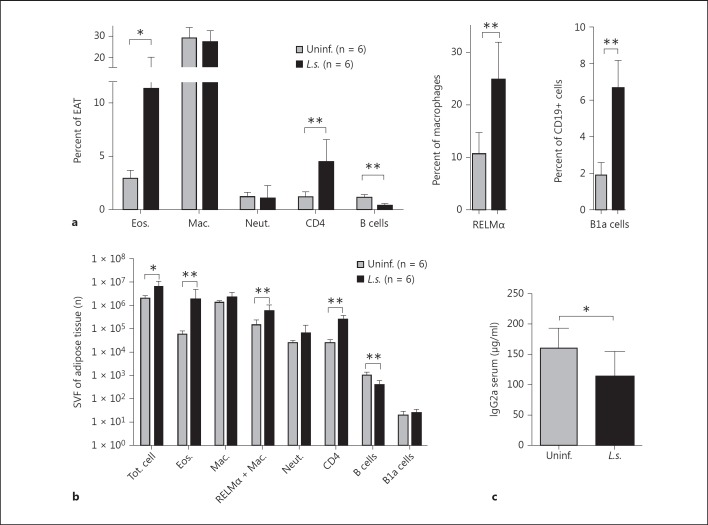
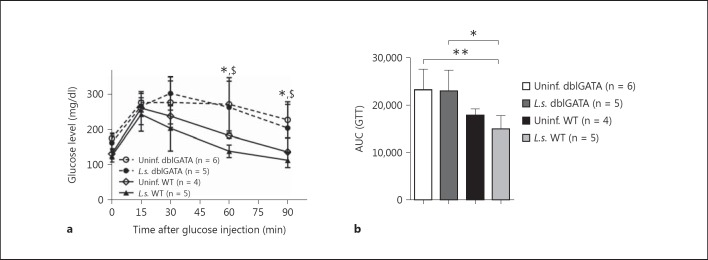
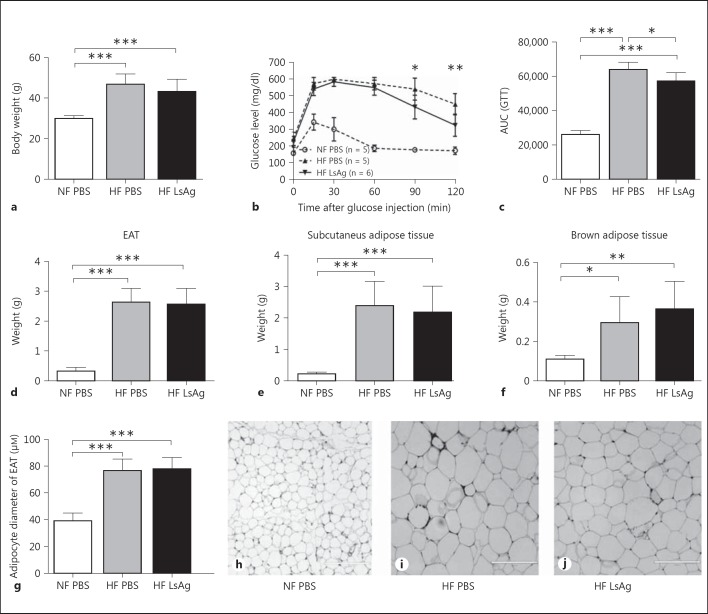
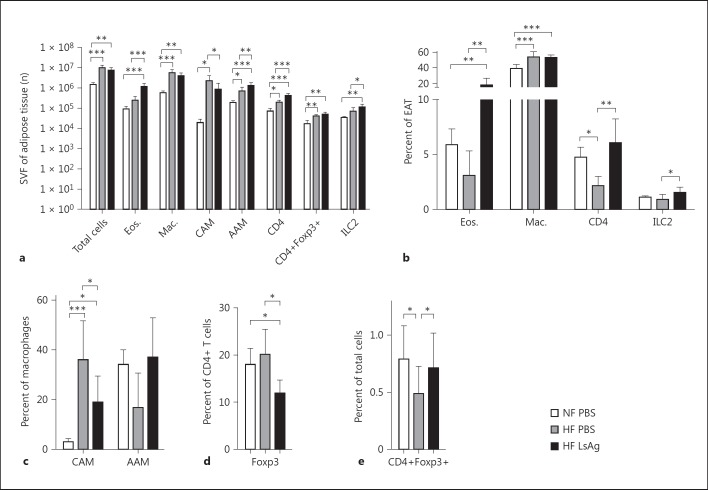
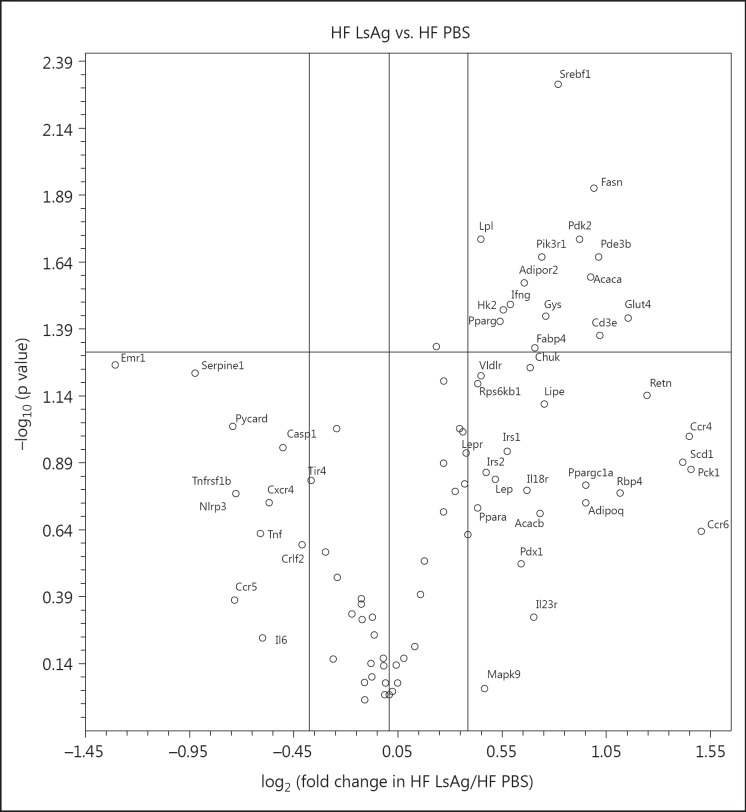
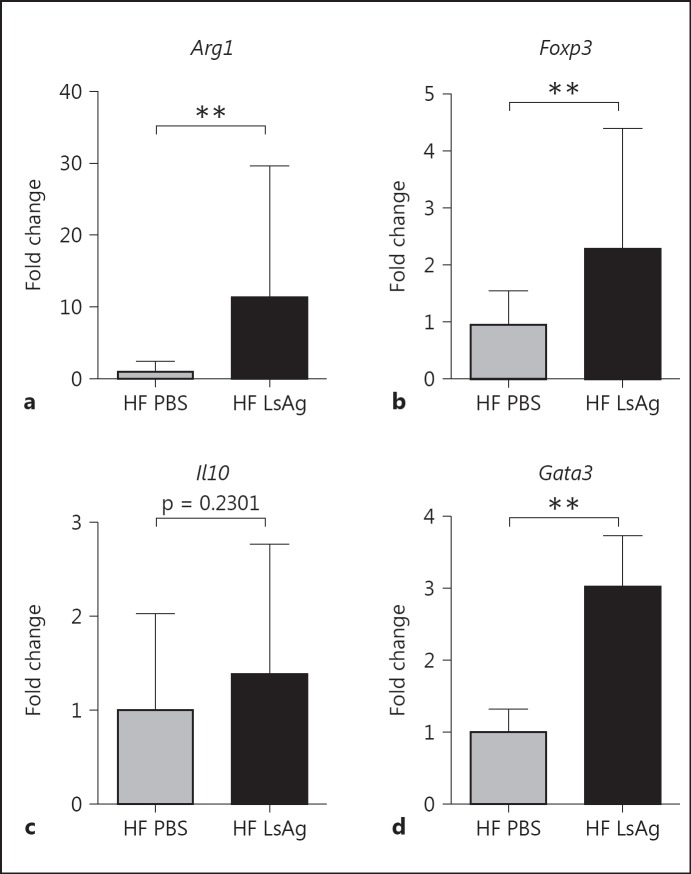
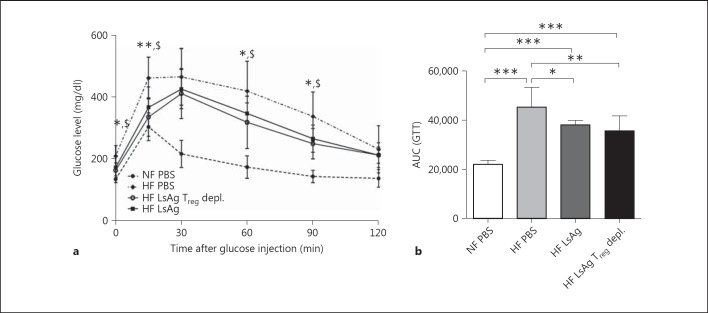
Helminths induce type 2 immune responses and establish an anti-inflammatory milieu in their hosts. This immunomodulation was previously shown to improve diet-induced insulin resistance which is linked to chronic inflammation. In the current study, we demonstrate that infection with the filarial nematode Litomosoides sigmodontis increased the eosinophil number and alternatively activated macrophage abundance within epididymal adipose tissue (EAT) and improved glucose tolerance in diet-induced obese mice in an eosinophil-dependent manner. L. sigmodontis antigen (LsAg) administration neither altered the body weight of animals nor adipose tissue mass or adipocyte size, but it triggered type 2 immune responses, eosinophils, alternatively activated macrophages, and type 2 innate lymphoid cells in EAT. Improvement in glucose tolerance by LsAg treatment remained even in the absence of Foxp3+ regulatory T cells. Furthermore, PCR array results revealed that LsAg treatment reduced inflammatory immune responses and increased the expression of genes related to insulin signaling (Glut4, Pde3b, Pik3r1, and Hk2) and fatty acid uptake (Fabp4 and Lpl). Our investigation demonstrates that L. sigmodontis infection and LsAg administration reduce diet-induced EAT inflammation and improve glucose tolerance. Helminth-derived products may, therefore, offer new options to improve insulin sensitivity, while loss of helminth infections in developing and developed countries may contribute to the recent increase in the prevalence of type 2 diabetes.


Conflict of interest statement

There are no competing financial interests.

Figures

Fig. 1
Fig. 1
L.s. infection improves glucose tolerance in DIO mice. a Body weight of L.s.-infected and control mice maintained on a 60% HF diet. b Blood glucose levels over time following intraperitoneal glucose challenge (GTT) in L.s.-infected BALB/c mice and uninfected controls after a 10-week HF diet. c AUC obtained from the GTT. d Blood glucose levels over time following intraperitoneal insulin challenge (insulin tolerance test) in L.s.-infected BALB/c mice and uninfected controls that received a HF diet for 10 weeks. e AUC obtained from the insulin tolerance test. a-e n = 6 animals/group; representative experiment of 1 in 3 independent infection studies. Means ± SD. * p < 0.05, ** p < 0.01, *** p < 0.001 (unpaired t test).
Fig. 2
Fig. 2
Increased frequencies and total numbers of eosinophils, AAMs, and CD4+ T cells and a reduction in B cells in EAT of L.s.-infected DIO mice. a Frequencies of eosinophils, macrophages, neutrophils, B cells, and CD4+ T cells within the SVF of EAT, B1a cell frequencies of B cells, and RELMα+ macrophages with the macrophage population of L.s.-infected and uninfected mice that received a HF diet for 10 weeks. b Absolute number (n) of total cells, eosinophils, macrophages, RELMα+ macrophages, neutrophils, B cells, B1a cells, and CD4+ T cells within the SVF of EAT of L.s.-infected and uninfected mice that received a HF diet for 10 weeks. c Total IgG2a serum antibody levels. a-c Representative data of 1 of 3 independent experiments with at least n = 5 animals/group. Means ± SD. * p < 0.05, ** p < 0.01 (Mann-Whitney U test).
Fig. 3
Fig. 3
L.s. infection does not improve glucose tolerance in eosinophil-deficient ΔdblGATA mice. Kinetics of blood glucose levels after intraperitoneal glucose challenge (a) and AUC (b) from the GTT in L.s.-infected and uninfected WT BALB/c as well as ΔdblGATA mice at 20 weeks of age and after 14 weeks of HF diet. * p < 0.05, $ p < 0.05, between uninfected and L.s.-infected dblGATA mice in comparison to uninfected WT controls, respectively (ANOVA followed by Newman-Keuls multiple-comparison test). Means ± SD.
Fig. 4
Fig. 4
Two weeks of daily LsAg injections improve glucose tolerance but do not affect adipose tissue weight in DIO mice. a Comparison of body weight of LsAg-treated DIO mice and PBS-treated DIO controls that received a HF diet for 14 weeks with PBS-treated mice given a standard chow diet (NF). b Blood glucose levels over time during a GTT 14 weeks after HF diet initiation. c AUC obtained from the GTT. Comparison of adipose tissue composition in PBS- and LsAg-treated animals that received a HF diet and PBS-treated controls on a chow diet: EAT weight (d), subcutaneous adipose tissue weight (e), brown adipose tissue weight (f), as well as epididymal adipocyte size (g). Representative pictures of EAT of control mice on chow diet (h), PBS-treated DIO mice (i), and LsAg-treated DIO mice (j). Bars = 200 µm. b Mann-Whitney U test. a-g Representative data of 1 of 2 independent experiments with at least n = 5 animals/group. a, c-g ANOVA followed by the Newman-Keuls multiple-comparison test. Means ± SD. * p < 0.05, ** p < 0.01, *** p < 0.001.
Fig. 5
Fig. 5
LsAg administration increases the frequency of eosinophils and AAM within EAT. a Total cell number (n) within the SVF of EAT and absolute number of eosinophils, macrophages, RELMα+ macrophages (AAM), macrophages expressing CD11c (CAM), CD4+ T cells, CD4+Foxp3+ T cells, and ILC2s within the SVF of EAT. b Frequency of eosinophils, macrophages, CD4+ T cells, and ILC2s within the SVF of EAT. c Frequencies of macrophages expressing CD11c (CAM) or RELMα (AAM) within the SVF of EAT. d Frequencies of T cells expressing Foxp3. e Frequency of CD4+Foxp3+ T cells of total cells in EAT. a-e Representative data of 1 of 2 independent experiments with at least n = 5 animals/group (single experiment for ILC2s). Means + SD. * p < 0.05, ** p < 0.01; *** p < 0.001, between the HF diet groups (Mann-Whitney U test).
Fig. 6
Fig. 6
Volcano plot representing gene expression data from individual EAT samples of DIO mice which were treated with LsAg (n = 10) and compared to PBS-treated DIO controls (n = 8). The x-axis represents the fold change, whereas the y-axis represents the p value for statistical significance (as -log10). The mid horizontal line indicates p = 0.05 with listed genes above the line having p < 0.05. The circles on the upper-right quadrant indicate genes with a fold change >1.3, the circles on the lower-left quadrant indicate genes that have a fold change <-1.3.
Fig. 7
Fig. 7
Daily LsAg administration for 2 weeks increases the expression of genes associated with type 2 immune responses in EAT of DIO mice. Gene expression of Arg1 (a), Foxp3 (b), Il10 (c), and Gata3 (d) given as fold changes after normalization to β-actin (n = 6/group). Means ± SD. ** p < 0.01 (Mann-Whitney U test).
Fig. 8
Fig. 8
LsAg-mediated glucose tolerance is independent of Foxp3+ T cells. Groups of C57BL/6 DEREG mice were placed on a HF diet for 14 weeks. During weeks 8 and 10 and 12 and 14, groups of mice were given LsAg injections (2 µg/day) or PBS. Three days before the GTT, one group of LsAg-treated DEREG mice on a HF diet was depleted of Foxp3+ T cells through diphtheria toxin injection. a Blood glucose levels were measured over time during a GTT. Means ± SD in each group: NF PBS n = 4; HF PBS n = 8; HF LsAg Treg depleted n = 9 and HF LsAg n = 6. *, $ Statistically significant differences between LsAg-treated WT and DEREG DIO mice in comparison to PBS WT DIO controls, respectively. * p < 0.05, ** p < 0.01 (ANOVA). b AUC obtained from the GTT. Means ± SD. ANOVA followed by Newman-Keuls multiple-comparison test. * p < 0.05, ** p < 0.01, *** p < 0.001.

References

    1. International Diabetes Federation IDF Diabetes Atlas, ed 6, 2014. Brussels, International Diabetes Federation. 2014 http://www.idf.org/sites/default/files/Atlas-poster-2014_EN.pdf.
    1. Cipolletta D, Kolodin D, Benoist C, Mathis D. Tissular T(regs): a unique population of adipose-tissue-resident Foxp3+CD4+ T cells that impacts organismal metabolism. Semin Immunol. 2011;23:431–437. - PubMed
    1. Wu D, Molofsky AB, Liang H-E, Ricardo-Gonzalez RR, Jouihan HA, Bando JK, Chawla A, Locksley RM. Eosinophils sustain adipose alternatively activated macrophages associated with glucose homeostasis. Science. 2011;332:243–247. - PMC - PubMed
    1. Molofsky AB, Nussbaum JC, Liang H, Van Dyken SJ, Cheng LE, Mohapatra A, et al. Innate lymphoid type 2 cells sustain visceral adipose tissue eosinophils and alternatively activated macrophages. J Exp Med. 2013;210:535–549. - PMC - PubMed
    1. Winer DA, Winer S, Shen L, Wadia PP, Yantha J, Paltser G, et al. B cells promote insulin resistance through modulation of T cells and production of pathogenic IgG antibodies. Nat Med. 2011;17:610–617. - PMC - PubMed

Publication types

MeSH terms

Substances