Controlled Clinical Trial
. 2016 Sep;9(9):1087-1095.
doi: 10.1016/j.jcmg.2016.01.034. Epub 2016 Aug 17.

Targeted Near-Infrared Fluorescence Imaging of Atherosclerosis: Clinical and Intracoronary Evaluation of Indocyanine Green

Affiliations
Controlled Clinical Trial

Targeted Near-Infrared Fluorescence Imaging of Atherosclerosis: Clinical and Intracoronary Evaluation of Indocyanine Green

Johan W Verjans et al. JACC Cardiovasc Imaging. 2016 Sep.

Abstract

Objectives: This study sought to determine whether indocyanine green (ICG)-enhanced near-infrared fluorescence (NIRF) imaging can illuminate high-risk histologic plaque features of human carotid atherosclerosis, and in coronary atheroma of living swine, using intravascular NIRF-optical coherence tomography (OCT) imaging.

Background: New translatable imaging approaches are needed to identify high-risk biological signatures of atheroma. ICG is a U.S. Food and Drug Administration-approved NIRF imaging agent that experimentally targets plaque macrophages and lipid in areas of enhanced endothelial permeability. However, it is unknown whether ICG can target atheroma in patients.

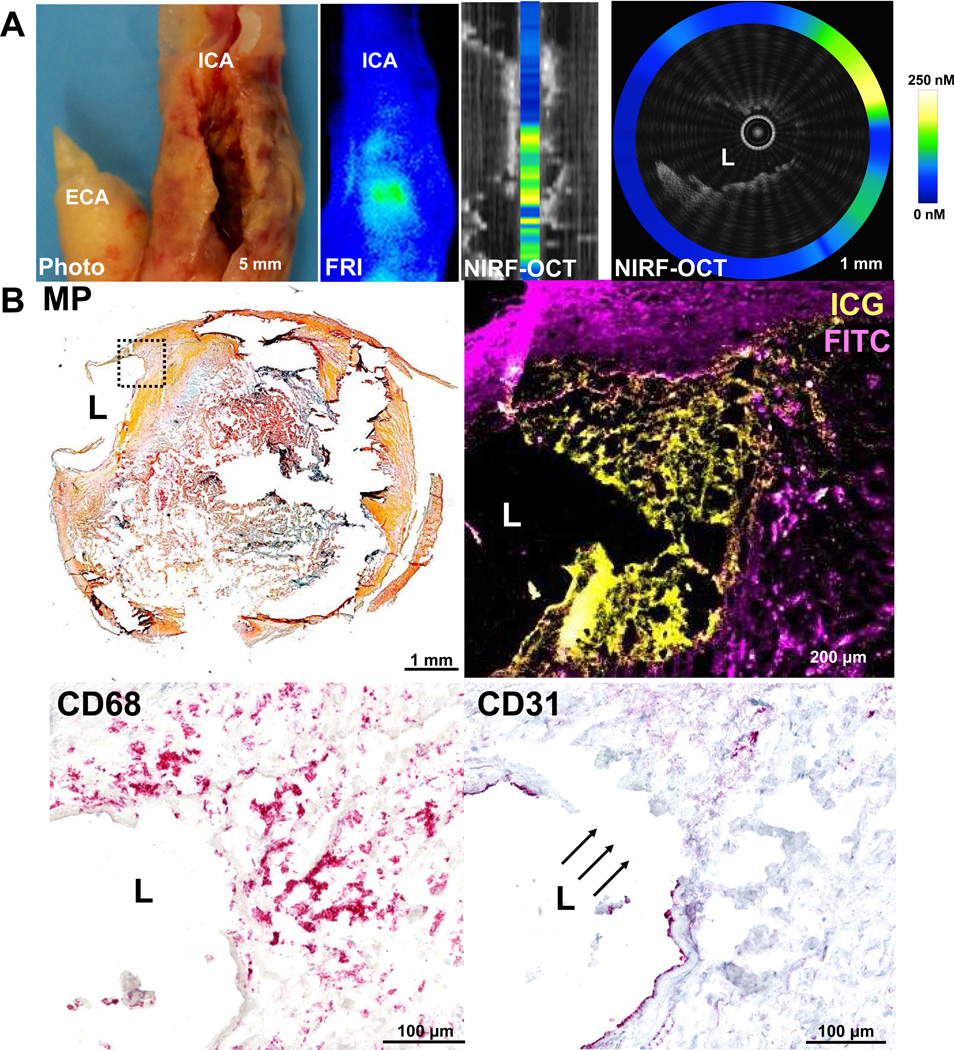
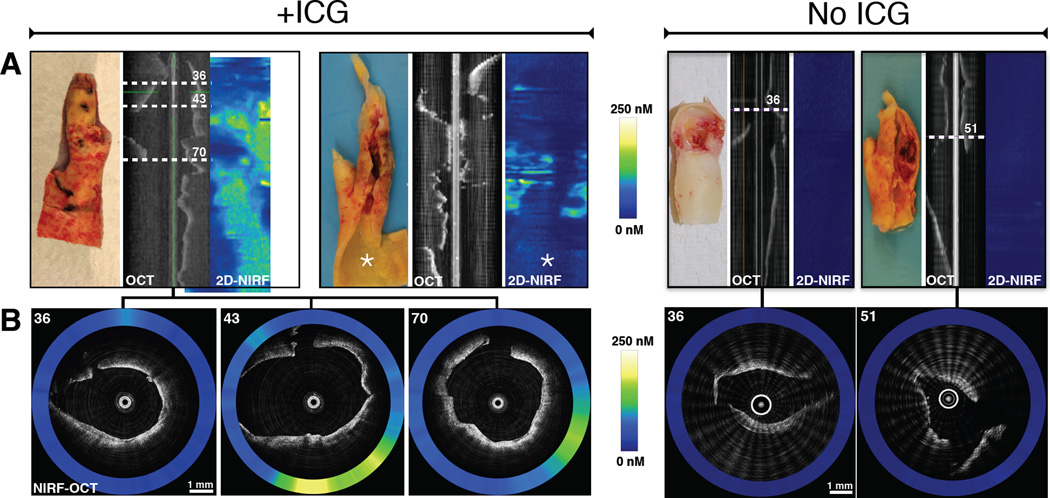
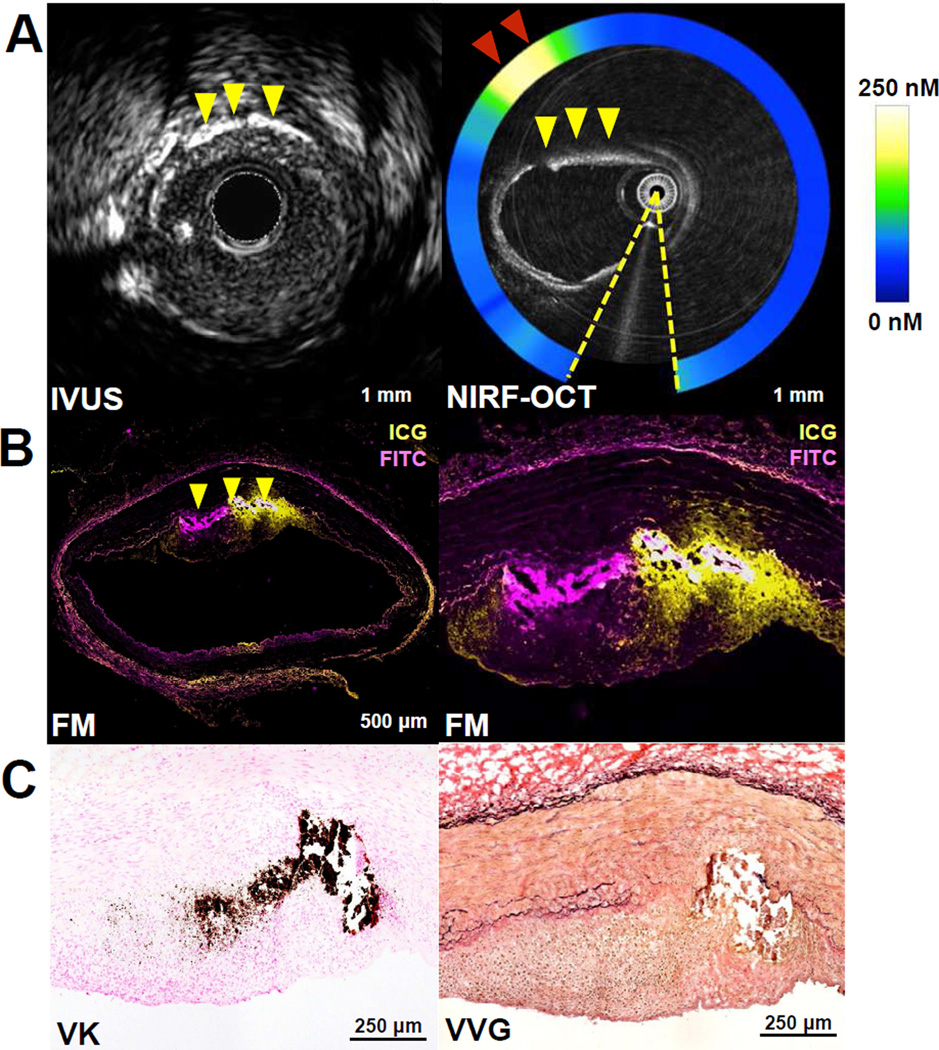
Methods: Eight patients were enrolled in the BRIGHT-CEA (Indocyanine Green Fluorescence Uptake in Human Carotid Artery Plaque) trial. Five patients were injected intravenously with ICG 99 ± 25 min before clinically indicated carotid endarterectomy. Three saline-injected endarterectomy patients served as control subjects. Excised plaques underwent analysis by intravascular NIRF-OCT, reflectance imaging, microscopy, and histopathology. Next, following ICG intravenous injection, in vivo intracoronary NIRF-OCT and intravascular ultrasound imaged 3 atheroma-bearing coronary arteries of a diabetic, cholesterol-fed swine.

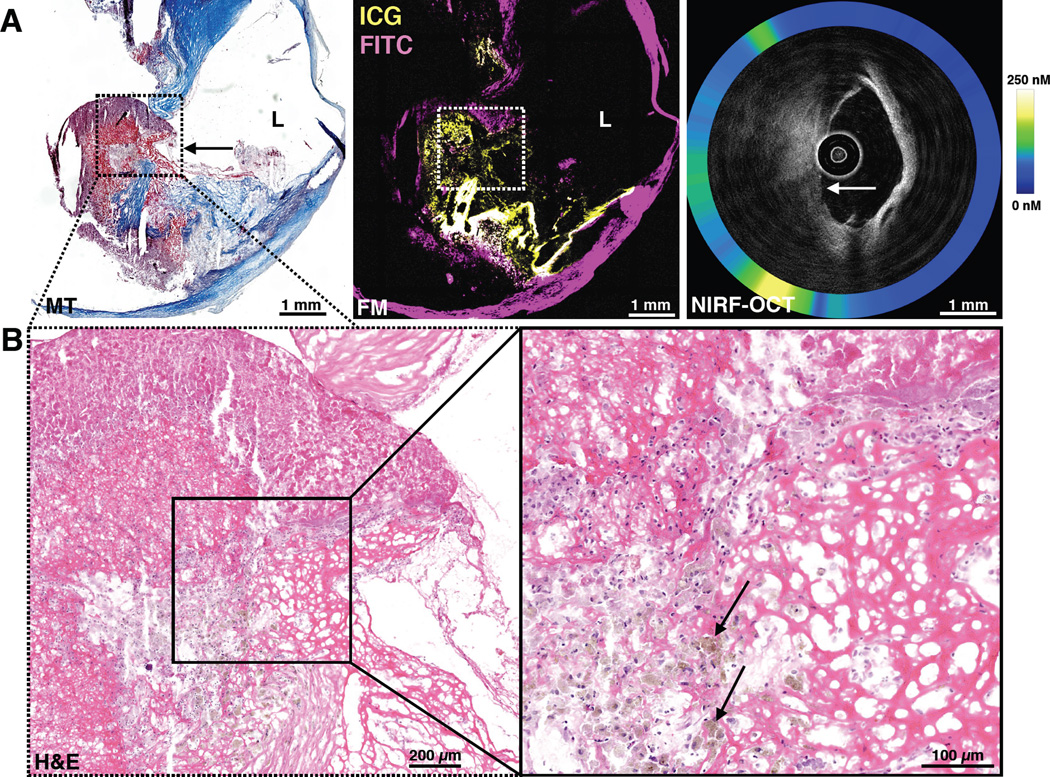
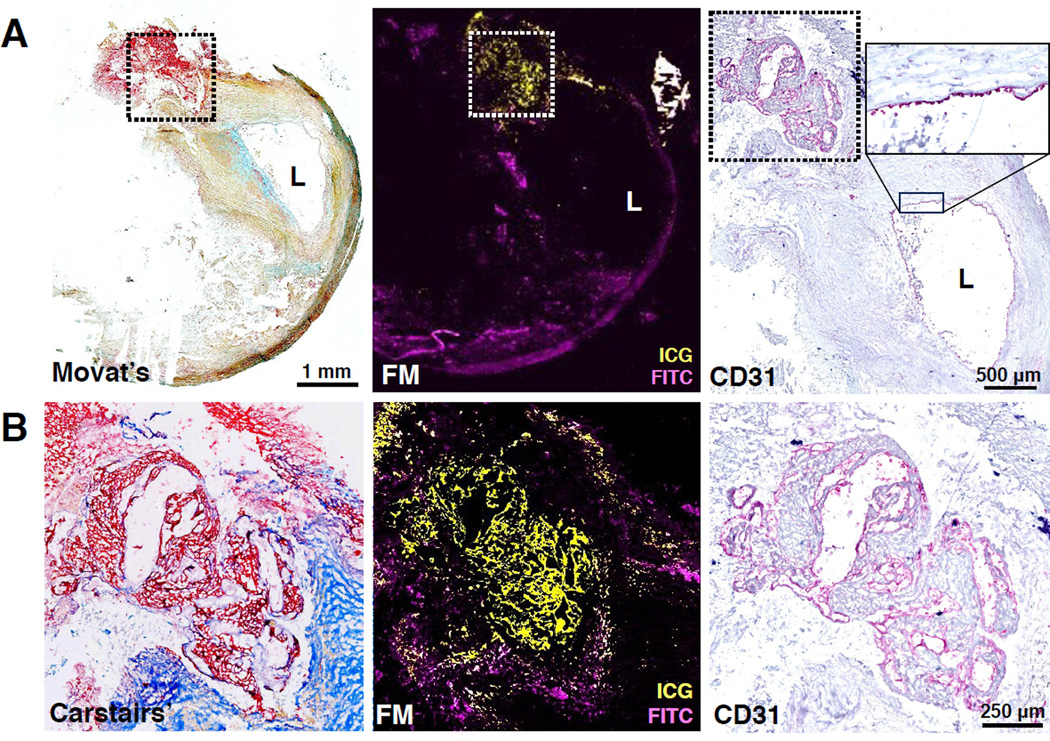
Results: ICG was well tolerated; no adverse clinical events occurred up to 30 days post-injection. Multimodal NIRF imaging including intravascular NIRF-OCT revealed that ICG accumulated in all endarterectomy specimens. Plaques from saline-injected control patients exhibited minimal NIRF signal. In the swine experiment, intracoronary NIRF-OCT identified ICG uptake in all intravascular ultrasound-identified plaques in vivo. On detailed microscopic evaluation, ICG localized to plaque areas exhibiting impaired endothelial integrity, including disrupted fibrous caps, and within areas of neovascularization. Within human plaque areas of endothelial abnormality, ICG was spatially related to localized zones of plaque macrophages and lipid, and, notably, intraplaque hemorrhage.

Conclusions: This study demonstrates that ICG targets human plaques exhibiting endothelial abnormalities and provides new insights into its targeting mechanisms in clinical and experimental atheroma. Intracoronary NIRF-OCT of ICG may offer a novel, clinically translatable approach to image pathobiological aspects of coronary atherosclerosis. (Indocyanine Green Fluorescence Uptake in Human Carotid Artery Plaque [BRIGHT-CEA]; NCT01873716).

Keywords: atherosclerosis; endothelium; indocyanine green; inflammation; intraplaque hemorrhage; intravascular imaging; lipid; molecular imaging; near-infrared fluorescence.


Figures

Figure 1
Figure 1. ICG targets human carotid atherosclerosis in vivo in areas of endothelial discontinuity, and NIRF imaging can detect ICG deposition
ICG was intravenously injected ~1.5 hours before harvest of a representative carotid endarterectomy specimen. (A) Photograph and corresponding near-infrared fluorescence reflectance image (FRI), demonstrating similar morphology and corresponding ICG uptake pattern (light blue=low ICG signal; green-yellow=high ICG signal) at the stenotic region (white arrowheads) in the internal carotid artery (ICA). The upper row middle right image shows an intravascular NIRF-OCT longitudinal fusion image that is anatomically co-registered with the FRI image. The vertical bar inside the lumen in this image depicts the average NIRF signal per cross section. The upper right panel shows a NIRF-OCT cross-sectional fusion image at the area along the white dashed line on the FRI and NIRF-OCT longitudinal fusion images. OCT displays decreased signal intensity at the plaque surface, consistent with a thinned or absent fibrous cap (white dotted box). In this area of diminished OCT signal, increased NIRF signal is evident, represented by the color-scaled circle. (B) Histological analysis of the same area of the cross-sectional image shown in the right image of row A. Movat’s pentachrome (MP) reveals a complex atherosclerotic plaque with a large necrotic core with lipid and cellular infiltration (dotted box). Higher magnification (10×) fluorescence microscopy of the boxed area reveals ICG NIRF signal adjacent to the lumen, which is distinct from FITC-channel autofluorescence. CD68 staining of this same area demonstrates that the ICG NIRF signal (yellow pseudocolor) spatially relates to CD68-defined plaque macrophages beneath the area of intimal disruption. The disruption is confirmed by CD31 staining in this same area. ECA=external carotid artery, FITC=fluorescein isothiocyanate, H&E=Hematoxylin=nuclei (blue), MP=Movat’s Pentachrome, Eosin=eosinophilic structures (pink/red), L=lumen.
Figure 2
Figure 2. Additional representative ex vivo NIRF imaging examples of two carotid plaques after ICG injection, and two control plaques without ICG
(A) From left-to-right, gross photograph, aligned OCT longitudinal image and 2D NIRF map (horizontal axis = 0 to 360°, vertical axis = catheter pullback distance), respectively, of two plaques from ICG-injected patients (+ICG) and two control plaques (No ICG). Pullbacks were performed with the NIRF-OCT catheter positioned within the lumen of the resected carotid artery specimens. (B) Representative simultaneously acquired and co-registered NIRF-OCT cross-sectional fusion images from ICG-injected subjects shown on the left panel of images in A. NIRF-OCT demonstrates areas of elevated ICG signal localization within each internal carotid artery plaque (left panel in B, axial white dotted line slices 36, 43, and 70 in the OCT image in A). The right panels in B show two axial NIRF-OCT images from saline-injected control plaques (white dotted lines 36 and 51) that reveal minimal near-infrared autofluorescence signal. The quantitative NIRF scale bars shown (0–250 nM) apply identically to all NIRF images from panels A and B.
Figure 3
Figure 3. ICG deposits directly beneath an area of subclinical carotid plaque rupture with endothelial discontinuity and atherothrombosis (estimated 1–2 weeks old)
(A) Low-magnification Masson's trichrome (MT) and fluorescence microscopy (purple=FITC-channel autofluorescence, yellow=ICG). The MT stain demonstrates frank plaque rupture (disruption of blue collagen fibers, black arrows) and protrusion of the necrotic core into the lumen. An adjacent FM section (middle image) reveals strong ICG co-localization deposition (yellow) in the region of plaque rupture. The anatomically co-registered NIRF-OCT fusion image (right image) demonstrates high ICG signal by NIRF and plaque surface irregularity by OCT in the regions corresponding to the histological plaque rupture zone (white arrow; quantitative NIRF scale bar 0–250 nM). (B) Low and high magnification H&E staining demonstrated evidence of brown pigment, consistent with hemosiderin within macrophages (arrows) and areas with fibrin. These features indicate that plaque rupture with atherothrombosis occurred subacutely, rather than acute plaque hemorrhage as a direct consequence of surgery.
Figure 4
Figure 4. ICG deposits in areas of intraplaque hemorrhage (IPH) in a human atheroma
(A) Low magnification Movat’s pentachrome staining and FM (purple=FITC-channel autofluorescence, yellow=ICG) reveal strong ICG uptake at a location of plaque hemorrhage beneath the highly stenotic plaque lumen (L), that was clearly demarcated by CD31 (right top, high magnification box). (B) Higher magnification (5×) FM of the dashed box area in A) demonstrates a large circumscribed zone of ICG-positive signal that colocalizes with intraplaque hemorrhage (Carstairs’ fibrin staining, red) and CD31 staining demonstrates that neovessels are present in the area of intraplaque hemorrhage, offering a potential pathway for ICG extravasation.
Figure 5
Figure 5. Intracoronary NIRF-OCT and histological assessment of ICG deposition in swine atherosclerosis
(A) Co-registered IVUS and NIRF-OCT cross-sectional fusion images in the left anterior descending artery, with NIRF signal detecting up to 250nM of ICG (red arrowheads denote high ICG NIRF signal (yellow/white color at 10 o’clock). Coronary atheroma demonstrates heterogeneous ICG plaque uptake in a lesion with intimal and medial calcification (yellow arrowheads). The plaque morphology and calcified region allowed precise co-registration among IVUS, NIRF-OCT, and histology. Artifact from the intracoronary guidewire (dashed yellow lines, NIRF-OCT) was excluded from the NIRF signal ring, OCT catheter dimensions: inner bright circle, 0.5mm diameter; outer faint circle, 0.8mm diameter. (B) Fluorescence microscopy (FM; purple=FITC-channel autofluorescence, yellow=ICG) and histological assessment of the calcified coronary atheroma in panel A. Low and high magnification FM (2nd row, left) shows ICG plaque uptake in the same region of the plaque with calcification (yellow arrowheads). (C) von Kossa calcification stain (VK, dark brown) and Verhoeff-Van Gieson (VVG) stain) confirm the OCT and IVUS images by demonstrating that the calcium resides within the deep intima at the medial border.

Comment in

  • Going Green for Vulnerable Plaque Detection?
    Wilensky RL, Saybolt MD. Wilensky RL, et al. JACC Cardiovasc Imaging. 2016 Sep;9(9):1096-1098. doi: 10.1016/j.jcmg.2016.02.032. Epub 2016 Aug 17. JACC Cardiovasc Imaging. 2016. PMID: 27544891 No abstract available.

Similar articles

Cited by

References

    1. Jaffer FA, Calfon MA, Rosenthal A, et al. Two-dimensional intravascular near-infrared fluorescence molecular imaging of inflammation in atherosclerosis and stent-induced vascular injury. J Am Coll Cardiol. 2011;57:2516–2526. - PMC - PubMed
    1. Mulder WJ, Jaffer FA, Fayad ZA, Nahrendorf M. Imaging and nanomedicine in inflammatory atherosclerosis. Sci Transl Med. 2014;6:239sr1. - PMC - PubMed
    1. Yoo H, Kim JW, Shishkov M, et al. Intra-arterial catheter for simultaneous microstructural and molecular imaging in vivo. Nat Med. 2011;17:1680–1684. - PMC - PubMed
    1. Hope-Ross M, Yannuzzi LA, Gragoudas ES, et al. Adverse reactions due to indocyanine green. Ophthalmology. 1994;101:529–533. - PubMed
    1. Vinegoni C, Botnaru I, Aikawa E, et al. Indocyanine green enables near-infrared fluorescence imaging of lipid-rich, inflamed atherosclerotic plaques. Sci Transl Med. 2011;3:84ra45. - PMC - PubMed

Publication types

MeSH terms

Associated data