. 2016 Sep 14;20(3):368-380.
doi: 10.1016/j.chom.2016.07.015. Epub 2016 Aug 18.

Single-Cell Characterization of Viral Translation-Competent Reservoirs in HIV-Infected Individuals

Affiliations

Single-Cell Characterization of Viral Translation-Competent Reservoirs in HIV-Infected Individuals

Amy E Baxter et al. Cell Host Microbe. .

Abstract

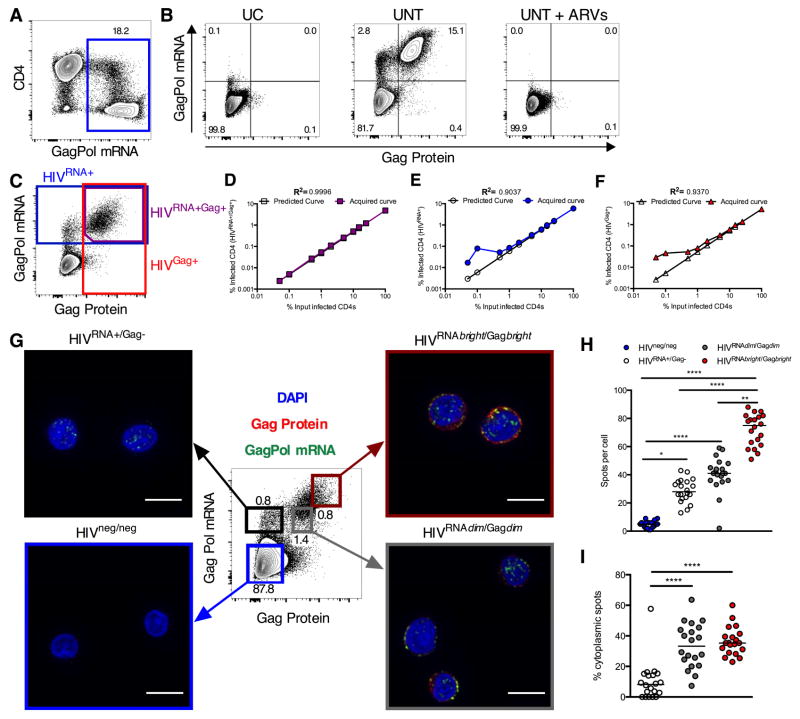
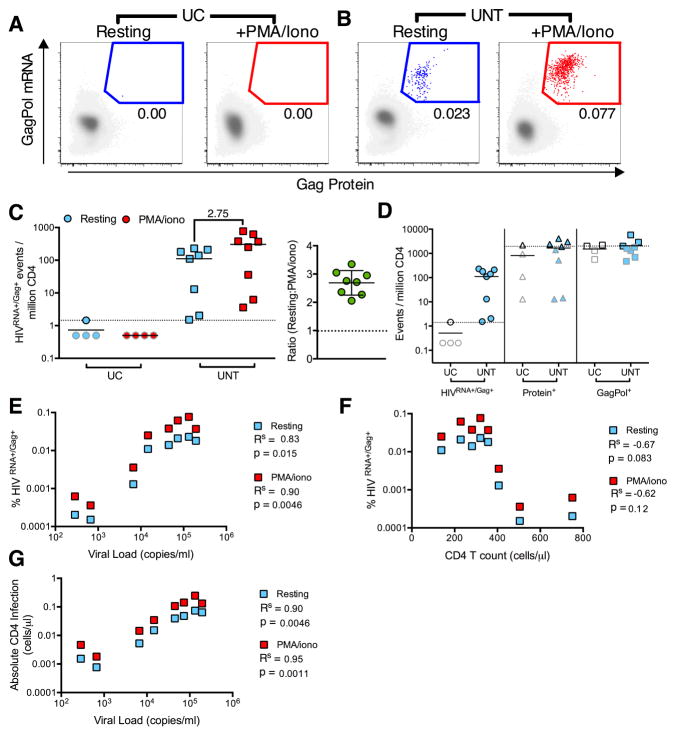
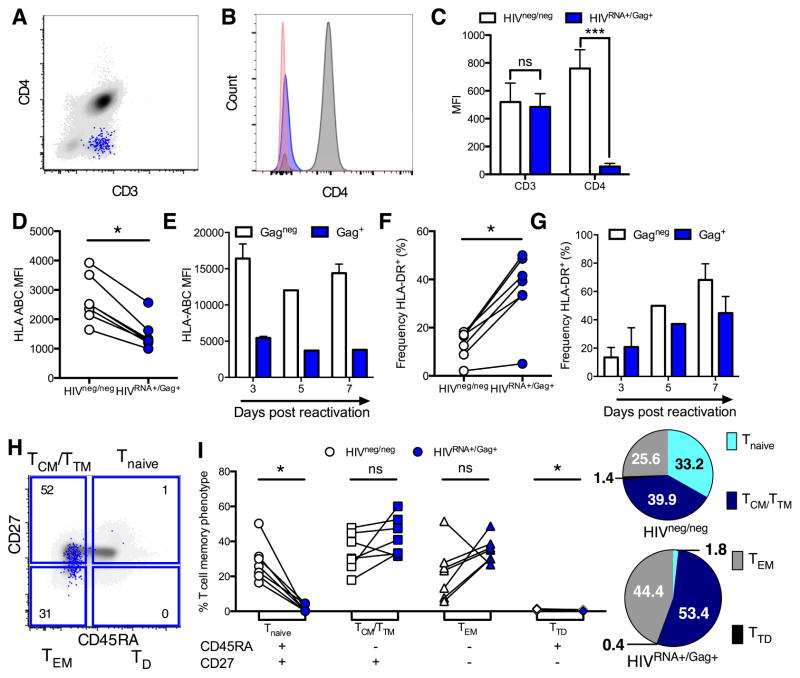
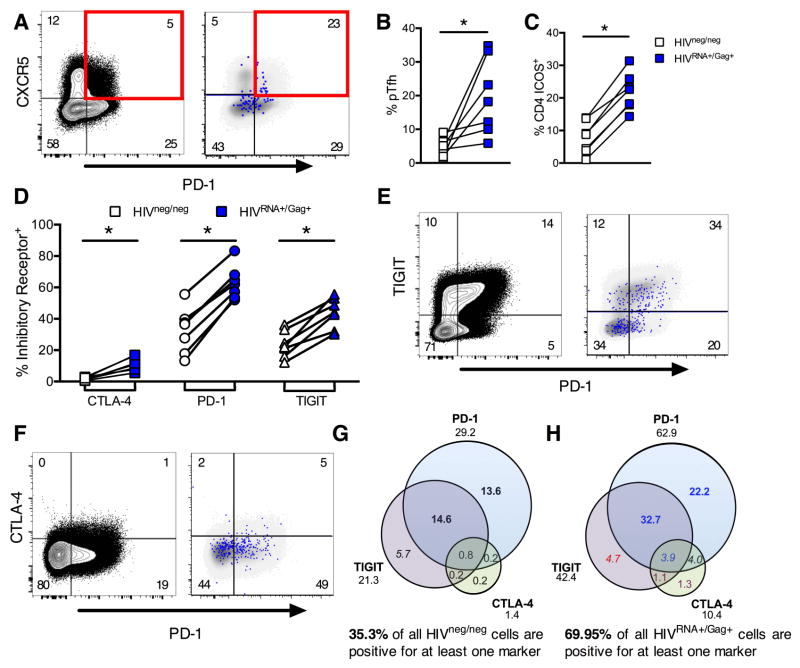
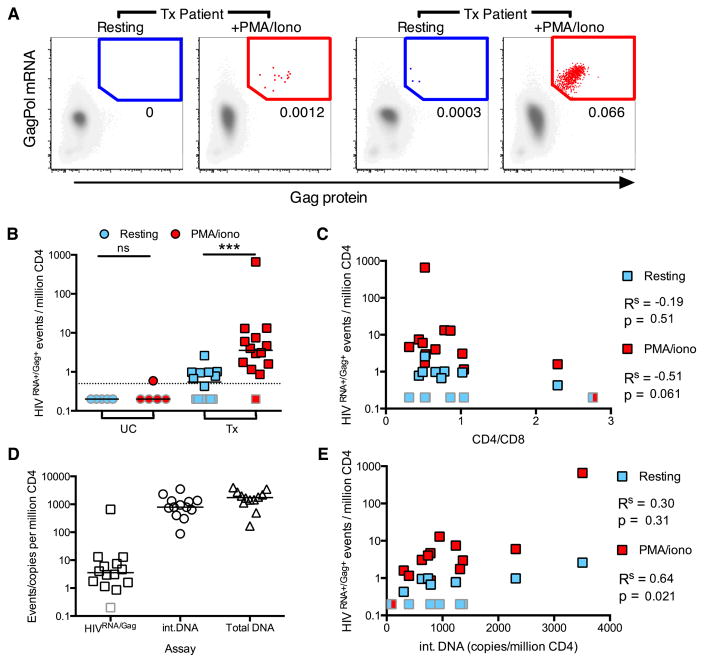
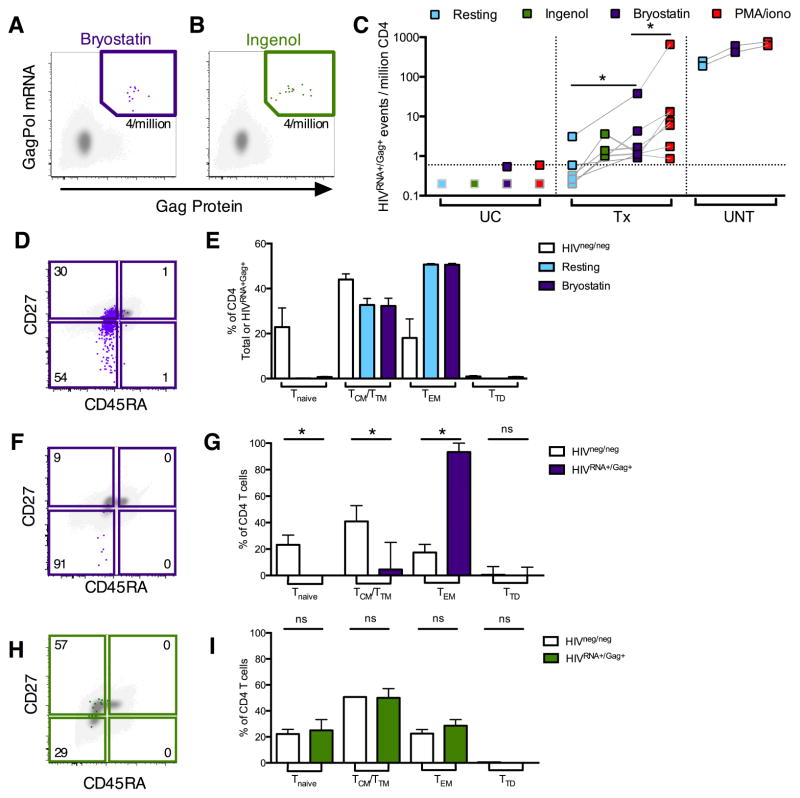
HIV cure efforts are hampered by limited characterization of the cells supporting HIV replication in vivo and inadequate methods for quantifying the latent viral reservoir in patients receiving antiretroviral therapy. We combine fluorescent in situ RNA hybridization with detection of HIV protein and flow cytometry, enabling detection of 0.5-1 gag-pol mRNA(+)/Gag protein(+)-infected cells per million. In the peripheral blood of untreated persons, active HIV replication correlated with viremia and occurred in CD4 T cells expressing T follicular helper cell markers and inhibitory co-receptors. In virally suppressed subjects, the approach identified latently infected cells capable of producing HIV mRNA and protein after stimulation with PMA/ionomycin and latency-reversing agents (LRAs). While ingenol-induced reactivation mirrored the effector and central/transitional memory CD4 T cell contribution to the pool of integrated HIV DNA, bryostatin-induced reactivation occurred predominantly in cells expressing effector memory markers. This indicates that CD4 T cell differentiation status differentially affects LRA effectiveness.


Conflict of interest statement

The authors have no conflicts of interest to report.

Figures

Figure 1
Figure 1. Dual staining for mRNA and protein allows highly sensitive, flow based detection and microscopy analysis of HIV-infected CD4
Peripheral CD4 from HIV-1-infected patients were activated in vitro and a spreading infection with endogenous virus established. (A) Example plot showing GagPol mRNA staining. (B) Example concurrent Gag protein and GagPol mRNA staining for an uninfected control (UC); a viremic patient (UNT) or UNT CD4 cultured with ARVs (UNT + ARVs). (C–F) HIV-infected CD4 were “spiked” into uninfected CD4 at different ratios. (C) Example gating of CD4 expressing GagPol mRNA and protein (purple), GagPol mRNA (blue) or Gag protein (red). Quantification of predicted (clear symbols) vs acquired result (colored symbols) using (D) double mRNA and protein expression, or single (E) mRNA or (F) protein stain. R2 calculated on log-transformed data. (G–I) Reactivated, HIV-infected CD4 were sorted into four populations based on Gag protein and GagPol mRNA expression (indicated by colored boxes (G)) and imaged by confocal microscopy. In example images from sorted populations DAPI is in blue, GagPol mRNA in green and Gag protein in red. Scale bars represent 10μm. (H and I) GagPol mRNA spot analysis for sorted populations from (G). (H) GagPol mRNA spots per cell in sorted populations. (I) Frequency of cytoplasmic mRNA spots. Each symbol represents a cell. n=20 cells, representative data from one donor. *p<0.05, **p<0.01, ***p<0.001 by Kruskal-Wallis ANOVA with Dunn’s post-test. See also Figures S1, S2 and S3, Table S1 and Movies S1 and S2.
Figure 2
Figure 2. Detection of CD4 T cells supporting ongoing and activation-inducible HIV infection in viremic patients
HIVRNA+/Gag+ CD4 were detected in uninfected controls (UC) or viremic patients (UNT) directly ex vivo (resting, blue symbols) or following 12 hr stimulation (PMA/iono, red symbols). (A and B) Example plots and gating of HIVRNA+Gag+ CD4 for an UC (A) and an UNT (B). HIVRNA+/Gag+ events in red/blue are overlaid onto HIVneg/neg events in gray. (C and D) Quantification of data in (AB), shown as HIVRNA+/Gag+ events per million CD4 (n= 4 UC, 8 UNT). On right, the fold change in frequency of HIVRNA+Gag+ CD4 in resting vs stimulated infection is shown. n= 8 UNT. (D) Data as in (C) for unstimulated, resting CD4, except gated using only protein (Protein+) or mRNA (GagPol+) staining, compared to HIVRNA+/Gag+ staining. Limit of detection (LOD) based on frequency of UC false positive events is indicated with a dotted line. Grey-bordered symbols are below LOD. (E–G) Correlations of resting or stimulated infection with patient characteristics, (E) viral load (F) CD4 count or (G) absolute number of infected CD4 (CD4 count (cells/μl) × % HIVRNA+/Gag+). Rs represents Spearman’s non-parametric correlation with associated p values where p<0.05 is significant. See also Figure S4 and Table S2.
Figure 3
Figure 3. Dissociated expression patterns of CD4 co-receptors and memory phenotype of CD4 cells maintaining ongoing infection in viremic individuals
Peripheral CD4 from viremic, untreated (UNT) patients were analyzed directly ex vivo without stimulation for phenotype. White symbols/bars represent HIVneg/neg CD4 and blue represents HIVRNA+/Gag+ CD4 from the same patient sample. (A–C) HIVRNA+/Gag+ T cells downregulate CD4. (A) Example plot overlaying HIVRNA+/Gag+ (blue) onto HIVneg/neg (gray) CD4. (B) Histogram of staining in (A) with negative control (red). (C) Quantification of results in (A and B). n=5 UNT. ***p<0.001 by Friedman ANOVA with Dunn’s post-test. (D–G) HLA-ABC expression (D and E) and HLA-DR+ frequency (F and G) on HIV-infected vs uninfected CD4. For D and F infected cells were defined by dual mRNA/protein stain on unstimulated UNT CD4 analyzed directly ex vivo. For E and G infected CD4 were defined by standard Gag protein staining only at time points post-reactivation for an endogenous, spreading infection. (H and I) Comparison of memory phenotype between HIVRNA+/Gag+ CD4 in UNT compared to HIVneg/neg CD4. (H) Example plot and gating with HIVRNA+/Gag+ CD4 (blue) overlaid onto total T cell population (grey). Numbers represent frequency of HIVRNA+/Gag+ CD4 with specific phenotype. (I) Quantification of data in (H). Numbers shown in pie charts represent normalized mean. n=7 UNT, except in (E and G) where n=2. ns signifies p>0.05, *p<0.05 by Wilcoxon signed rank test. See also Figure S5.
Figure 4
Figure 4. CD4 T cells maintaining ongoing replication during viremia show markers of activation, exhaustion and peripheral T follicular helper cells
Peripheral CD4 from viremic patients (UNT) were analyzed without stimulation for phenotype directly ex vivo. For example plots in A, E and F, left hand panel shows gating on total CD4 T cells with frequencies of each population indicated. Right hand panel shows HIVRNA+/Gag+ CD4 events in blue, overlaid onto HIVneg/neg events (gray) for the same markers. Frequencies shown represent the HIVRNA+/Gag+ population. (A) Example plots of pTfh phenotype (pre-gated on CD45RA-memory CD4). (B) Quantification of results in (A), shown as frequency of memory CD4. (C) Frequency of ICOS expression on HIVRNA+/Gag+ versus HIVneg/neg CD4. (D) Relative expression of coinhibitory receptors CTLA-4, PD-1 and TIGIT on HIVRNA+/Gag+ compared to HIVneg/neg CD4. (E and F) Example plots of coexpression; TIGIT and PD-1 (E), CTLA-4 and PD-1 (F). (G and H) Boolean analysis of inhibitory receptor coexpression on HIVneg/neg (G) vs HIVRNA+/Gag+ (H) CD4 from the same patients. Numbers under inhibitory receptor name indicate total frequency of positive events (e.g. all PD-1+) and correspond to data in (EF). Red text indicates populations under represented in HIVRNA+Gag+ versus HIVneg/neg. Populations enriched in HIVRNA+Gag+ by 1–5-fold are blue, 5–10 fold (purple) or over 10 fold (black). Populations contributing more than 2 or 10% are in italics or bold respectively. Data represent medians. n=7 UNT. *p<0.05 by Wilcoxon signed rank test. See also Figure S5.
Figure 5
Figure 5. Detection of latently HIV-infected CD4 T cells from ART-treated patients
Peripheral HIVRNA+Gag+ CD4 were detected in treated, aviremic patients (Tx) directly ex vivo (resting, light blue), or following stimulation (PMA/iono, red). (A) Example plots of a representative patient (left) or a patient with a large inducible reservoir (right). (B) Quantification of data in (A) for Tx and uninfected controls (UC). Dotted line represents limit of detection (LOD). ns signifies p>0.05, ***p<0.001 by Wilcoxon signed rank test. (C) Correlation between reactivation and CD4/CD8 T cell ratio. Where result is the same between two conditions, a split box is shown. (D) Comparison of reservoir measured by different techniques; HIVRNA/Gag assay (with PMA/iono stimulation, data as in (B)), integrated HIV DNA PCR (int.DNA) and total HIV DNA PCR. Line shown at median. (E) Correlation between reservoir as measured by integrated DNA and HIVRNA/Gag assays. Gray bordered symbols are below LOD. In all experiments, n=5 UC and 14 Tx (13 for Figure 5D and E). Statistics shown are Spearman’s correlation coefficient (Rs) with associated p values. See also Figure S6 and Tables S3 and S4.
Figure 6
Figure 6. Quantification and phenotyping of LRA-reactivated infected CD4 cells in patients on or off ART
HIVRNA+/Gag+ CD4 from UC, UNT or Tx patients were detected directly ex vivo (resting, light blue symbols/bars), or following reactivation with ingenol (green), bryostatin (purple) or PMA/iono (red). In example plots, reactivated HIVRNA+/Gag+ events (green/purple) are overlaid onto HIVneg/neg events (gray). Frequencies of HIVRNA+/Gag+ CD4 are indicated in each gate. (AB) Example plots for Tx patients following bryostatin (A) or ingenol reactivation (B). (C) Summary data of HIVRNA+/Gag+ CD4 frequencies in unstimulated vs stimulated CD4. n=4 UC, 2 UNT and 3–7 Tx. Dotted line indicates LOD. Grey-bordered symbols are below LOD. (D) Example plot showing memory phenotype of bryostatin-reactivated HIVRNA+/Gag+ CD4 for an example UNT. (E) Quantification of data in (D) for n=2 UNT, comparing HIVneg/neg with HIVRNA+/Gag+ CD4, unstimulated or after bryostatin stimulation. HIVneg/neg CD4 are shown in white. Bars= mean±SEM. (F) Example plot showing memory phenotype of bryostatin-reactivated HIVRNA+/Gag+ CD4 for a Tx patient. (G) Quantification of data in (F). n=7 Tx. (H) Example plot showing memory phenotype of ingenol-reactivated HIVRNA+/Gag+ CD4 for a Tx patient. (I) Quantification of data in (H). n=3 Tx patients. ns indicates p>0.05, *p<0.05 by Wilcoxon signed rank test. For G+I bars= median±interquartile range. See also Figure S6 and Table S3.

Comment in

References

    1. Archin NM, Liberty AL, Kashuba AD, Choudhary SK, Kuruc JD, Crooks AM, Parker DC, Anderson EM, Kearney MF, Strain MC, et al. Administration of vorinostat disrupts HIV-1 latency in patients on antiretroviral therapy. Nature. 2012;487:482–485. - PMC - PubMed
    1. Arganaraz ER, Schindler M, Kirchhoff F, Cortes MJ, Lama J. Enhanced CD4 down-modulation by late stage HIV-1 nef alleles is associated with increased Env incorporation and viral replication. J Biol Chem. 2003;278:33912–33919. - PubMed
    1. Bagnarelli P, Valenza A, Menzo S, Sampaolesi R, Varaldo PE, Butini L, Montroni M, Perno CF, Aquaro S, Mathez D, et al. Dynamics and modulation of human immunodeficiency virus type 1 transcripts in vitro and in vivo. J Virol. 1996;70:7603–7613. - PMC - PubMed
    1. Banga R, Procopio FA, Noto A, Pollakis G, Cavassini M, Ohmiti K, Corpataux JM, de Leval L, Pantaleo G, Perreau M. PD-1 and follicular helper T cells are responsible for persistent HIV-1 transcription in treated aviremic individuals. Nat Med 2016 - PubMed
    1. Brenchley JM, Hill BJ, Ambrozak DR, Price DA, Guenaga FJ, Casazza JP, Kuruppu J, Yazdani J, Migueles SA, Connors M, et al. T-cell subsets that harbor human immunodeficiency virus (HIV) in vivo: implications for HIV pathogenesis. J Virol. 2004;78:1160–1168. - PMC - PubMed

MeSH terms

Substances