. 2016 Aug 22:7:12511.
doi: 10.1038/ncomms12511.

Mid-Holocene pulse of thinning in the Weddell Sea sector of the West Antarctic ice sheet

Affiliations

Mid-Holocene pulse of thinning in the Weddell Sea sector of the West Antarctic ice sheet

Andrew S Hein et al. Nat Commun. .

Abstract

Establishing the trajectory of thinning of the West Antarctic ice sheet (WAIS) since the last glacial maximum (LGM) is important for addressing questions concerning ice sheet (in)stability and changes in global sea level. Here we present detailed geomorphological and cosmogenic nuclide data from the southern Ellsworth Mountains in the heart of the Weddell Sea embayment that suggest the ice sheet, nourished by increased snowfall until the early Holocene, was close to its LGM thickness at 10 ka. A pulse of rapid thinning caused the ice elevation to fall ∼400 m to the present level at 6.5-3.5 ka, and could have contributed 1.4-2 m to global sea-level rise. These results imply that the Weddell Sea sector of the WAIS contributed little to late-glacial pulses in sea-level rise but was involved in mid-Holocene rises. The stepped decline is argued to reflect marine downdraw triggered by grounding line retreat into Hercules Inlet.


Figures

Figure 1
Figure 1. Location map showing the position of the Heritage Range in the heart of the Weddell Sea embayment.
(a) The Heritage Range in relation to ice-stream basins. The image shows satellite-derived surface ice-flow velocities of the Antarctic Ice Sheet from MEaSUREs, annotated to show the dominant ice streams and their catchment areas. The white box indicates the location of b. (b) The Heritage Range field site in relation to Hercules Inlet and Institute ice stream. The figure shows a MODIS and LIMA mosaic of Antarctica with prominent geographical features labelled. White line indicates the ASAID grounding line, thin grey lines are surface elevation contours at 250 m intervals from Bedmap2 (ref. 55).
Figure 2
Figure 2. The southern Heritage Range field site.
The Google Earth imagery (Map data: U.S. Geological Survey) shows the location of the Patriot Hills (PH), Independence Hills (IH) and Marble Hills (MH). It also shows the location of blue-ice areas, drawn-out medial moraines between the MH and IH massifs, and current ice flow directions (black arrows). Surface contours are from Bedmap2 (ref. 55).
Figure 3
Figure 3. The Patriot and Independence Hills field site and evidence for ice-flow reversal.
(a) Perched blocks characteristic of the little-weathered deposits of the last glacial cycle. (b) Extensional crevasses within the blue-ice moraine at the western end of the Independence Hills are consistent with present northward flow implied by the northward dipping surface gradient at this location, and with flow structures in the ice. (c) MODIS and LIMA mosaic showing the Patriot Hills (PH) and the medial blue-ice moraine extending east from the Independence Hills (IH). Ice overspilling into the valley has progressively displaced the moraine away from the mountain foot as is consistent with former eastward flow. Current ice flow directions (black solid arrows) show flow has been diverted northward into Horseshoe Glacier (HSG). The inset shows the ice margin profile between A and A′ with a northward dipping gradient to the west. The southerly dipping gradient near A′ is into a zone of local ablation.
Figure 4
Figure 4. The cosmogenic nuclide data.
The apparent exposure ages versus elevation above the present ice surface plotted together with ice-volume equivalent global sea-level changes. The figure shows results for the Marble Hills (MH), Independence Hills (IH) and Patriot Hills (PH) for the Holocene period (left panel) and the past 60 ka (right panel). Error bars (1σ) reflect analytical uncertainties only. The light-coloured symbols are previously published data. The solid horizontal line is the upper limit of little-weathered erratics for the MH (blue), IH (black) and PH (red). The dotted lines connect the youngest exposure dates at each massif, which are used to infer the mid-Holocene pulse of thinning as indicated by the grey shaded box. The grey line indicates ice-volume equivalent sea-level changes. Our data indicate this sector of the ice sheet contributed to the final stages of sea-level rise.
Figure 5
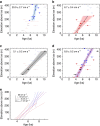
Figure 5. Thinning-rate modelling results.
Thinning rates in ad are produced using 10,000 iterations of linear regression through the 10Be data points and their uncertainties, as described in the methods. Uncertainties are 1σ. The data points are coloured to match the different massifs with (a) blue from Marble Hills (MH), (b) red from Patriot Hills (PH), (c) black from Independence Hills, (d) and purple for the entire data set. Solid circles within each plot are the data used to model thinning rates. (e) A summary of the slopes for MH, PH and the full data set.

References

    1. Golledge N. R. et al. Glaciology and geological signature of the Last Glacial Maximum Antarctic ice sheet. Quat. Sci. Rev. 78, 225–247 (2013).
    1. Stone J. O. et al. Holocene deglaciation of Marie Byrd Land, West Antarctica. Science 299, 99–102 (2003). - PubMed
    1. Whitehouse P. L., Bentley M. J. & Le Brocq A. M. A deglacial model for Antarctica: geological constraints and glaciological modelling as a basis for a new model of Antarctic glacial isostatic adjustment. Quat. Sci. Rev. 32, 1–24 (2012).
    1. Weber M. E. et al. Millennial-scale variability in Antarctic ice-sheet discharge during the last deglaciation. Nature 510, 134–138 (2014). - PubMed
    1. Bentley M. J. et al. A community-based geological reconstruction of Antarctic Ice Sheet deglaciation since the Last Glacial Maximum. Quat. Sci. Rev. 100, 1–9 (2014).

Publication types

LinkOut - more resources