. 2016 Sep 1;99(3):527-539.
doi: 10.1016/j.ajhg.2016.06.031. Epub 2016 Aug 18.

Determinants of Power in Gene-Based Burden Testing for Monogenic Disorders

Affiliations

Determinants of Power in Gene-Based Burden Testing for Monogenic Disorders

Michael H Guo et al. Am J Hum Genet. .

Abstract

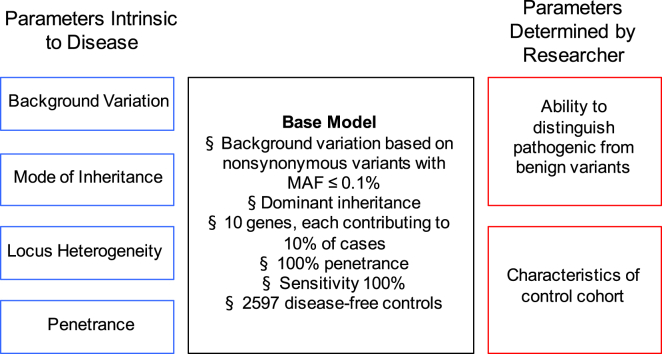
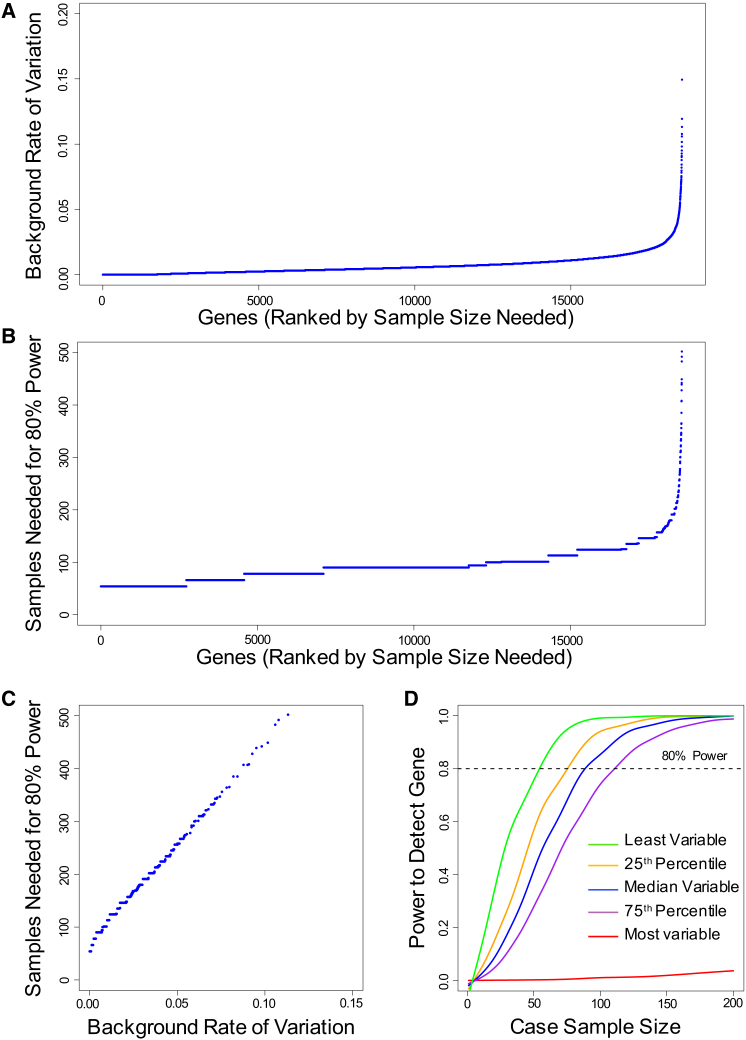
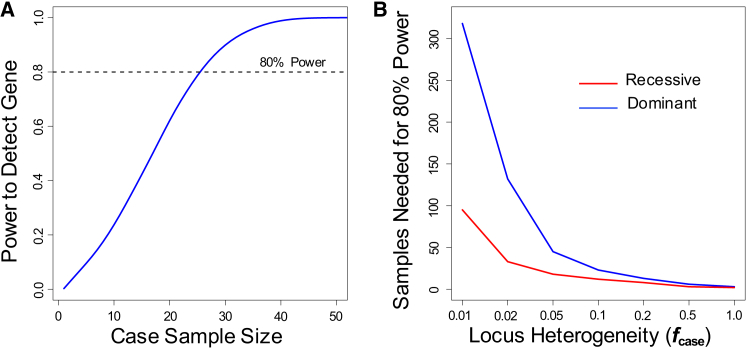
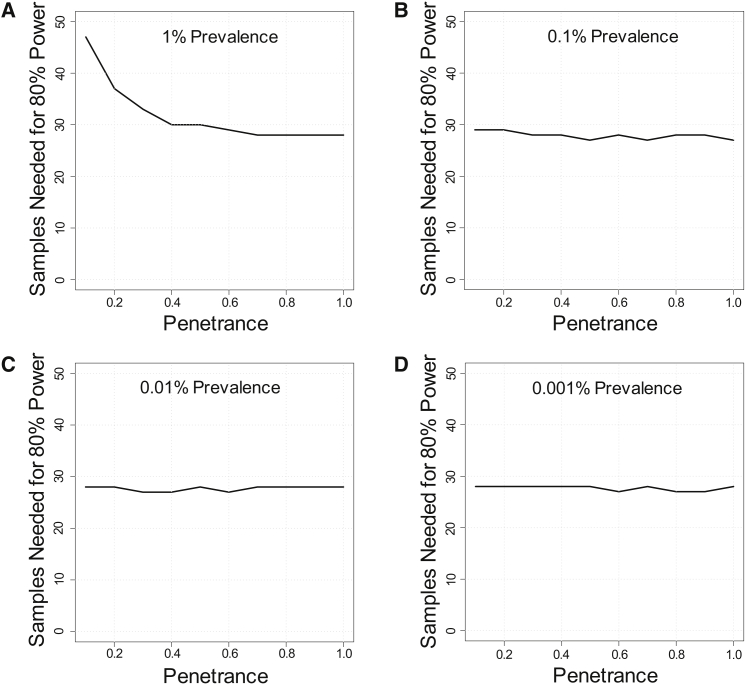
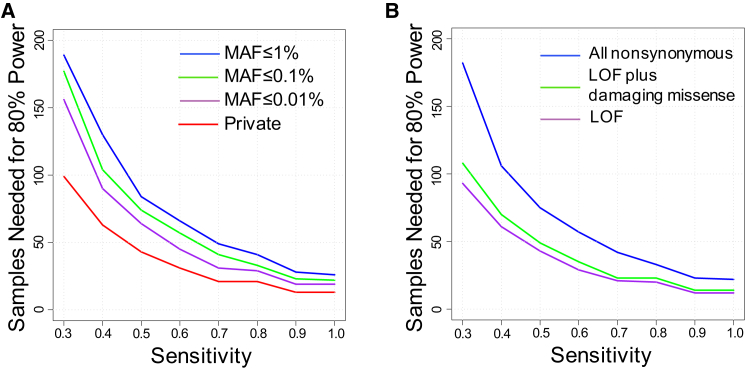
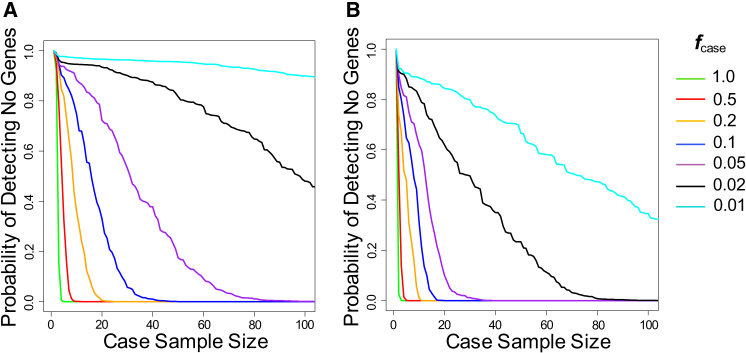
Whole-exome sequencing has enabled new approaches for discovering genes associated with monogenic disorders. One such approach is gene-based burden testing, in which the aggregate frequency of "qualifying variants" is compared between case and control subjects for each gene. Despite substantial successes of this approach, the genetic causes for many monogenic disorders remain unknown or only partially known. It is possible that particular genetic architectures lower rates of discovery, but the influence of these factors on power has not been rigorously evaluated. Here, we leverage large-scale exome-sequencing data to create an empirically based simulation framework to evaluate the impact of key parameters (background variation rates, locus heterogeneity, mode of inheritance, penetrance) on power in gene-based burden tests in the context of monogenic disorders. Our results demonstrate that across genes, there is a wide range in sample sizes needed to achieve power due to differences in the background rate of rare variants in each gene. Increasing locus heterogeneity results in rapid increases in sample sizes needed to achieve adequate power, particularly when individual genes contribute to less than 5% of cases under a dominant model. Interestingly, incomplete penetrance as low as 10% had little effect on power due to the low prevalence of monogenic disorders. Our results suggest that moderate incomplete penetrance is not an obstacle in this gene-based burden testing approach but that dominant disorders with high locus heterogeneity will require large sample sizes. Our simulations also provide guidance on sample size needs and inform study design under various genetic architectures.


Figures

Figure 1
Figure 1
Determinants of Power in Exome-Sequencing Studies for Monogenic Disorders The black box (center) lists the values for each parameter under the “base model” monogenic disorder we consider. On the left (blue) are the parameters that are intrinsic to a given disorder (background rate of variation of disease-associated genes, mode of inheritance, locus heterogeneity, and penetrance). On the right (red) are parameters that are determined by the researcher (sensitivity to detect pathogenic variants and characteristics of control cohort). The values used in the paper are listed in Table S1.
Figure 2
Figure 2
Background Rate of Variation and Power to Detect Specific Genes (A) Background rate of variation (proportion of control subjects carrying qualifying variants) in each gene considering all nonsynonymous variants at MAF ≤ 0.1%. Genes are ranked on the horizontal axis from the least variable to the most variable. Each point on the plot represents a single gene. Not shown: MUC16 (0.209) and TTN (0.382). (B) Sample size needed to have 80% power to detect each gene in the genome under the base model (see Figure 1 for details of the base model). Genes are ranked from least to most samples needed for 80% power. Not shown: SYNE1 (502 samples), FLG (548), OBSCN (692), MUC16 (1,058), and TTN (3,740). (C) Sample size needed to have 80% power to detect each gene in the genome as a function of background rate of variation. Simulations were performed under base model. Not shown: SYNE1 (0.113 background rate; 502 samples), FLG (0.119; 548), OBSCN (0.149; 692), MUC16 (0.209; 1,058), and TTN (0.382; 3,740). (D) Power to detect a gene at increasing sample sizes, for the least variable gene (green), genes at 25th (orange), 50th (blue), 75th (purple) percentiles of variability, and most variable gene (red). Simulations performed under the base model. Curves were smoothed using smooth.spline function in R.
Figure 3
Figure 3
Power to Detect at Least One Gene Associated with Disease (A) Power to detect at least one gene associated for a disease with ten disease-associated genes, each of which contributes to 10% of cases (fcase = 0.1). Analyses were performed at increasing case cohort sample sizes under a dominant model and considering nonsynonymous variants at MAF ≤ 0.1%. (B) Sample sizes needed to have 80% power to detect at least one gene association for a disease under a dominant (blue) and recessive (red) model. Simulations were performed under base model at varying values of fcase (0.01 to 1.0)
Figure 4
Figure 4
Effect of Penetrance Effect of penetrance on sample sizes needed for 80% power to detect at least one gene associated with disease. Simulations were performed at varying disease prevalence of 1% (A), 0.1% (B), 0.01% (C), or 0.001% (D). Values of penetrance range from 0.1 to 1.0. Simulations were performed assuming a dominant disorder with ten disease-associated genes, each of which contributes to 10% of cases (fcase = 0.1).
Figure 5
Figure 5
Effect of Ability to Distinguish Pathogenic from Benign Variants (A) Sample sizes needed to achieve 80% power to detect at least one disease-associated gene at varying MAF cutoffs (1%, 0.1%, 0.01%, or private) and sensitivities (0.3 to 1.0) to detect pathogenic variants. Simulations were performed assuming a dominant disorder with ten disease-associated genes, each of which contributes to 10% of cases (fcase = 0.1). Background rates of variation were calculated based on all nonsynonymous variants. (B) Sample sizes needed to achieve 80% power to detect at least one disease-associated gene at varying protein-deleteriousness cutoffs and sensitivities (ranging from 0.3 to 1.0) to detect pathogenic variants. Protein-deleteriousness cutoffs include all nonynonymous (blue), LOF plus damaging missense (green), or LOF only (purple). Damaging missense assignments were based on three protein-prediction algorithms (see Material and Methods). LOF only includes only nonsense, splice site, and frameshift. Simulations were performed assuming a dominant disorder with ten disease-associated genes, each of which contributes to 10% of cases (fcase = 0.1). Background rates of variation were calculated based on MAF ≤ 0.1%
Figure 6
Figure 6
Bounds on Genetic Architecture Probability of not detecting any genes associated with a given disorder at increasing sample sizes. Analyses were performed at different hypothesized fcase ranging from 0.01 to 1.0 under a dominant model (A) or a recessive model (B). All nonsynonymous variants with MAF ≤ 0.1% were used in calculating background variation rates.

References

    1. Chong J.X., Buckingham K.J., Jhangiani S.N., Boehm C., Sobreira N., Smith J.D., Harrell T.M., McMillin M.J., Wiszniewski W., Gambin T., Centers for Mendelian Genomics The genetic basis of Mendelian phenotypes: discoveries, challenges, and opportunities. Am. J. Hum. Genet. 2015;97:199–215. - PMC - PubMed
    1. Risch N. Linkage strategies for genetically complex traits. II. The power of affected relative pairs. Am. J. Hum. Genet. 1990;46:229–241. - PMC - PubMed
    1. Risch N., Merikangas K. The future of genetic studies of complex human diseases. Science. 1996;273:1516–1517. - PubMed
    1. Greenberg D.A., Abreu P., Hodge S.E. The power to detect linkage in complex disease by means of simple LOD-score analyses. Am. J. Hum. Genet. 1998;63:870–879. - PMC - PubMed
    1. Ploughman L.M., Boehnke M. Estimating the power of a proposed linkage study for a complex genetic trait. Am. J. Hum. Genet. 1989;44:543–551. - PMC - PubMed

Publication types