

Inhibitory Interplay between Orexin Neurons and Eating
- PMID: 27546579
- PMCID: PMC5049542
- DOI: 10.1016/j.cub.2016.07.013
Inhibitory Interplay between Orexin Neurons and Eating
Abstract
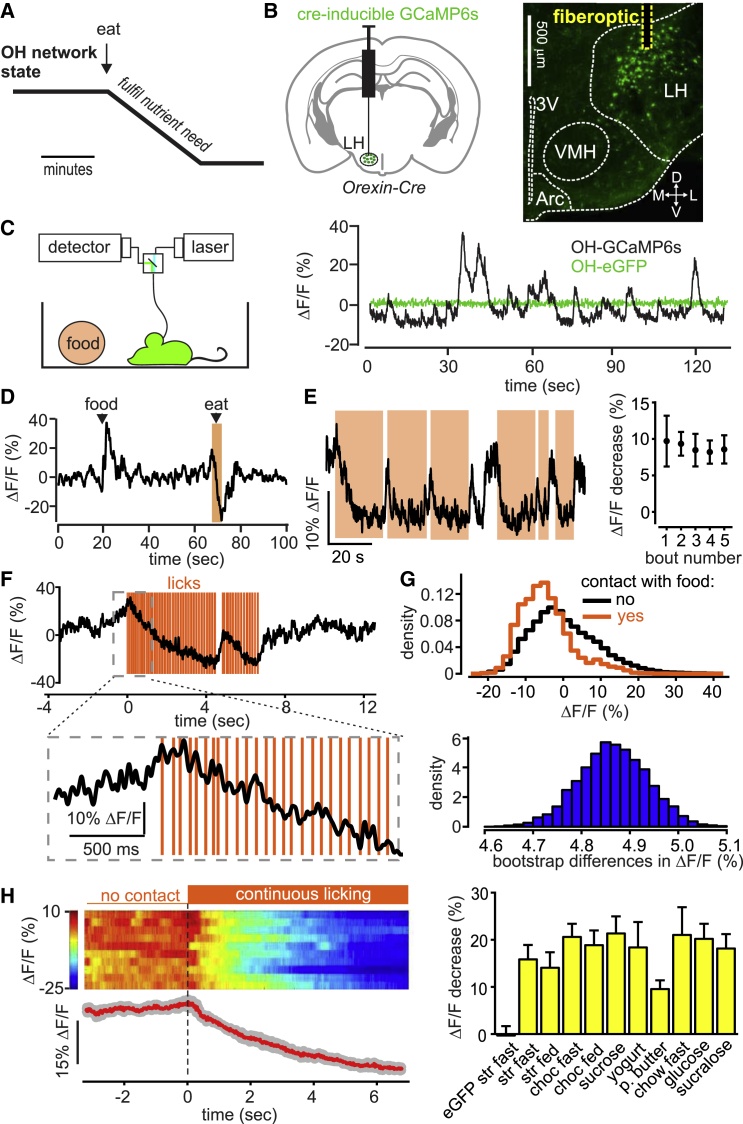
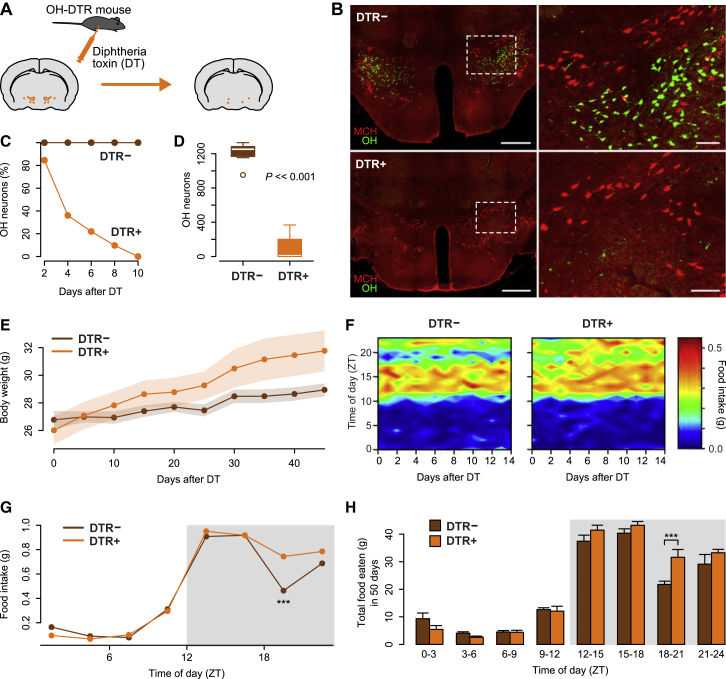
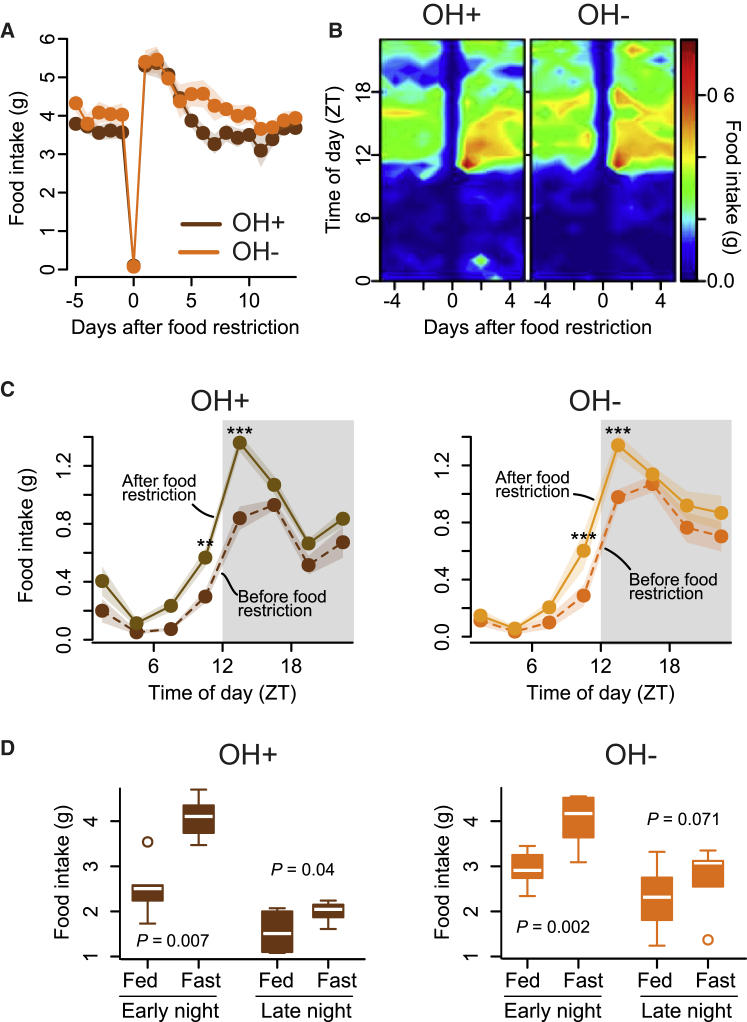
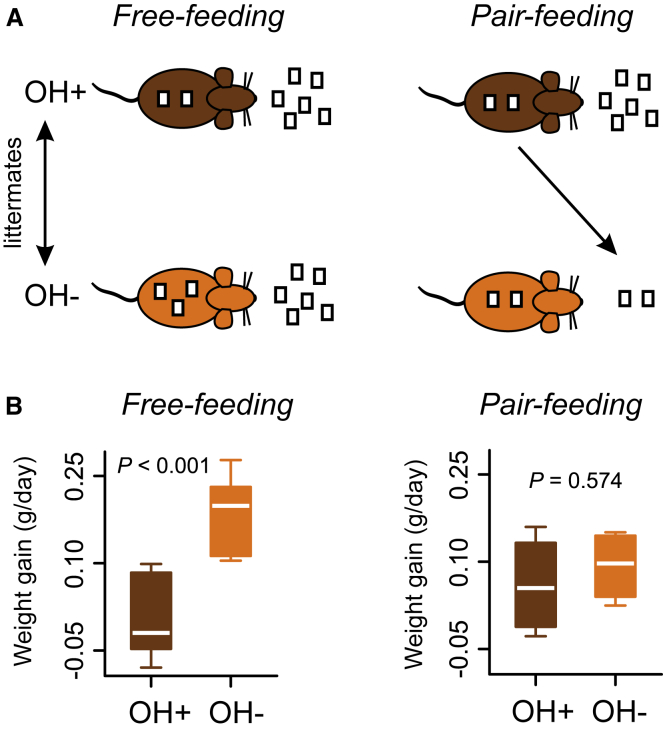
In humans and rodents, loss of brain orexin/hypocretin (OH) neurons causes pathological sleepiness [1-4], whereas OH hyperactivity is associated with stress and anxiety [5-10]. OH cell control is thus of considerable interest. OH cells are activated by fasting [11, 12] and proposed to stimulate eating [13]. However, OH cells are also activated by diverse feeding-unrelated stressors [14-17] and stimulate locomotion and "fight-or-flight" responses [18-20]. Such OH-mediated behaviors presumably preclude concurrent eating, and loss of OH cells produces obesity, suggesting that OH cells facilitate net energy expenditure rather than energy intake [2, 21-23]. The relationship between OH cells and eating, therefore, remains unclear. Here we investigated this issue at the level of natural physiological activity of OH cells. First, we monitored eating-associated dynamics of OH cells using fiber photometry in free-feeding mice. OH cell activity decreased within milliseconds after eating onset, and remained in a down state during eating. This OH inactivation occurred with foods of diverse tastes and textures, as well as with calorie-free "food," in both fed and fasted mice, suggesting that it is driven by the act of eating itself. Second, we probed the implications of natural OH cell signals for eating and weight in a new conditional OH cell-knockout model. Complete OH cell inactivation in adult brain induced a hitherto unrecognized overeating phenotype and caused overweight that was preventable by mild dieting. These results support an inhibitory interplay between OH signals and eating, and demonstrate that OH cell activity is rapidly controllable, across nutritional states, by voluntary action.
Copyright © 2016 The Author(s). Published by Elsevier Ltd.. All rights reserved.
Figures
Comment in
-
Feeding Behavior: Hypocretin/Orexin Neurons Act between Food Seeking and Eating.Curr Biol. 2016 Sep 26;26(18):R845-R847. doi: 10.1016/j.cub.2016.07.069. Curr Biol. 2016. PMID: 27676302
Similar articles
-
Awake dynamics and brain-wide direct inputs of hypothalamic MCH and orexin networks.Nat Commun. 2016 Apr 22;7:11395. doi: 10.1038/ncomms11395. Nat Commun. 2016. PMID: 27102565 Free PMC article.
-
Roles for Orexin/Hypocretin in the Control of Energy Balance and Metabolism.Curr Top Behav Neurosci. 2017;33:137-156. doi: 10.1007/7854_2016_51. Curr Top Behav Neurosci. 2017. PMID: 27909992 Review.
-
Feeding Behavior: Hypocretin/Orexin Neurons Act between Food Seeking and Eating.Curr Biol. 2016 Sep 26;26(18):R845-R847. doi: 10.1016/j.cub.2016.07.069. Curr Biol. 2016. PMID: 27676302
-
Sleep/wake fragmentation disrupts metabolism in a mouse model of narcolepsy.J Physiol. 2007 Jun 1;581(Pt 2):649-63. doi: 10.1113/jphysiol.2007.129510. Epub 2007 Mar 22. J Physiol. 2007. PMID: 17379635 Free PMC article.
-
To eat or to sleep? Orexin in the regulation of feeding and wakefulness.Annu Rev Neurosci. 2001;24:429-58. doi: 10.1146/annurev.neuro.24.1.429. Annu Rev Neurosci. 2001. PMID: 11283317 Review.
Cited by
-
Loss of Snord116 impacts lateral hypothalamus, sleep, and food-related behaviors.JCI Insight. 2020 Jun 18;5(12):e137495. doi: 10.1172/jci.insight.137495. JCI Insight. 2020. PMID: 32365348 Free PMC article.
-
Dopamine release in the nucleus accumbens promotes REM sleep and cataplexy.iScience. 2023 Aug 11;26(9):107613. doi: 10.1016/j.isci.2023.107613. eCollection 2023 Sep 15. iScience. 2023. PMID: 37664637 Free PMC article.
-
Contribution of changes in the orexin system and energy sensors in the brain in depressive disorder - a study in an animal model.Pharmacol Rep. 2024 Feb;76(1):51-71. doi: 10.1007/s43440-023-00559-0. Epub 2024 Jan 9. Pharmacol Rep. 2024. PMID: 38194217 Free PMC article.
-
Orexin/hypocretin and dysregulated eating: Promotion of foraging behavior.Brain Res. 2020 Mar 15;1731:145915. doi: 10.1016/j.brainres.2018.08.018. Epub 2018 Aug 17. Brain Res. 2020. PMID: 30125533 Free PMC article. Review.
-
Sleep dysregulation in binge eating disorder and "food addiction": the orexin (hypocretin) system as a potential neurobiological link.Neuropsychopharmacology. 2021 Nov;46(12):2051-2061. doi: 10.1038/s41386-021-01052-z. Epub 2021 Jun 18. Neuropsychopharmacology. 2021. PMID: 34145404 Free PMC article. Review.
References
-
- Chemelli R.M., Willie J.T., Sinton C.M., Elmquist J.K., Scammell T., Lee C., Richardson J.A., Williams S.C., Xiong Y., Kisanuki Y. Narcolepsy in orexin knockout mice: molecular genetics of sleep regulation. Cell. 1999;98:437–451. - PubMed
-
- Hara J., Beuckmann C.T., Nambu T., Willie J.T., Chemelli R.M., Sinton C.M., Sugiyama F., Yagami K., Goto K., Yanagisawa M., Sakurai T. Genetic ablation of orexin neurons in mice results in narcolepsy, hypophagia, and obesity. Neuron. 2001;30:345–354. - PubMed
-
- Nishino S., Ripley B., Overeem S., Lammers G.J., Mignot E. Hypocretin (orexin) deficiency in human narcolepsy. Lancet. 2000;355:39–40. - PubMed
Publication types
MeSH terms
Substances
Grants and funding
LinkOut - more resources
Full Text Sources
Other Literature Sources
