

Relationships between different nutritional anthropometric statuses and health-related fitness of South African primary school children
- PMID: 27546583
- PMCID: PMC5399808
- DOI: 10.1080/03014460.2016.1224386
Relationships between different nutritional anthropometric statuses and health-related fitness of South African primary school children
Abstract
Background: A double burden of both under- and over-nutrition exists among South African children.
Aim: To describe associations between nutritional statuses and health-related fitness test performances.
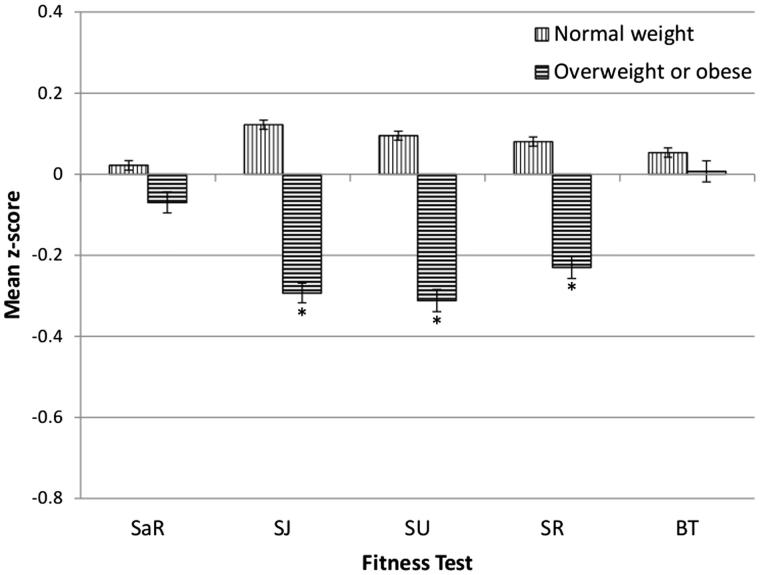
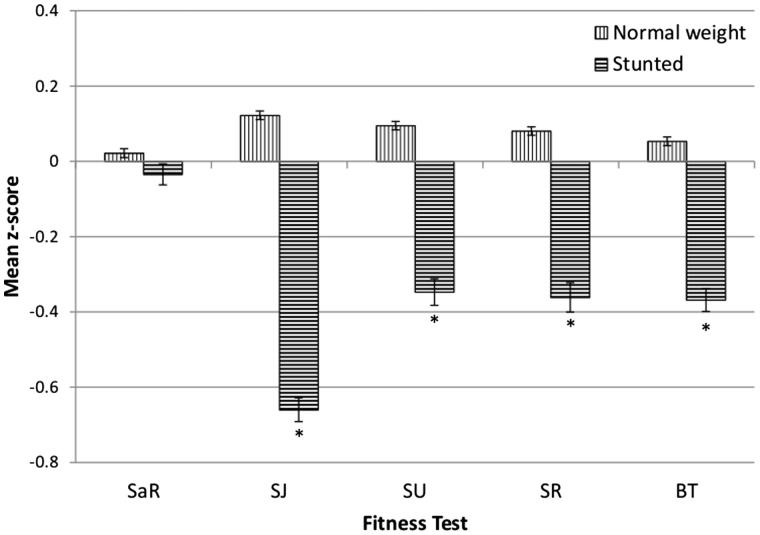
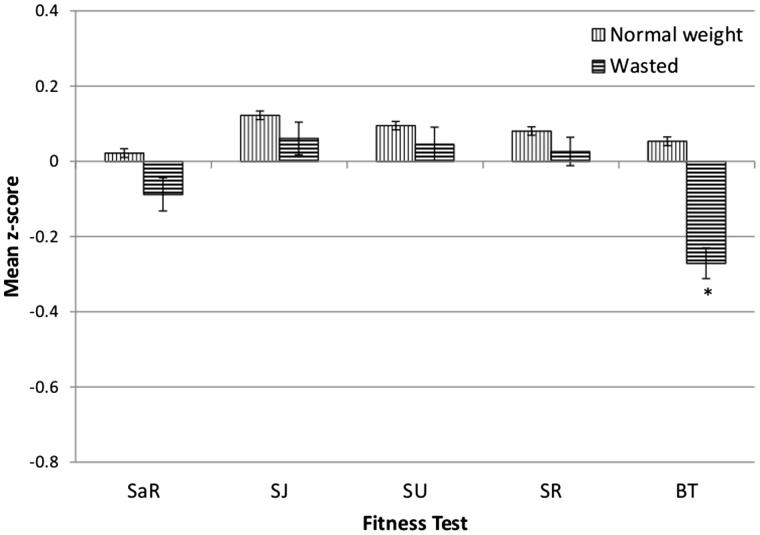
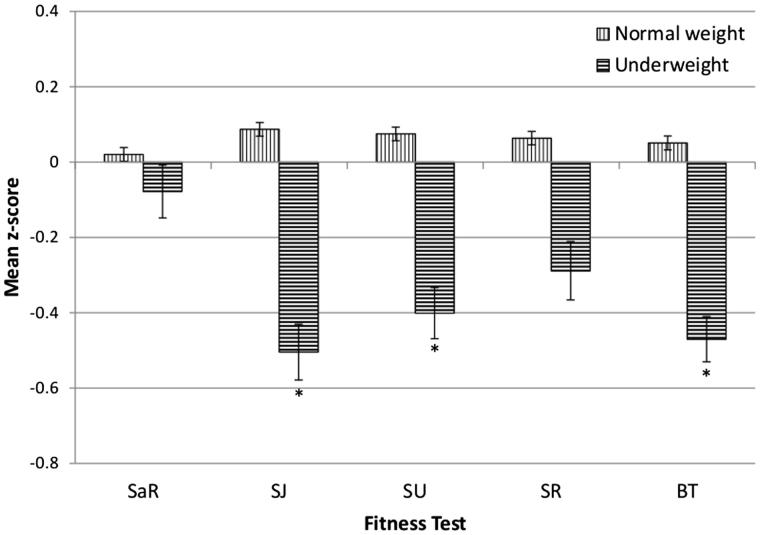
Subjects and methods: Height and weight of 10 285 children (6-13 years; n = 5604 boys and 4681 girls) were measured and used to calculate body mass index (BMI) and prevalence of overweight and obesity, stunting, wasting and underweight. Physical fitness scores for standing long jump, shuttle run, sit-and-reach, sit-up (EUROFIT) and cricket ball throw were assessed. Age- and gender-specific z-scores were calculated for these variables. Physical fitness for each nutritional status group was compared to children of normal weight.
Results: Compared to normal weight children, overweight and obese children scored lower on all fitness tests (p < .001), except cricket ball throw (p = .235) and sit-and-reach (p = .015). Stunted and underweight children performed poorer than normal weight children on most fitness tests (p < .001), except sit-and-reach (stunted: p = .829; underweight: p = .538) and shuttle run (underweight: p = .017). Performance of wasted children was not as highly compromised as other under-nourished groups, but they performed poorer on the cricket ball throw (p < .001).
Conclusions: When compared to normal weight children, both under- and over-nourished children performed poorer on some, but not all, health-related fitness tests.
Keywords: South African primary school children; health-related fitness; obesity; overweight; stunting; underweight; wasting.
Figures

References
-
- Adamo KB, Sheel AW, Onywera V, Waudo J, Boit M, Tremblay MS.. 2010. Child obesity and fitness levels among Kenyan and Canadian children from urban and rural environments: A KIDS-CAN Research Alliance Study. Int J Pediatr Obes 6:1–8. - PubMed
-
- Armstrong MEG, Lambert EV, Lambert MI.. 2011a. Physical fitness of South African primary school children, 6 to 13 years of age: Discovery vitality health of the nation study. Percept Motor Skills 113:999–1016. - PubMed
-
- Armstrong MEG, Lambert MI, Lambert EV.. 2011b. Secular trends in the prevalence of stunting, overweight and obesity among South African children (1994–2004). Eur J Clin Nutr 65:835–840. - PubMed
-
- Armstrong MEG, Lambert MI, Sharwood KA, Lambert EV.. 2006. Obesity and overweight in South African primary school children, 6 to 13 years of age: the health of the nation study. S Afr Med J 96:439–444. - PubMed
-
- Brunet M, Chaput JP, Tremblay A.. 2007. The association between low physical fitness and high body mass index or waist circumference is increasing with age in children: the ‘Quebec en Forme’ project. Int J Obes 31:637–643. - PubMed
MeSH terms
Grants and funding
LinkOut - more resources
Full Text Sources
Other Literature Sources
Medical
Molecular Biology Databases