. 2016 Oct 6;64(1):51-64.
doi: 10.1016/j.molcel.2016.08.002. Epub 2016 Aug 18.

53BP1 Integrates DNA Repair and p53-Dependent Cell Fate Decisions via Distinct Mechanisms

Affiliations

53BP1 Integrates DNA Repair and p53-Dependent Cell Fate Decisions via Distinct Mechanisms

Raquel Cuella-Martin et al. Mol Cell. .

Abstract

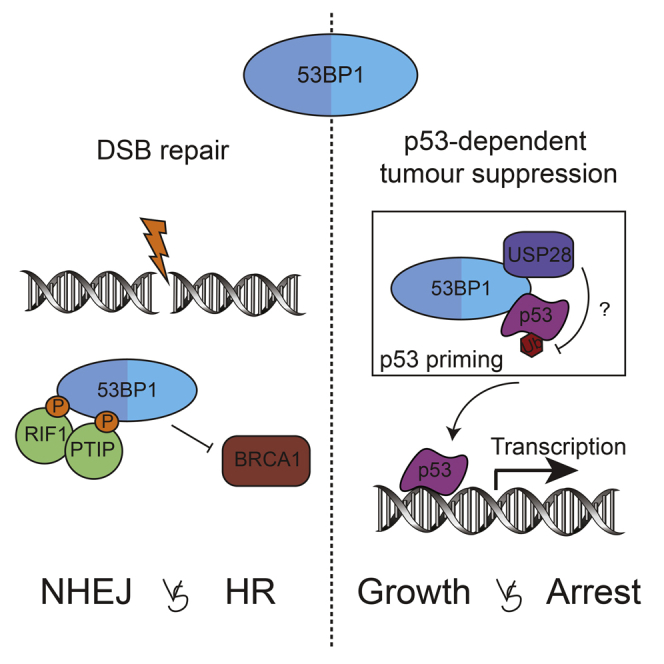
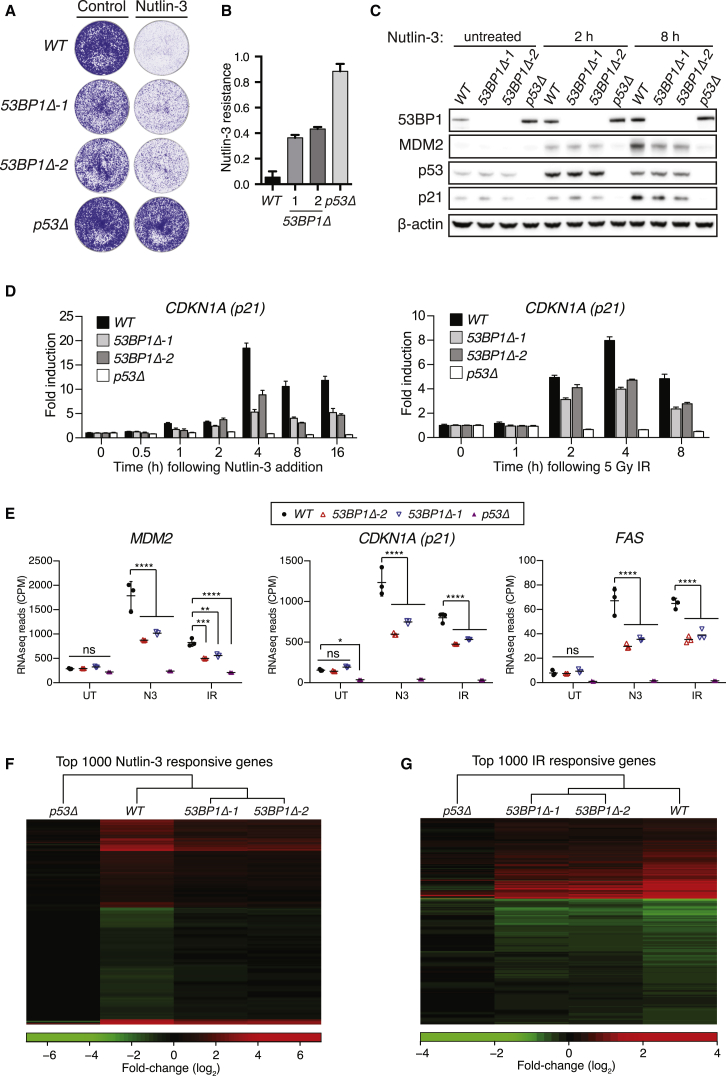
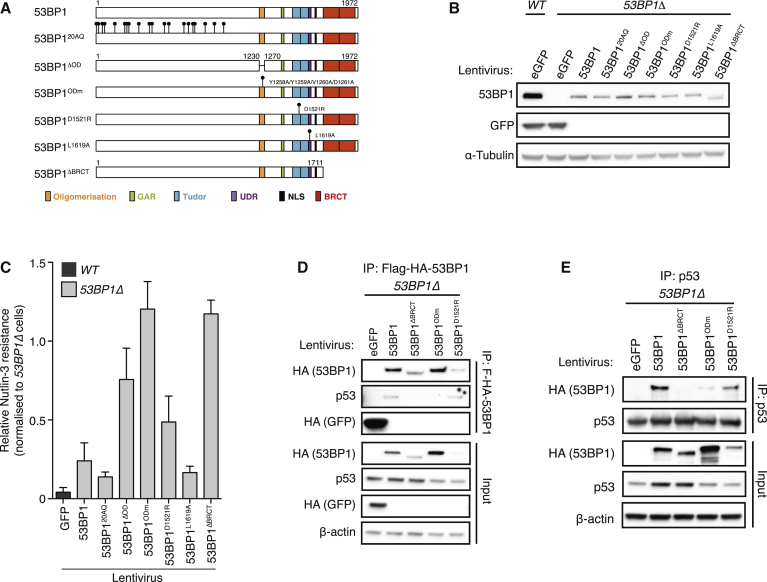
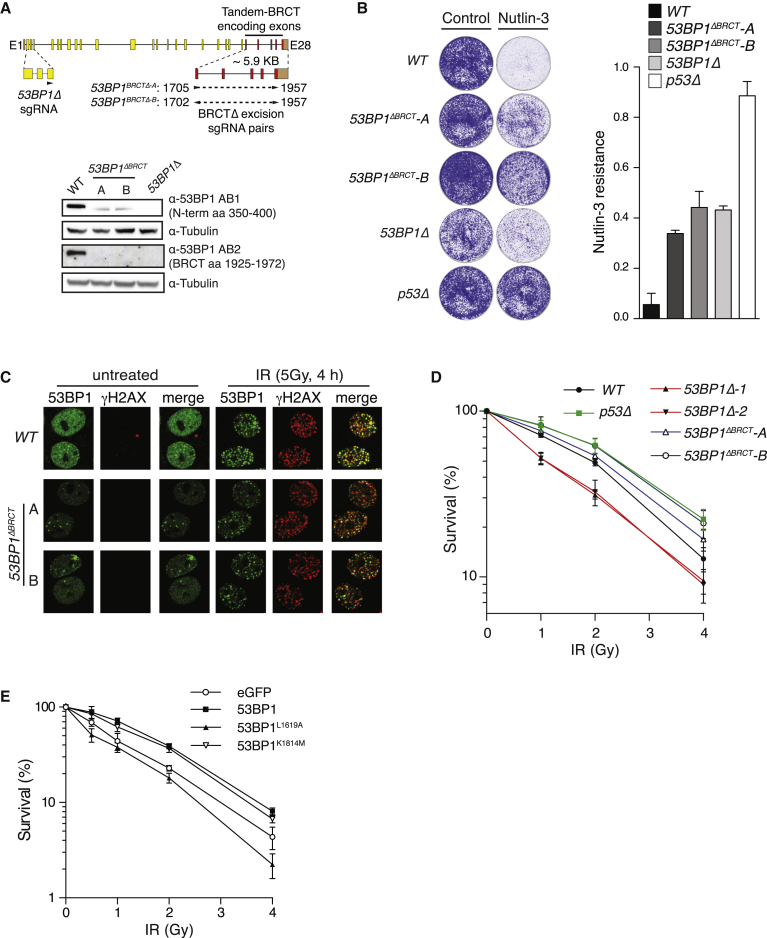
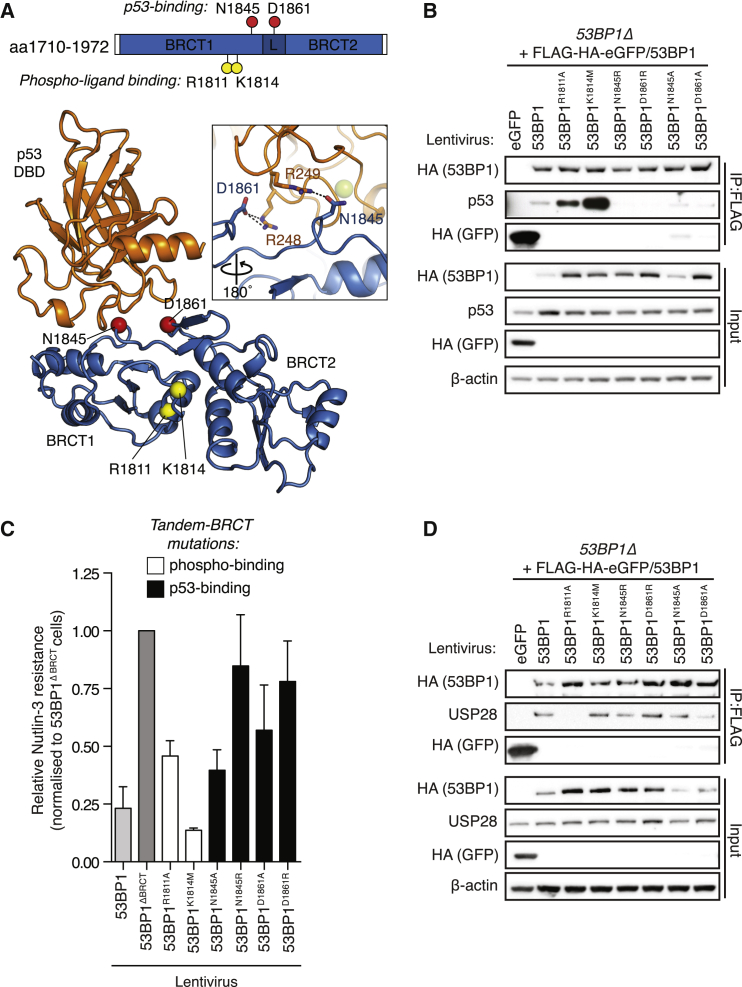
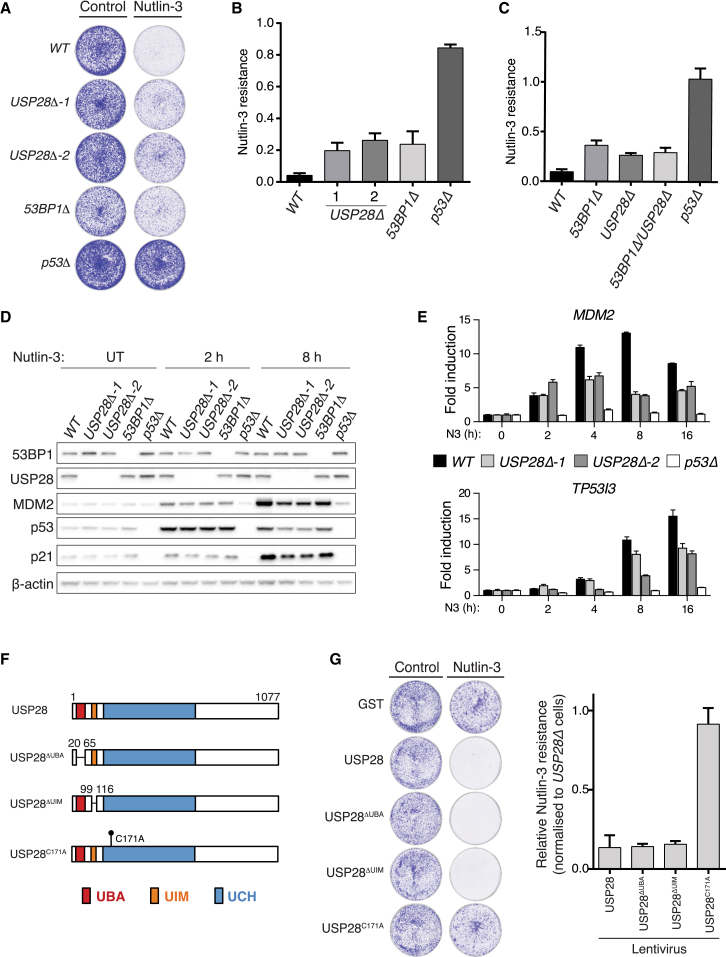
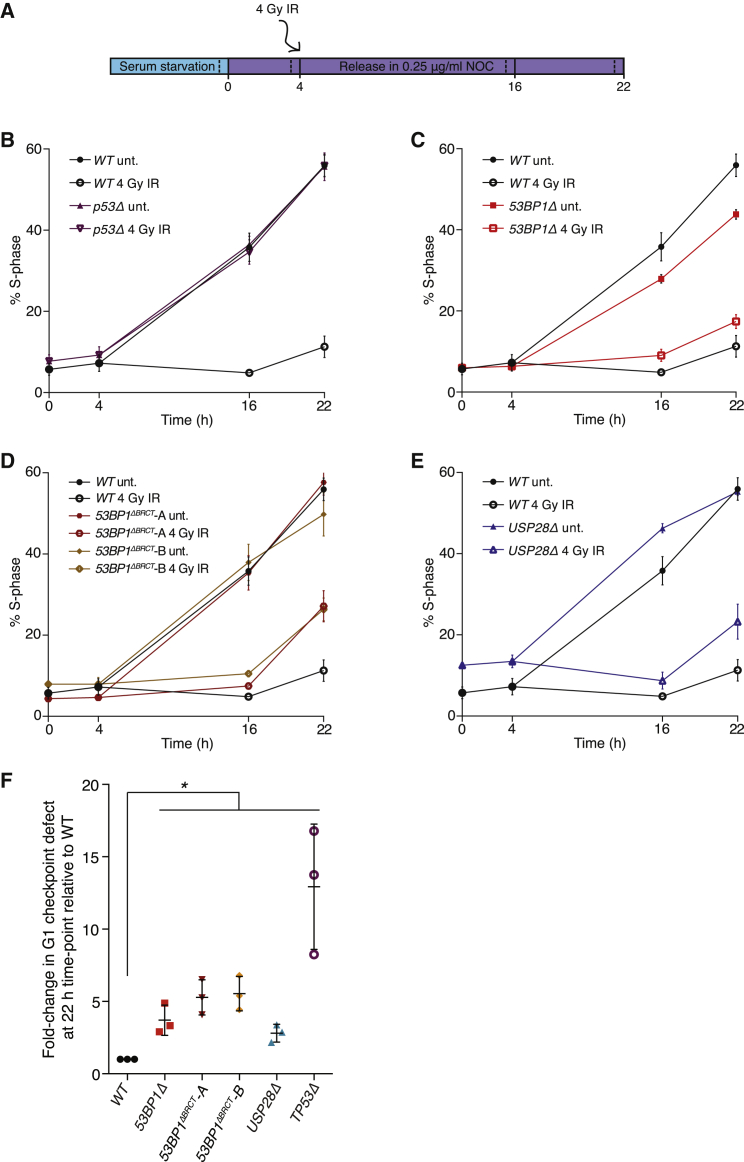
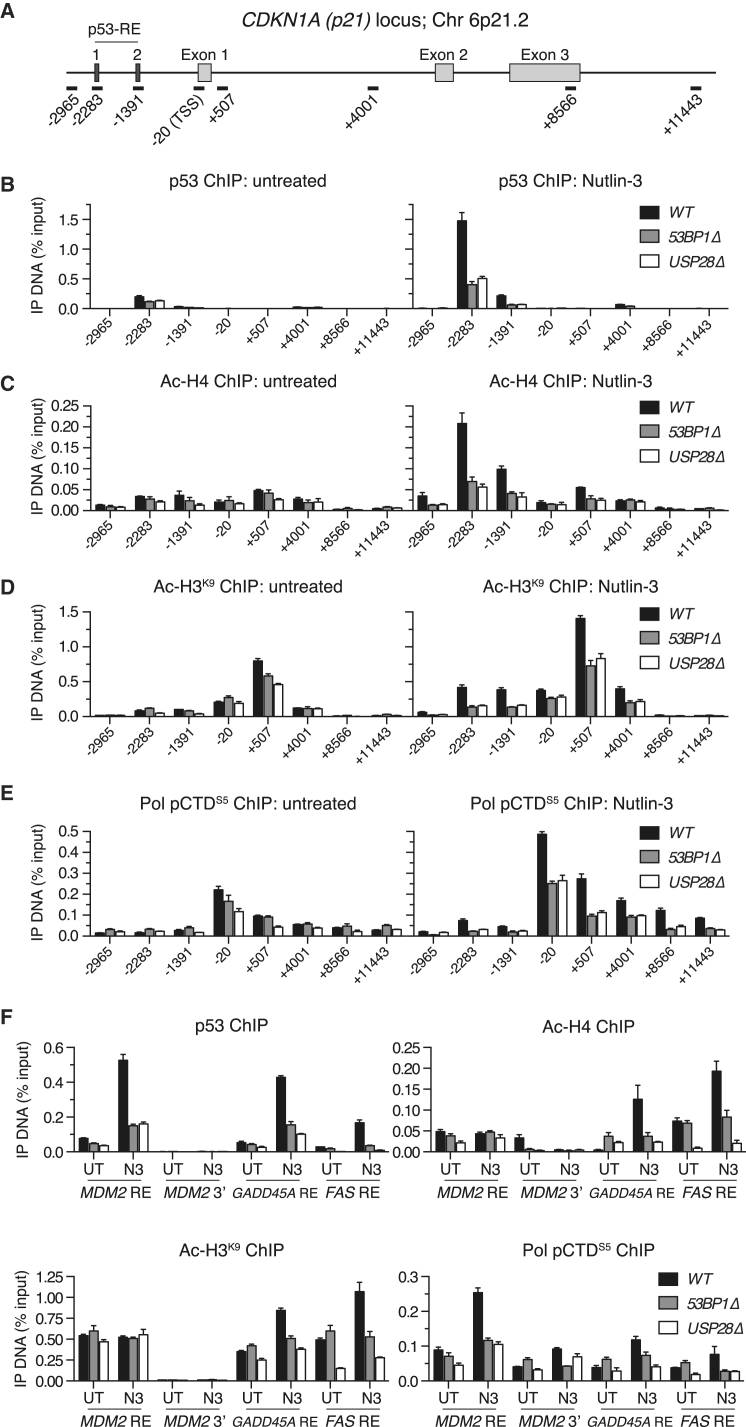
The tumor suppressor protein 53BP1, a pivotal regulator of DNA double-strand break (DSB) repair, was first identified as a p53-interacting protein over two decades ago. However, its direct contributions to p53-dependent cellular activities remain undefined. Here, we reveal that 53BP1 stimulates genome-wide p53-dependent gene transactivation and repression events in response to ionizing radiation (IR) and synthetic p53 activation. 53BP1-dependent p53 modulation requires both auto-oligomerization and tandem-BRCT domain-mediated bivalent interactions with p53 and the ubiquitin-specific protease USP28. Loss of these activities results in inefficient p53-dependent cell-cycle checkpoint and exit responses. Furthermore, we demonstrate 53BP1-USP28 cooperation to be essential for normal p53-promoter element interactions and gene transactivation-associated events, yet dispensable for 53BP1-dependent DSB repair regulation. Collectively, our data provide a mechanistic explanation for 53BP1-p53 cooperation in controlling anti-tumorigenic cell-fate decisions and reveal these activities to be distinct and separable from 53BP1's regulation of DNA double-strand break repair pathway choice.


Figures

None
Graphical abstract
Figure 1
Figure 1
53BP1 Enhances p53-Dependent Transcriptional Programs (A) Cells of indicated genotype were treated with 4 μM N3 for 7 days or mock treated, fixed, and stained with crystal violet. (B) Quantification of two experiments as in (A), each plated in triplicate (mean ± SD). (C) Immunoblot analysis of MCF-7 lines of indicated genotype following exposure to N3. (D) p21 transcript abundance in RNA isolates from cells treated with 4 μM N3 or 5 Gy IR, as evaluated by qRT-PCR. Fold induction calculated upon normalization against HPRT1 transcripts. Data are representative of two independent experiments; mean ± SD. (E) Representative p53-responsive transcripts from three RNA-seq replicates. Total RNA was sequenced from indicated MCF-7 lines following N3 (4 μM, 8 hr), IR (5 Gy, 4 hr), or control treatments. CPM, counts per million; ns, non-significant; p < 0.05; ∗∗p < 0.01; ∗∗∗p < 0.001; ∗∗∗∗p < 0.0001 (two-way ANOVA). Bars represent mean ± SD. (F and G) Heatmaps depicting log2 fold changes for top 1,000 responsive genes for each treatment relative to untreated controls (RNA-seq analysis of three biological replicates per condition). Ribo-depleted RNA was sequenced from indicated MCF-7 lines following N3 (4 μM 8 hr), IR (5 Gy, 4 hr), or control treatments. See also Figures S1 and S2 and Table S1.
Figure 2
Figure 2
53BP1-Dependent p53 Regulation Requires Oligomerization and BRCT Domain-Mediated p53 Interactions (A) Schematic representation of the 53BP1 domain and point mutants examined for restoration of N3 sensitivity. (B) Western blot showing comparable expression of 53BP1 mutants upon stable lentivirus-mediated transduction in 53BP1Δ MCF-7. (C) Indicated cell lines treated with N3 (4 μM) for 11 days or left untreated for 7 days were fixed and stained with crystal violet. Relative N3 resistance normalized to control (GFP)-complemented 53BP1Δ. Mean of three biological replicates ± SD. (D) Flag-HA-53BP1 proteins purified from cell lysates of indicated stably complemented 53BP1Δ MCF-7 lines following N3 treatment. Interacting proteins analyzed by immunoblotting. (E) Similar to (D), but the composition of p53 immunoprecipitates was analyzed. See also Figure S3.
Figure 3
Figure 3
53BP1’s p53-Regulatory and DSB Repair Activities Are Distinct and Separable (A) Generation of 53BP1ΔBRCT alleles using CRISPR-Cas9 technology. Top: schematic representation of TP53BP1 gene locus showing the two sgRNA pairs (triangles) used to excise BRCT-encoding exonic sequences. Bottom: immunoblot of lysates prepared from two 53BP1ΔBRCT MCF-7 lines with epitope-specific 53BP1 antibodies showing the expression of mutant 53BP1ΔBRCT protein. (B) N3 resistance assay was performed as in Figures 1A and 1B. Mean ± SD (n = 2, plated in triplicate). (C) Subnuclear 53BP1 localization was analyzed by indirect immunofluorescence in indicated cell lines following mock or irradiation (5 Gy, 4 hr) treatments. (D) The survival of MCF-7 cell lines of indicated genotype following control or X-ray irradiation treatments was assessed by colony survival assay. Mean ± SD (n = 3, plated in triplicate). (E) The survival of 53BP1Δ cells stably complemented with indicated 53BP1 transgenes following control or X-ray irradiation treatments was assessed as in (D). Mean ± SD (n = 3, plated in triplicate). See also Figure S4.
Figure 4
Figure 4
The 53BP1 BRCT Domain Mediates Bivalent Interactions with p53 and USP28 (A) The p53-53BP1 co-crystal structure (PDB: 1KZY; Joo et al., 2002) indicates the distinct tandem-BRCT surface residues involved in p53- and phospho-ligand interactions (red and yellow spheres, respectively). Dotted lines in zoom panel indicate hydrogen bonds between residues in 53BP1 and p53. (B) The interaction of p53 with indicated FLAG-HA-53BP1 protein complexes was probed by immunoblotting, following immunopurification from N3-treated cell lysates. (C) N3 resistance of 53BP1Δ cells complemented with indicated 53BP1 point mutants. N3 resistance was normalized to 53BP1ΔBRCT-complemented lines. Mean ± SD (n = 3, in triplicate). (D) As in (B), but FLAG-HA-53BP1 protein complexes were examined for USP28 co-purification. See also Figure S5.
Figure 5
Figure 5
USP28 Is a Component of the p53-53BP1 Axis (A) N3 resistance of indicated cell lines assessed as in Figures 1A and 1B. (B) Quantification of (A). Mean ± SD (n = 3). (C) N3 resistance of a 53BP1Δ, USP28Δ double-knockout cell line relative to single mutants. Mean ± SD (n = 3, in triplicate). (D) Lysates prepared from indicated control and N3-treated cell lines were immunoblotted with indicated antibodies. (E) The transactivation of p53-responsive genes MDM2 and TP53I3 was assessed by qRT-PCR in indicated cell lines. Indicated fold changes were calculated upon normalization against HPRT1 transcripts. Data are representative of two independent experiments; mean ± SD. (F) Schematic representation of the USP28 protein domain architecture and the domain and point mutants used in this study. UBA, ubiquitin-associated domain; UIM, ubiquitin-interaction motif; UCH, ubiquitin carboxyl-terminal hydrolase domain. (G) Visual and quantitative analysis of N3 resistance of USP28Δ cell lines stably transduced with indicated USP28 expressing lentiviruses. N3 resistance relative to a control (GST)-transduced USP28Δ cell line was calculated as in (A) and (B). Mean ± SD (n = 3, in triplicate). See also Figure S6.
Figure 6
Figure 6
53BP1 and USP28 Co-regulate p53-Dependent G1 Checkpoint Arrest (A) Schematic representation of the G1 checkpoint assay. Briefly, cells serum arrested in G0 for 24 hr were released in serum-containing medium supplemented with 0.25 μg/ml nocodazole before irradiation (4 Gy) and collection at indicated time points for cell-cycle analysis. Solid bars indicate experimental time points. Dotted lines indicate time of BrdU pulse addition. (B–E) S phase cell indices for each indicated condition as defined by BrdU pulse labeling immediately prior to collection at indicated time points. Relative cell-cycle phase distributions were calculated by flow cytometry in BrdU immunolabeled cells counterstained for DNA content. Three biological replicates mean ± SD. (F) Significance of G1 checkpoint defects detected in (B)–(E) as a measurement of changes in S phase indices in irradiated samples between 4 and 22 hr time points. IR-treated sample values first corrected against the S phase index change in the corresponding untreated sample were then normalized against the WT value for each experiment. Values are plotted as fold change relative to WT. Mean ± SD; p < 0.05 (Student’s t test).
Figure 7
Figure 7
53BP1 and USP28 Enhance p53-Responsive Element Interactions (A) Schematic of the p21 (CDKN1A) locus indicating high and low affinity p53 binding sites (p53-REs 1 and 2, respectively) and general gene structure. qPCR amplicons used to quantify ChIP-enriched DNA are indicated (bars) and named according to their relative distance to the transcription start site (TSS). (B–E) ChIP was performed in chromatin extracts prepared from indicated untreated or N3-treated (4 μM, 6 hr) cell lines using antibodies against p53 (B), pan-acetyl-H4 (C), acetyl-histone H3 Lys9 (D), and RNAP2 CTD phosphorylation (pSer5) (E). Immunoprecipitated DNA was calculated as a percentage of total input DNA. Data are representative of two independent experiments with PCRs performed in triplicate. Mean ± SD. (F) As in (B)–(E), but using p53-RE-spanning amplicons in indicated p53-responsive genes, except MDM2 3′, which indicates a control amplicon within the last MDM2 coding exon. See also Figure S7.

Comment in

  • p53: Understanding the actions of 53BP1.
    Wrighton KH. Wrighton KH. Nat Rev Mol Cell Biol. 2016 Oct;17(10):608. doi: 10.1038/nrm.2016.120. Epub 2016 Sep 1. Nat Rev Mol Cell Biol. 2016. PMID: 27580840 No abstract available.
  • 53BP1 Goes Back to Its p53 Roots.
    Durocher D, Pelletier L. Durocher D, et al. Mol Cell. 2016 Oct 6;64(1):3-4. doi: 10.1016/j.molcel.2016.09.024. Mol Cell. 2016. PMID: 27716486

References

    1. Baldock R.A., Day M., Wilkinson O.J., Cloney R., Jeggo P.A., Oliver A.W., Watts F.Z., Pearl L.H. ATM Localization and Heterochromatin Repair Depend on Direct Interaction of the 53BP1-BRCT2 Domain with γH2AX. Cell Rep. 2015;13:2081–2089. - PMC - PubMed
    1. Bothmer A., Robbiani D.F., Di Virgilio M., Bunting S.F., Klein I.A., Feldhahn N., Barlow J., Chen H.-T., Bosque D., Callen E. Regulation of DNA end joining, resection, and immunoglobulin class switch recombination by 53BP1. Mol. Cell. 2011;42:319–329. - PMC - PubMed
    1. Botuyan M.V., Lee J., Ward I.M., Kim J.-E., Thompson J.R., Chen J., Mer G. Structural basis for the methylation state-specific recognition of histone H4-K20 by 53BP1 and Crb2 in DNA repair. Cell. 2006;127:1361–1373. - PMC - PubMed
    1. Bouwman P., Aly A., Escandell J.M., Pieterse M., Bartkova J., van der Gulden H., Hiddingh S., Thanasoula M., Kulkarni A., Yang Q. 53BP1 loss rescues BRCA1 deficiency and is associated with triple-negative and BRCA-mutated breast cancers. Nat. Struct. Mol. Biol. 2010;17:688–695. - PMC - PubMed
    1. Brooks C.L., Gu W. p53 ubiquitination: Mdm2 and beyond. Mol. Cell. 2006;21:307–315. - PMC - PubMed

MeSH terms

Substances