. 2016 May-Jun;22(3):6801911.
doi: 10.1109/JSTQE.2015.2510293. Epub 2015 Dec 17.

Noncontact Elastic Wave Imaging Optical Coherence Elastography for Evaluating Changes in Corneal Elasticity Due to Crosslinking

Affiliations

Noncontact Elastic Wave Imaging Optical Coherence Elastography for Evaluating Changes in Corneal Elasticity Due to Crosslinking

Manmohan Singh et al. IEEE J Sel Top Quantum Electron. 2016 May-Jun.

Abstract

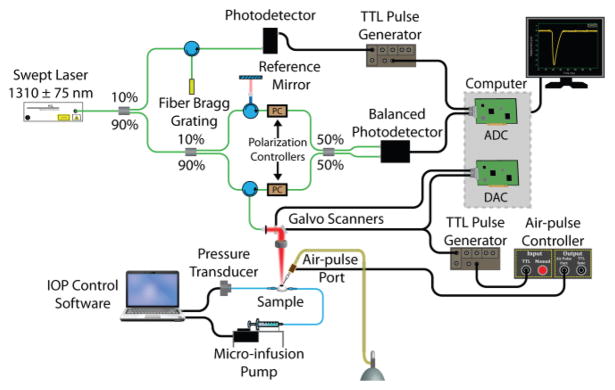
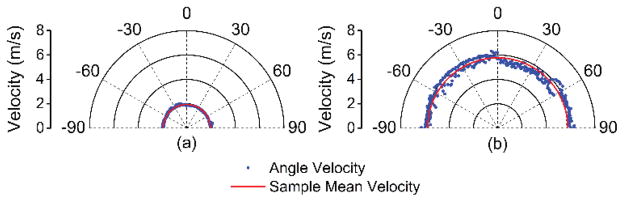
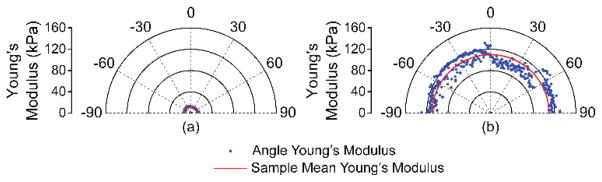
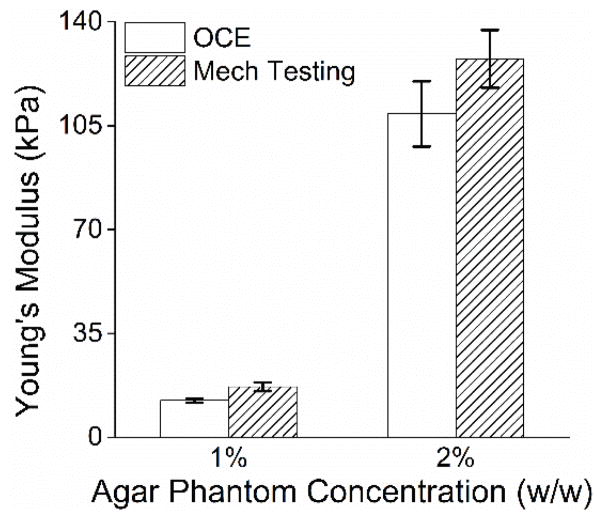
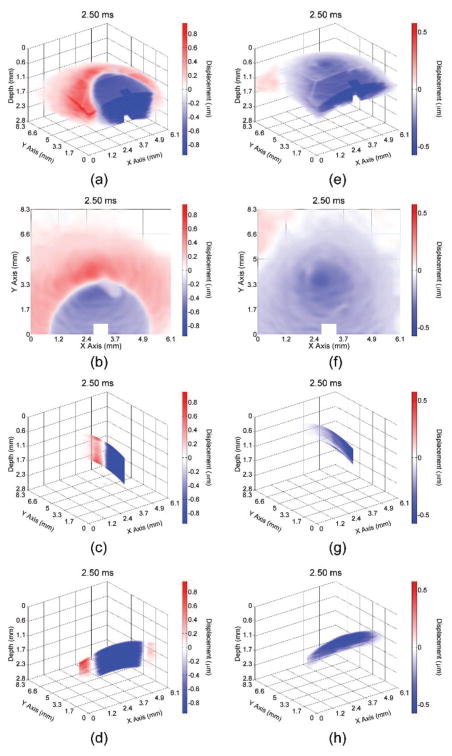
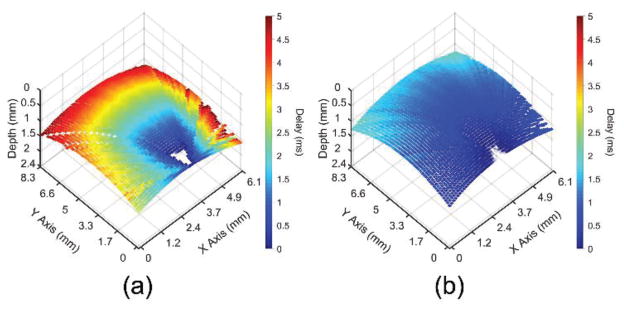
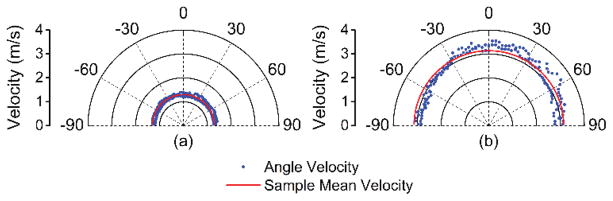
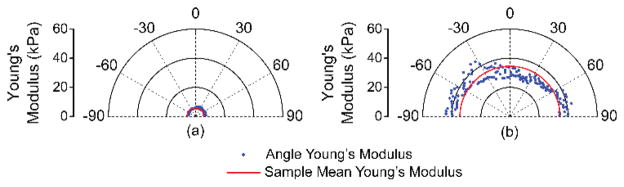
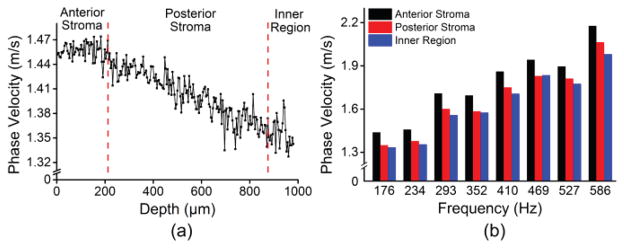
The mechanical properties of tissues can provide valuable information about tissue integrity and health and can assist in detecting and monitoring the progression of diseases such as keratoconus. Optical coherence elastography (OCE) is a rapidly emerging technique, which can assess localized mechanical contrast in tissues with micrometer spatial resolution. In this work we present a noncontact method of optical coherence elastography to evaluate the changes in the mechanical properties of the cornea after UV-induced collagen cross-linking. A focused air-pulse induced a low amplitude (μm scale) elastic wave, which then propagated radially and was imaged in three dimensions by a phase-stabilized swept source optical coherence tomography (PhS-SSOCT) system. The elastic wave velocity was translated to Young's modulus in agar phantoms of various concentrations. Additionally, the speed of the elastic wave significantly changed in porcine cornea before and after UV-induced corneal collagen cross-linking (CXL). Moreover, different layers of the cornea, such as the anterior stroma, posterior stroma, and inner region, could be discerned from the phase velocities of the elastic wave. Therefore, because of noncontact excitation and imaging, this method may be useful for in vivo detection of ocular diseases such as keratoconus and evaluation of therapeutic interventions such as CXL.

Keywords: Biomechanical properties; cornea; elasticity; optical coherence elastography.


Figures

Fig. 1
Fig. 1
PhS-SSOCE experimental setup for ocular samples. ADC: analog-to-digital converter. DAC: digital-to-analog converter.
Fig. 2
Fig. 2
En-face image of porcine cornea as imaged by the PhS-SSOCT system. The yellow dots are examples of the OCE measurement positions, the red “X” represents the air-pulse excitation location, and the center of the image is the apex of the cornea.
Fig. 3
Fig. 3
Propagation of the elastic wave in the 1% (a–d) and 2% (e–h) agar phantoms. Multiple views are shown, corresponding to a (a,e) 3D, (b,f) enface, (c,g) single longitudinal plane aligned with the excitation, and (d,h) single transverse plane near the excitation.
Fig. 4
Fig. 4
Elastic wave propagation delay map for a selected depth layer for the (a) 1% and (b) 2% agar phantoms with the same color scale.
Fig. 5
Fig. 5
Elastic wave velocity as a function of propagation angle for the (a) 1% and (b) 2% agar phantoms as compared to the mean from all angles for that sample.
Fig. 6
Fig. 6
Young’s modulus quantified by (3) as a function of propagation angle for the (a) 1% and (b) 2% agar phantoms as compared to the mean from all angles for that sample.
Fig. 7
Fig. 7
Elasticity of the agar phantoms as measured by OCE (n=151 propagation angles and averaged from all angles) and as measured by uniaxial mechanical testing (n=3 samples). The error bars for OCE indicate inter-angle standard deviation, and the error bars for mechanical testing indicate inter-sample standard deviation.
Fig. 8
Fig. 8
Propagation of the elastic wave in the porcine cornea (a–d) before and (e–h) after CXL treatment. Multiple views are shown, corresponding to a (a,e) 3D, (b,f) en-face, (c,g) single longitudinal plane aligned with the excitation, and (d,h) single transverse plane near the excitation.
Fig. 9
Fig. 9
Elastic wave propagation delay map for a single depth layer of the porcine cornea (a) before and (b) after CXL treatment with the same color scale.
Fig. 10
Fig. 10
Elastic wave velocity as a function of propagation angle for the porcine cornea (a) before and (b) after CXL treatment as compared to the mean from all angles for that sample.
Fig. 11
Fig. 11
Young’s modulus quantified by (3) as a function of propagation angle for the cornea (a) before and (b) after CXL treatment as compared to the mean from all angles for that sample.
Fig. 12
Fig. 12
(a) Depth-wise phase velocities of the elastic wave at 234 Hz for a single radial angle. (b) Phase velocities over a span of frequencies corresponding to the predominant spectral components of the elastic wave in the cornea for each discernable region of the porcine cornea.

References

    1. Yin M, Talwalkar JA, Glaser KJ, Manduca A, Grimm RC, Rossman PJ, et al. Assessment of hepatic fibrosis with magnetic resonance elastography. Clin Gastroenterol Hepatol. 2007 Oct;5:1207–1213. - PMC - PubMed
    1. van Popele NM, Grobbee DE, Bots ML, Asmar R, Topouchian J, Reneman RS, et al. Association between arterial stiffness and atherosclerosis The Rotterdam Study. Stroke. 2001 Oct;32:454–460. - PubMed
    1. Cross SE, Jin YS, Rao J, Gimzewski JK. Nanomechanical analysis of cells from cancer patients. Nat Nanotechnol. 2007 Dec;2:780–783. - PubMed
    1. Muthupillai R, Lomas DJ, Rossman PJ, Greenleaf JF, Manduca A, Ehman RL. Magnetic resonance elastography by direct visualization of propagating acoustic strain waves. Science. 1995 Sep;269:1854–1857. - PubMed
    1. Ophir J, Cespedes I, Ponnekanti H, Yazdi Y, Li X. Elastography: a quantitative method for imaging the elasticity of biological tissues. Ultrason Imaging. 1991 Apr;13:111–134. - PubMed

LinkOut - more resources